. 2025 Aug;644(8075):263-272.
doi: 10.1038/s41586-025-09018-7. Epub 2025 May 14.

Taurine from tumour niche drives glycolysis to promote leukaemogenesis

Affiliations

Taurine from tumour niche drives glycolysis to promote leukaemogenesis

Sonali Sharma et al. Nature. 2025 Aug.

Abstract

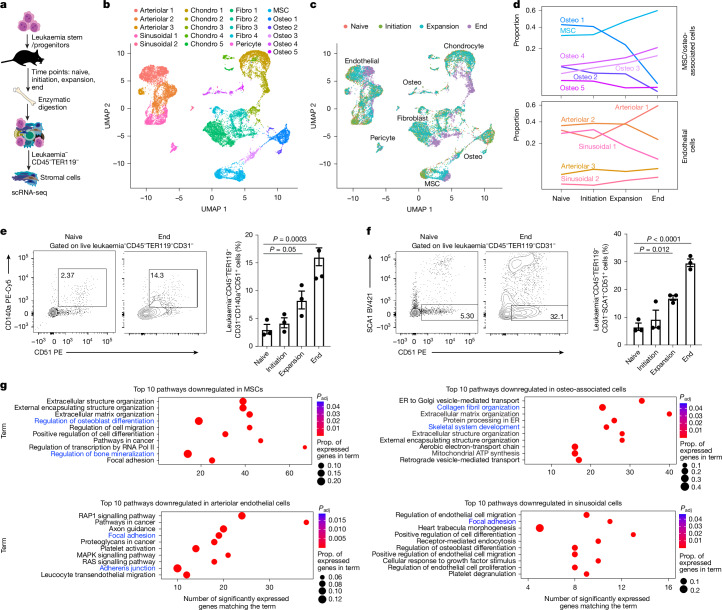
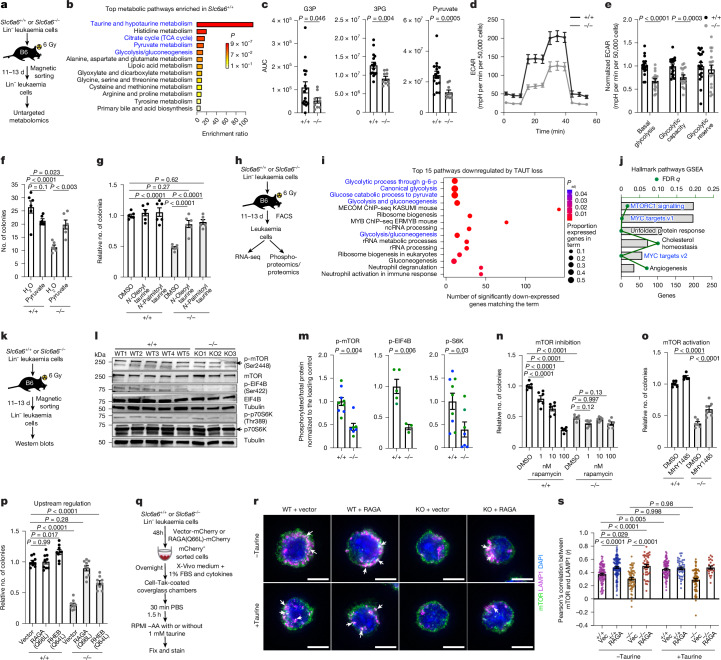
Signals from the microenvironment are known to be critical for development, stem cell self-renewal and oncogenic progression. Although some niche-driven signals that promote cancer progression have been identified1-5, concerted efforts to map disease-relevant microenvironmental ligands of cancer stem cell receptors have been lacking. Here, we use temporal single-cell RNA-sequencing (scRNA-seq) to identify molecular cues from the bone marrow stromal niche that engage leukaemia stem-enriched cells (LSCs) during oncogenic progression. We integrate these data with our human LSC RNA-seq and in vivo CRISPR screen of LSC dependencies6 to identify LSC-niche interactions that are essential for leukaemogenesis. These analyses identify the taurine-taurine transporter (TAUT) axis as a critical dependency of aggressive myeloid leukaemias. We find that cysteine dioxygenase type 1 (CDO1)-driven taurine biosynthesis is restricted to osteolineage cells, and increases during myeloid disease progression. Blocking CDO1 expression in osteolineage cells impairs LSC growth and improves survival outcomes. Using TAUT genetic loss-of-function mouse models and patient-derived acute myeloid leukaemia (AML) cells, we show that TAUT inhibition significantly impairs in vivo myeloid leukaemia progression. Consistent with elevated TAUT expression in venetoclax-resistant AML, TAUT inhibition synergizes with venetoclax to block the growth of primary human AML cells. Mechanistically, our multiomic approaches indicate that the loss of taurine uptake inhibits RAG-GTP dependent mTOR activation and downstream glycolysis. Collectively, our work establishes the temporal landscape of stromal signals during leukaemia progression and identifies taurine as a key regulator of myeloid malignancies.


Conflict of interest statement

Competing interests: The authors declare no competing interests.

Figures

Fig. 1
Fig. 1. Temporal scRNA-seq analysis of myeloid leukaemia bone marrow microenvironment.
a, The experimental strategy used to determine the impact of bcCML progression on bone-marrow microenvironment remodelling. b, A uniform manifold approximation and projection (UMAP) analysis of 15,695 non-haematopoietic cells from bone and bone marrow shows 21 distinct bone marrow stromal cell clusters (n = 3 (naive), n = 6 (initiation), n = 7 (expansion) and n = 9 (end) mice). The colour key indicates subclusters. Chrondro, chondrocyte; fibro, fibroblast; osteo, osteo-associated cell. c, UMAP plot of major population clusters over time (naive, 0 days; initiation, 2 and 4 days; expansion, 7 and 9 days; end, 11 and 14 days after transplant; the colours represent different stages of disease). d, The proportion (prop.) of MSCs/osteolineage cells (top) and endothelial cells (bottom) over time. e, Representative fluorescence-activated cell sorting (FACS) plots and quantification of MSC frequency over time. f, Representative FACS plots and quantification of the osteolineage cell frequency over time. For e and f, data are mean ± s.e.m. n = 3 animals per timepoint. Statistical analysis was performed using one-way analysis of variance (ANOVA). g, Unbiased Enrichr analysis showing the top 10 downregulated pathways by population cluster in MSCs, and osteo-associated, arteriolar and sinusoidal endothelial populations. Blue text represents pathways of interest. ER, endoplasmic reticulum. The mouse image in a is adapted from ref. , Springer Nature America. Source data
Fig. 2
Fig. 2. Bone marrow microenvironmental ligands for LSC-specific cell surface receptors.
a, Circos plot showing leukaemia cell surface receptors and cognate stromal-cell-derived ligands. b, Kaplan–Meier curves of human patients with leukaemia with low (<11.14, n = 80) or high (≥11.14, n = 81) SLC6A6 expression (TCGA-LAML; Xena Browser; log-rank test). CI, confidence interval; HR, hazard ratio. c, Normalized SLC6A6 expression in CD43+ cells from normal human bone marrow (BM) samples and samples from patients with bcCML and AML. n = 7 (bone marrow), n = 10 (bcCML) and n = 11 (AML). For the box plots, the centre line shows the median, the box limits show the interquartile range and the whiskers represent the minimum and maximum values, respectively. Statistical analysis was performed using DESeq2-implemented Wald tests. dg, Representative IHC images (d,f) and quantification (e,g) of CDO1 expression in matched patient bone marrow biopsies at MDS diagnosis and after AML transformation (d,e), or at AML diagnosis (AML-D) and relapse (AML-R) (f,g). n = 5 independent patients per cohort. Each colour represents a patient sample. Statistical analysis was performed using two-tailed ratio paired t-tests. h, The strategy used to determine the impact of inhibiting CDO1 in human bone marrow MSCs on co-cultured AML cells (MSCs and AML cells were derived from the same patient). CFU, colony-forming unit. i, The number of live LSCs (left; data are mean ± s.e.m.; n = 11 independent culture wells per cohort; data were combined from two independent experiments) and their colony-forming ability (right; data are mean ± s.d.; n = 3 independent culture wells per cohort) after coculture with AML MSCs. j, Taurine quantity per femur in control and leukaemic mice, as determined using colourimetric analysis, 12 days after transplant. Data are mean ± s.e.m. n = 5 animals per cohort. Data were combined from two independent experiments. For i and j, statistical analysis was performed using unpaired two-tailed Student’s t-tests. k, Experimental strategy and survival curve, showing the impact of blocking taurine production by MSC/osteolineage populations in vivo on bcCML progression in unirradiated recipients. n = 18 (Cdo1fl/fl/Cdo1+/+) and n = 14 (Cdo1fl/flPrrx1-cre+). Data were combined from four independent experiments. Statistical analysis was performed using the log-rank test. WT, wild type. Scale bars, 50 µm (d and f). The mouse images in h and k are adapted from ref. , Springer Nature America. Source data
Fig. 3
Fig. 3. TAUT loss impairs myeloid leukaemia initiation and propagation in mouse models.
a, Relative Slc6a6 mRNA expression in whole bone marrow cells from Slc6a6+/+ (+/+) and Slc6a6−/− (−/−) mice. Data are mean ± s.d. n = 3 replicates per cohort. b, Taurine in normal bone marrow cells. Data are mean ± s.e.m. n = 6 pelvic bones from three animals per cohort; data were combined from two independent experiments. c,d, The experimental strategy (c) and primary bcCML survival curve (d). n = 12 (+/+) and n = 11 (−/−). Data were combined from three independent experiments. e, CFU analysis of Lin bcCML cells from primary transplants. Data are mean ± s.d. n = 3 culture wells per cohort. f, Survival curve of secondary bcCML transplants. n = 11 (+/+) and n = 10 (−/−); data were combined from two independent experiments. g, CFU of Lin cells from secondary transplants. Data are mean ± s.d. n = 3 independent culture wells per cohort. h, Taurine in Lin LSCs. Data are mean ± s.e.m. n = 8 independent replicates per cohort from two independent samples. i,j, The experimental strategy (i) and survival curve (j) show the impact of TAUT loss on de novo MLL-AF9-driven AML. n = 17 (+/+) and n = 20 (−/−); data were combined from four independent experiments. k, Taurine in KIT+ AML cells. Data are mean ± s.e.m. n = 4 animals per cohort. l, CFU analysis of KIT+ AML cells. Data are mean ± s.d. n = 3 culture wells per cohort. m,n, Experimental strategy (m) and survival curve (n), showing the impact of TAUT loss on de novo AML-ETO9a-driven AML. n = 7 (+/+) and n = 10 (−/−). Data were combined from two independent experiments. o, Representative FACS plots and quantification of the LinCD150SCA1+FLT3+ bcCML stem cell frequency in the bone marrow (left) and spleen (right) of recipients. Data are mean ± s.e.m. n = 11 animals per cohort. Data were combined from three independent experiments. p, Representative FACS plots and quantification of early apoptosis and necrosis in bcCML at 14 days after transplant. Data are mean ± s.e.m. n = 8 animals per cohort. Data were combined from two independent experiments. q, Representative FACS plots and graph showing the frequency of in vivo BrdU incorporation in bcCML. Data are mean ± s.e.m. n = 3 animals per cohort. Statistical analysis was performed using unpaired two-tailed Student’s t-tests (b, e, g, h, k, l and oq) and log-rank tests (d, f, j and n). The mouse images in c, i and m are adapted from ref. , Springer Nature America. Source data
Fig. 4
Fig. 4. TAUT inhibition impairs growth of patient-derived AML cells.
a, SLC6A6 expression based on venetoclax (Ven) response (BEAT-AML). n = 193; dot plots show individual patients. Statistical analysis was performed using the DESeq2 log-rank test. b, SLC6A6 expression in primitive and monocytic ROSlow AML LSCs (Gene Expression Omnibus (GEO): GSE132511). n = 7 (primitive) and n = 5 (monocytic). For the box plots in a and b, the centre line shows the median, the box limits show the interquartile range and the whiskers represent 1.5 × interquartile range. c, SLC6A6 expression of human NRASG12D+ versus wild-type cells (GEO: GSE253715). Statistical analysis was performed using the Seurat Findmarker function with the Wilcoxon rank-sum test. d,e, CFU analysis of primary human AML (d) or normal human CD34+ bone marrow HSPCs (e) treated with dimethyl sulfoxide (DMSO)/water (control) or the indicated doses of TAG and GES. For d and e, data are mean ± s.e.m. n = 3 independent culture wells per sample from two independent samples; each colour represents a sample. f,g, CFU analysis of human AML cells treated with DMSO/water (control) or venetoclax (ABT-199) in combination with the indicated doses of TAG (f) or GES (g). Data are mean ± s.e.m. n = 3 independent culture wells per sample from two independent primary human AML samples. Each colour represents a sample. h, The combination index of GES and venetoclax calculated per fraction affected (left) and the normalized isobologram (right), as determined using the Chou–Talalay method. n = 2 independent primary human AML samples. Colours represent independent samples; shapes represent indicated venetoclax and GES combinations. D, drug dose; Dx, median-effect dose. i,j, CFU analysis of primary human AML cells (i) or normal CD34+ HSPCs (j) that were transduced with lentiviral shRNAs targeting LacZ (control) or human SLC6A6. Data are mean ± s.e.m. n = 3 independent culture wells from n = 3 independent primary human patient samples. Each colour represents an independent sample. km, Experimental strategy (k) and representative FACS plots and graph, showing bone marrow engraftment of primary human AML (l) or primary human normal CD34+ HSPC (m) cells. The black lines show the mean. n = 9 animals per cohort from n = 4 independent primary human AML samples (l); and n = 13 animals per cohort from n = 5 independent normal human CD34+ HSPC samples (m). Each dot represents an animal; each colour represents an independent sample. Statistical analysis was performed using two-sample Wilcoxon tests (b), one-way ANOVA (dg) and unpaired two-tailed Student’s t-tests (i, j, l and m). The mouse and culture well images in k are adapted from ref. , Springer Nature America. Source data
Fig. 5
Fig. 5. TAUT loss impairs glycolysis and mTOR signalling in myeloid leukaemia cells.
a, The untargeted metabolomics strategy. b, Unbiased Enrichr analysis (MetaboAnalyst; Padj ≤ 0.05). TCA, tricarboxylic acid. c, Quantification of glycolysis-associated metabolites. Data are mean ± s.e.m. n = 16 samples from n = 6 Slc6a6+/+ leukaemic mice and n = 9 samples from n = 3 Slc6a6−/− leukaemic mice. Statistical analysis was performed using unpaired Student’s t-tests with Welch’s correction. AUC, area under the curve; G3P, glyceraldehyde-3-phosphate; 3PG, 3-phosphoglyceric acid. d,e, Extracellular acidification (ECAR) curve (d) and quantification (e). Data are mean ± s.e.m. n = 18 independent culture wells per cohort from four bcCML samples. Data are combined from four independent experiments. f,g, CFU analysis of Lin bcCML cells supplemented with 1 mM pyruvate (f) or 80 μM cell-permeable taurine conjugates (g). Data are mean ± s.e.m. n = 3 independent culture wells per cohort. Data were combined from two independent experiments. h, Experimental strategy. i, Unbiased Enrichr analysis of transcriptomic data. ChIP–seq, chromatin immunoprecipitation followed by sequencing; g-6-p, glucose-6-phosphate; ncRNA, non-coding RNA. j, Gene sets significantly enriched in Slc6a6+/+ leukaemic mice. GSEA, gene set enrichment analysis. km, Schematic (k), immunoblot (l) and quantification (m) of the indicated proteins (Extended Data Fig. 11e). Data are mean ± s.e.m. n = 9 (Slc6a6+/+) and n = 7 (Slc6a6−/−) for p-mTOR and p-pS6K. Data were combined from two independent experiments, indicated by the two colours. n = 5 (Slc6a6+/+) and n = 3 (Slc6a6−/−) for p-EIF4B. For d, e and m, statistical analysis was performed using unpaired two-tailed Student’s t-tests. n,o, CFU analysis of Lin bcCML cells treated with rapamycin (n) or 2 μM mTOR activator MHY1485 (o). Data are mean ± s.e.m. n = 6 independent culture wells per cohort. Data were combined from two independent experiments. p, CFU analysis of Lin bcCML cells infected with vector, RAGA(Q66L) or RHEB(Q64L). Data are mean ± s.e.m. n = 9 independent culture wells per cohort. Data were combined from three independent experiments. qs, The strategy to determine mTOR and LAMP1 co-localization in Lin bcCML cells infected with RAGA(Q66L) or vector (vec) with or without taurine (q), microscopy images (r) and analysis (s). n = 83 (Slc6a6+/+, vector, −taurine), 58 (Slc6a6−/−, vector, −taurine), 125 (Slc6a6+/+, RAGA, −taurine), 43 (Slc6a6−/−, RAGA, −taurine), 78 (Slc6a6+/+, vector, +taurine), 68 (Slc6a6−/−, vector, +taurine), 40 (Slc6a6+/+, RAGA, +taurine) and 23 (Slc6a6−/−, RAGA, +taurine). Data were combined from two independent experiments. mTOR and LAMP1 co-colocalization is indicated by white arrows. AA, amino acids; KO, knockout. For f, g, np and s, statistical analysis was performed using one-way ANOVA. Scale bars, 5 μm (r). Blue text in b, i and j represents pathways of interest. The mouse and culture well images in a, h, k and q are adapted from ref. , Springer Nature America. Source data
Extended Data Fig. 1
Extended Data Fig. 1. Temporal changes in leukaemia bone marrow microenvironment.
a, Survival curve shows bcCML progression in unirradiated recipients, indicating time course for scRNA-seq experiment (naïve, initiation, expansion, and end). b, Representative FACS plots and graph show changes in leukaemia engraftment over time (2 or 3 mice pooled per timepoint). c, Heatmap of significantly expressed marker genes for non-haematopoietic Bone Marrow (BM) populations. d, Line graphs show temporal changes in the proportion of all major lineages, and in sub-clusters of chondrocyte and fibroblasts. e, Representative FACS plots and graph show changes in BM sinusoidal and arteriolar endothelial cell frequency over time (mean ± s.e.m.; n = 3 animals per timepoint, two-way ANOVA). f, Gene clusters associated with changes in MSC, chondrocyte, and arteriolar endothelial populations during disease progression. Source data
Extended Data Fig. 2
Extended Data Fig. 2. Signals from bone marrow niche interacting with human LSC cell surface receptors.
a, Unbiased Enrichr analysis shows top 10 upregulated pathways by population cluster in MSCs, osteo-associated, arteriolar, and sinusoidal endothelial populations. b, PCA-plot shows the distribution of 7 CD34+ healthy donor BM HSPCs, 10 bcCML CD34+ LSCs, and 11 AML CD34+ LSCs from human samples. c, Overlap between genes upregulated in bcCML and AML CD34+ cells compared to normal CD34+ cells, proteins expressed on cell surface, and those that drop-out by 2-fold or more in the leukaemia in vivo CRISPR screen. d, Heatmap shows r-log normalized RNA expression of cell surface receptors upregulated in AML, bcCML or both. e, Average expression of ligands for cell surface proteins in primary human adult and paediatric AML cells, human AML immune microenvironment populations, and in normal cells.
Extended Data Fig. 3
Extended Data Fig. 3. Temporal changes in niche-driven signals.
a-d, UMAP plot of indicated gene expression in microenvironmental populations over time (naïve: 0 d, initiation: 2 and 4 days, expansion: 7 and 9 days and, end:11 and 14 days post-transplant).
Extended Data Fig. 4
Extended Data Fig. 4. CDO1 expression in human leukaemia microenvironment.
a, Kaplan-Meier curves of human leukaemia patients with high (<9.32, n = 80) or low (≥9.32, n = 81) LDLR expression (TCGA-LAML; Xena Browser; log-rank test). b, Normalized LDLR expression in CD34+ cells from human bcCML, AML, or normal BM (n = 7 normal BM, n = 10 bcCML, n = 11 AML; central line, box, and whiskers represent median, interquartile range or IQR, minimum/maximum within 1.5*IQR respectively; DESeq2 implemented Wald test). c, d, Experimental strategy (c) and relative Apoe expression (d) in MSCs transduced with shRNAs targeting LacZ or Apoe (mean ± s.d.; n = 3 technical replicates per cohort). e,f, Number of live leukaemia cells (e) and their colony forming ability (CFU) (f) post co-culture with MSCs (mean ± s.e.m.; e, n = 8 independent culture wells; f, n = 6 independent culture wells, data combined from two independent experiments; unpaired two-tailed Student’s t-test). g, Slc6a6 expression in KLS cells infected with BCR-ABL and NUP98-HOXA9 (BA-NH) oncogenes for 48 h (mean ± s.d.; n = 3 technical replicates per cohort). h, Taurine biosynthesis pathway. i, Dot plot of Cdo1 and Csad expression during disease progression. j, UMAP plot of CDO1 and CSAD expression in normal human BM. k, UMAP plot of microenvironmental cells in three human MDS or AML BM aspirates. l, UMAP plot of CDO1 and CSAD in human MDS and AML BM aspirates. m-p, Representative IHC images and quantification of Osterix expression in matched human BM biopsies at MDS diagnosis and AML transformation (m, n) or AML diagnosis and relapse (o,p) (n = 5 independent patients per cohort; each colour represents a patient sample; two-tailed ratio paired t-test). The mouse image in c is adapted from ref. , Springer Nature America. Source data
Extended Data Fig. 5
Extended Data Fig. 5. Inhibiting taurine synthesis in osteolineage cells impairs LSC growth.
a, b, Alizarin red staining (a), and Cdo1 and Csad expression (b) in MSCs undergoing osteogenic differentiation (mean ± s.d.; n = 3 technical replicates per cohort). c, CDO1 expression in murine leukaemia and patient AML MSCs undergoing osteogenic differentiation (mean ± s.e.m.; n = 3 replicates per time point). d, Taurine in MSC culture media during osteogenic differentiation (mean ± s.e.m.; n = 3 replicates; secreted over 48–72 h). e,f, Experimental strategy (e) and Cdo1 expression (f) in MSCs transduced with shRNAs targeting LacZ or Cdo1 (mean ± s.d.; n = 3 technical replicates per cohort). g, Live leukaemia cells (left), and CFU (right), post coculture with bcCML MSCs (mean ± s.e.m.; n = 7 independent culture wells per cohort (live); n = 6 (CFU); data combined from 2 independent experiments; one-way ANOVA). h, CDO1 expression in 293 T transduced with shRNAs targeting LACZ or CDO1 (mean ± s.d.; n = 3 technical replicates per cohort). i, Cdo1fl/fl model. j,k, PCR of Cdo1 (j) and Cdo1 expression (k) in Cdo1fl/fl and Cdo1fl/fl;Prrx1-Cre+ MSCs following osteogenic differentiation (mean ± s.d.; n = 3 technical replicates per cohort). l-n, BM stroma in leukaemic control and Cdo1fl/fl;Prrx1-Cre+ mice: MSCs (l), osteolineage cells (m), and, endothelial cells (n) (mean ± s.e.m.; n = 7 Cdo1fl/fl and n = 3 Cdo1fl/fl;Prrx1-Cre+; data combined from three independent experiments; unpaired two-tailed Student’s t-test). o-q, CFU of murine cKit+ AML cells (o), murine Lin LSCs (p), or primary human AML cells (q) with taurine (mean ± s.e.m.; n = 3 independent culture wells from n = 2 murine AML, n = 2 murine bcCML, and n = 3 primary human AML samples; data combined from two independent experiments; one-way ANOVA). r, Impact of taurine supplements on murine bcCML progression in unirradiated recipients (n = 14 no taurine and 0.01 mg/ml taurine, n = 15 10 mg/ml taurine; data combined from three independent experiments; log-rank test). The mouse image in e is adapted from ref. , Springer Nature America. Source data
Extended Data Fig. 6
Extended Data Fig. 6. Impact of TAUT loss on leukaemia development in murine models.
a, Number of live LSCs (left) and their CFU (right) post co-culture with leukaemic MSCs transduced with shCdo1 or shLacZ (mean ± s.e.m.; n = 6 independent culture wells; data combined from 2 independent experiments; one-way ANOVA). b, Survival curve shows the impact of taurine supplements on murine leukaemia progression in irradiated recipients (n = 10 per cohort; data combined from two independent experiments; log-rank test). c, Representative FACS plots and quantification of BM engraftment in cancer at initiation and end point (mean ± s.e.m.; n = 3 +/+ and n = 5 −/−; data combined from two independent experiments). d-g, Graph (d) shows number of microenvironmental cells per mouse leg. Representative FACS plots and quantification of MSC (e), osteolineage (f), and endothelial (g) frequency (left) and total cell number (right) at initiation and end point (mean ± s.e.m.; n = 3 +/+ and n = 5 −/−; data combined from two independent experiments). h, Representative FACS histogram and quantification of Lin+ frequency in bcCML BM (mean ± s.e.m.; n = 14 animals per cohort; data combined from three independent experiments; c, e-h unpaired two-tailed Student’s t-test). Source data
Extended Data Fig. 7
Extended Data Fig. 7. The role of TAUT in normal haematopoietic stem cell function.
a, Average number of BM cells in +/+ and −/− mice (mean ± s.e.m.; n = 5 animals per cohort). b-d Representative FACS plots, and quantification of frequency (left) and cell number (right) of hematopoietic stem cells (b, HSC: LincKit+Sca+CD150+CD48) and multipotent progenitors (b, MPPs: LincKit+Sca+CD150CD48), committed granulocyte–macrophage progenitors (c, GMP: LinIL7RaKit+Sca1CD34+CD16/3+), common myeloid progenitors (c, CMP: LinIL7RaKit+Sca1CD34+CD16/32), megakaryocyte–erythroid progenitors (c, MEP: LinIL7RaKit+Sca1CD34CD16/32), and differentiated haematopoietic cells (d) in the BM of +/+ and −/− mice (mean ± s.e.m.; n = 5 animals per cohort; data combined from four independent experiments). e, Complete blood count of indicated cells and haemoglobin content in the peripheral blood of age and sex-matched 8-week-old littermates (mean ± s.e.m.; n = 11 +/+ and n = 13 −/−; data combined from two independent experiments). f-g, Experimental strategy (f), donor engraftment in peripheral blood over time (g). h-k, Average donor chimerism (h), frequency of KLS (LincKit+Sca+), HSCs, and MPPs (i), committed progenitors GMP, CMP, and MEP (j) and, differentiated haematopoietic cells (k) in primary recipient BM four months post-transplant (f-k: mean ± s.e.m.; n = 9 +/+ and n = 10 −/−; data combined from two independent experiments). l, Donor engraftment in peripheral blood of secondary recipients (mean ± s.e.m.; n = 6 animals per cohort; g, l, two-way ANOVA). m-q, Average donor chimerism (m), frequency of KLS, HSCs, and MPPs (n), committed progenitors GMP, CMP, and MEP (o), and differentiated haematopoietic cells (p, q) in BM of secondary recipients four months post HSC transplant (mean ± s.e.m.; n = 6 animals per cohort; a-e, h-k, m-q unpaired two-tailed Student’s t-test). The mouse images in f are adapted from ref. , Springer Nature America. Source data
Extended Data Fig. 8
Extended Data Fig. 8. Taurine inhibition synergizes with venetoclax in vitro.
a, SLC6A6 expression in human AML stem cells, progenitors and mature blasts (Gene Expression Commons). b, SLC6A6 expression by karyotype or FAB subtype (TCGA-AML, n = 146 karyotype and n = 149 FAB subtype; dot represents an individual patient). c, SLC6A6 expression in relapse origin-committed (ROC) and relapse origin-primitive (ROP) AML (n = 29 ROC and n = 10 ROP); (b-c central line, box, and whiskers represent median, interquartile range, minimum/maximum point within 1.5*IQR respectively; unpaired two-samples Wilcoxon test). d, Taurine in Lin bcCML cells treated with DMSO or TAG (mean±s.e.m.; n = 8 independent wells combined from 2 experiments). e, Taurine in Lin bcCML cells treated with GES or water (mean±s.e.m.; n = 5 independent culture wells; d-e unpaired two tailed Student’s t-test). f-h, CFU of Lin bcCML (f), ckit+ AML LSC (g) with DMSO or indicated doses of TAG, or Lin bcCML with water or indicated doses of GES (h)(mean±s.e.m.; n = 3 independent culture wells per cohort; data combined from two independent experiments for f,h). i, j, Viability (i) and CFU (j) of murine Lin bcCML cells treated with 0.5 mM venetoclax (ABT-199, Ven) for 48 h (n = 3 independent culture wells per cohort; data combined from two (i) or three (j) independent experiments; two-way ANOVA). k, CFU of Lin bcCML cells with DMSO/water, Ven, or indicated doses of TAG (left) and GES (right), or indicated combinations (mean ± s.e.m.; n = 3 per independent culture wells; data combined from 2 or 3 independent experiments). l, CFU of cKit+ AML LSC with DMSO/water, Ven, GES, or indicated combinations (mean±s.e.m.; n = 3 independent culture wells; data combined from 2 independent experiments, f-h, j-l one-way ANOVA). m, Combination index of GES and Ven per fraction affected (left) and isobologram (right) by Chou-Talalay method (n = 3 independent culture wells; data combined from 3 independent experiments; colours represent sample type, shapes represent Ven/GES combinations). Source data
Extended Data Fig. 9
Extended Data Fig. 9. Taurine inhibition in vivo.
a, Survival curve showing the impact of treating mice transplanted with Lin bcCML cells with GES (2.5%), Ven (50 mg/kg), or their combination (n = 10 control, n = 12 GES, n = 6 Ven, n = 8 GES/Ven); data combined from three independent experiments; lines below graph represent days of treatment; log-rank test). b, Taurine in 107 BM cells from leukaemic mice treated with indicated amounts of GES for 13–16 d (mean ± s.e.m.; n = 3 technical replicates per cohort). c, d, Experimental strategy (c) and mass (d) of mice during treatment with GES, TAG, or control (mean ± s.e.m.; n = 3 animals per cohort; two-way ANOVA). e,f, Viability (e) and average number of BM cells (f) (mean ± s.e.m.; n = 6 mice per cohort; data combined from two independent experiments). g-h, Representative FACS plots (left), and number (right) of HSC and MPP (g), and differentiated haematopoietic cells (h) (mean ± s.e.m.; n = 6 animals per cohort; data combined from two independent experiments; two-way ANOVA). i, Haematoxylin & Eosin staining of indicated tissues in treated animals. j, Intracellular taurine levels by LC/MS in BM cells from treated animals (mean ± s.e.m.; n = 8 independent replicates from n = 3 control, n = 10 from 4 GES, n = 9 from 3 TAG treated animals; each colour represents a mouse). k, l, SLC6A6 expression (k) and taurine levels (l) in K562 cells transduced with shRNAs targeting LacZ and SLC6A6 (mean ± s.d.; n = 3 technical replicates per cohort). m-o, CFU of human leukaemia cell lines transduced with lentiviral shRNAs targeting LacZ or SLC6A6, K562 (m), THP1 (n), and MV-4-11 (o) (mean ± s.d.; n = 3 independent culture wells per cohort). p, Relative SLC6A6 expression (left; mean ± s.d.; n = 3 technical replicates per cohort) and CFU (right) in MDS-L cells transduced with shRNAs targeting Luc and SLC6A6 (mean ± s.e.m.; n = 9 independent culture wells per cohort; data combined from 3 independent experiments; b, e-h, j, l-p one-way ANOVA). The mouse image in c is adapted from ref. , Springer Nature America. Source data
Extended Data Fig. 10
Extended Data Fig. 10. TAUT loss impairs energy metabolism in myeloid leukaemia.
a, Quantification of taurine and glycolysis associated metabolites in +/+ and −/− Lin bcCML cells (mean ± s.e.m.; n = 16 samples from n = 6 +/+ leukaemic mice and n = 9 samples from n = 3 −/− leukaemic mice; unpaired two-tailed Student’s t-test with Welch’s correction). b, Curve and quantification of normalized of oxygen consumption rate (OCR) in Lin bcCML cells (mean ± s.e.m.; n = 10 independent culture wells per cohort from 3 bcCML samples; data combined from three independent experiments; unpaired two-tailed Student’s t-test). c-e, Impact of supplementing 5 mM sod. acetate (c), lactate (d), or indicated amounts of glucagon (e) on the CFU of Lin bcCML cells (mean ± s.e.m.; n = 3 independent culture wells per cohort; data combined from 2 independent experiments; one-way ANOVA). f, Experimental strategy used to determine 13C taurine tracing in K562 cells by untargeted metabolomics. g, Incorporation of 13C label from taurine in indicated metabolites (mean ± s.e.m.; n = 5 independent biological replicates). h,i, Colony-forming ability of Lin bcCML cells in the presence of 160 mM N-acetyl taurine (h) or indicated amounts of glutaurine (i) (mean ± s.e.m.; n = 3 independent culture wells per cohort; data combined from two independent experiments; one-way ANOVA). Source data
Extended Data Fig. 11
Extended Data Fig. 11. Transcriptomic and proteomic analysis of leukaemia in the absence of TAUT.
a, Top 20 upregulated pathways in −/− time matched bcCML cells as compared to +/+ controls. b, Heatmap of glycolysis associated genes in bcCML samples. c, GSEA showing downregulation of genes associated with Myc and mTORC1 pathways on TauT loss (a-c, n = 3 animals per cohort). d, Relative expression of glycolysis associated genes in +/+ and −/− Lin bcCML cells (mean ± s.d.; n = 3 technical replicates per cohort). e, Western blot shows phospho-mTOR (pmTOR), mTOR, phosopho-p70S6k (p-p70S6K), p70S6K, and actin protein expression in +/+ and −/− Lin bcCML cells (also see Fig. 5k–m, n = 4 independent disease end point samples/cohort). f, Volcano plot of global proteome (upper panel) and phosphoproteome (bottom panel) with differential abundance in +/+ and −/− leukaemia cells from time matched recipients (n = 5 animals per cohort). g, Normalized abundance of mTOR pathway proteins (mean ± s.e.m.; n = 5 animals per cohort; unpaired two-tailed Student’s t-test). h, Expression of glycolysis related genes in +/+ Lin bcCML treated with indicated doses of TAG for 72 h (mean ± s.d.; n = 3 technical replicates per cohort). i, Expression of glycolysis related genes in +/+ Lin bcCML treated with 1 mM GES for 72 h (mean ± s.d.; n = 3 technical replicates per cohort). Source data
Extended Data Fig. 12
Extended Data Fig. 12. Taurine activates mTOR to promote leukaemia growth.
a,b, Immunoblot and quantification of mTOR pathway proteins in +/+ Lin bcCML treated with indicated doses of TAG (a, mean ± s.d.; n = 2 replicates per cohort) or 1 mM GES (b, mean ± s.e.m.; n = 4 samples per cohort). c-f, Experimental strategy (c), immunoblot (d, f), and quantification (e) of indicated proteins in Lin bcCML cells +/− 200 mM taurine (mean ± s.e.m.; n = 3 biological replicates; gels processed in parallel; tubulin run on each gel as sample processing control). g,h, Immunoblots (g), and quantification (h) of mTOR pathway proteins in Lin bcCML cells from leukaemic mice supplemented with taurine for 10 days (mean ± s.e.m.; n = 4 control and n = 5 taurine; b, e, h unpaired two-tailed Student’s t-test). i, Survival curve shows impact of 5 mg/kg rapamycin treatment for 6 d on leukaemia progression. Line represents treatment days (n = 9 +/+ and n = 5 −/−; data combined from two independent experiments; log-rank test). j, Histogram and geometric Mean Fluorescence Intensity (MFI) of p-mTOR in Lin bcCML cells treated with DMSO or N-Oleoyl taurine for 36–40 h. (mean ± s.e.m.; n = 4 samples per cohort; data combined from two independent experiments). k,l, Expression of glycolysis genes in +/+ Lin bcCML cells treated with rapamycin for 24 h (k; mean ± s.d.; n = 3 technical replicates per cohort) or 2 mM MHY1485 for 48 h (l; mean ± s.e.m.; n = 3 technical replicates per cohort; data combined from two independent experiments). m, Histogram and MFI of p-mTOR in Lin bcCML cells infected with vector or RagA(Q66L) (mean ± s.e.m.; n = 6 samples per cohort; data combined from two independent experiments). n, CFU of Lin bcCML cells infected with vector or RagAQ66L and treated with indicated amounts of taurine (mean ± s.e.m.; n = 3 independent culture wells per cohort; data combined from two independent experiments; j, l-n one-way ANOVA). o, Schematic shows taurine from BM osteolineage cells promotes RagA-dependent mTOR activation and glycolysis in leukaemia cells to drive disease progression. The culture well image in c is adapted from ref. , Springer Nature America. Source data

References

    1. Bajaj, J. et al. CD98-mediated adhesive signaling enables the establishment and propagation of acute myelogenous leukemia. Cancer Cell30, 792–805 (2016). - PMC - PubMed
    1. Kaur, A. et al. sFRP2 in the aged microenvironment drives melanoma metastasis and therapy resistance. Nature532, 250–254 (2016). - PMC - PubMed
    1. Kwon, H. Y. et al. Tetraspanin 3 is required for the development and propagation of acute myelogenous leukemia. Cell Stem Cell17, 152–164 (2015). - PMC - PubMed
    1. Orimo, A. et al. Stromal fibroblasts present in invasive human breast carcinomas promote tumor growth and angiogenesis through elevated SDF-1/CXCL12 secretion. Cell121, 335–348 (2005). - PubMed
    1. Vermeulen, L. et al. Wnt activity defines colon cancer stem cells and is regulated by the microenvironment. Nat. Cell Biol.12, 468–476 (2010). - PubMed

MeSH terms