. 2025 Jun;642(8069):1073-1079.
doi: 10.1038/s41586-025-08992-2. Epub 2025 May 14.

Divergent DNA methylation dynamics in marsupial and eutherian embryos

Affiliations

Divergent DNA methylation dynamics in marsupial and eutherian embryos

Bryony J Leeke et al. Nature. 2025 Jun.

Abstract

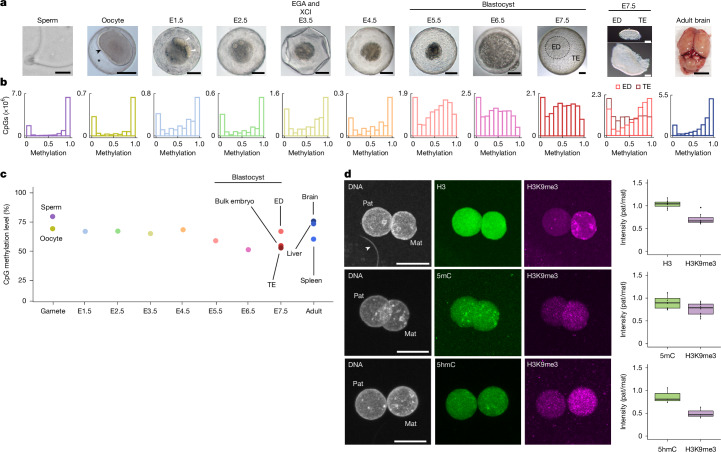
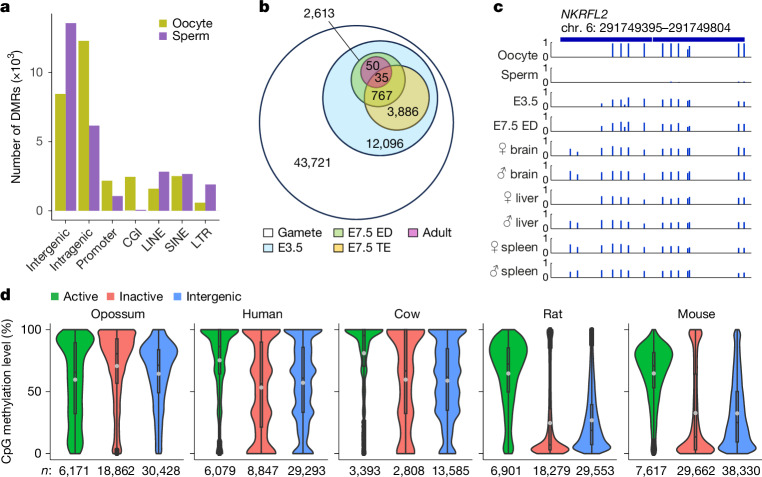
Based on seminal work in placental species (eutherians)1-10, a paradigm of mammalian development has emerged wherein the genome-wide erasure of parental DNA methylation is required for embryogenesis. Whether such DNA methylation reprogramming is, in fact, conserved in other mammals is unknown. Here, to resolve this point, we generated base-resolution DNA methylation maps in gametes, embryos and adult tissues of a marsupial, the opossum Monodelphis domestica, revealing variations from the eutherian-derived model. The difference in DNA methylation level between oocytes and sperm is less pronounced than that in eutherians. Furthermore, unlike the genome of eutherians, that of the opossum remains hypermethylated during the cleavage stages. In the blastocyst, DNA demethylation is transient and modest in the epiblast. However, it is sustained in the trophectoderm, suggesting an evolutionarily conserved function for DNA hypomethylation in the mammalian placenta. Furthermore, unlike that in eutherians, the inactive X chromosome becomes globally DNA hypomethylated during embryogenesis. We identify gamete differentially methylated regions that exhibit distinct fates in the embryo, with some transient, and others retained and that represent candidate imprinted loci. We also reveal a possible mechanism for imprinted X inactivation, through maternal DNA methylation of the Xist-like noncoding RNA RSX11. We conclude that the evolutionarily divergent eutherians and marsupials use DNA demethylation differently during embryogenesis.


Conflict of interest statement

Competing interests: The authors declare no competing interests.

Figures

Fig. 1
Fig. 1. DNA methylation dynamics in opossum embryos.
a, Light microscopy images of gametes, E1.5–E7.5 opossum embryos and brain. ED, embryonic disc; TE, trophectoderm. Scale bars, 10 μm (sperm), 100 μm (embryos) and 0.5 cm (brain). The black arrowhead marks the zona pellucida; the asterisk marks the mucoid coat; the white arrowheads mark blastomeres. Sample numbers are provided in Supplementary Table 1. b, Histograms of DNA methylation distribution at CpG sites captured at ≥5× coverage (note different scales on y axes). c, Mean DNA methylation level across developmental time. d, Micrographs: pronuclear-stage embryos (29.5 h post coitum) immunostained for histone H3 (n = 7), 5mC (n = 8) or 5hmC (n = 3) and co-immunostained for H3K9me3. The two pronuclei (Pat, paternal; Mat, maternal) are of equivalent size (unlike in mice), but the paternal pronucleus is often marked by proximity to the sperm tail (arrowhead in first panel). Scale bars, 20 μm. Plots: quantification of the data. The centre line indicates the median, the bounds indicate the first and third quartiles, and the whiskers indicate 1.5× interquartile range (IQR). The more granular appearance of H3K9me3 in the middle and bottom panel is due to acid treatment of these samples, which is required for 5mC and 5hmC visualization. Source data
Fig. 2
Fig. 2. Differential methylation in opossum trophectoderm and EPI.
a, Mean methylation level in blastocyst single cells before and after lineage segregation. nE5.5 = 58, nE6.5 EPI = 19, nE6.5 TE = 19, nE7.5 EPI = 24, nE7.5 TE = 14. The centre line indicates the median, the bounds indicate the first and third quartiles, and the whiskers indicate 1.5× IQR. b, Segmentation of the genome into contiguous regions with similar methylation levels (segments 1–3) according to embryonic disc (ED) and trophectoderm (TE) methylation patterns. Presence of long segments with an intermediate level of methylation in the trophectoderm is indicative of partially methylated domains in this tissue. c, Mean expression of DNA methylation machinery derived from previous RNA-seq data. Error bars represent 1.96 × s.e.m. noocyte = 6, nE1.5 = 7, nE2.5 = 21, nE3.5 = 62, nE4.5 = 55, nE5.5 = 140, nE6.5 = 201, nE7.5 EPI = 108, nE7.5 TE = 55. Source data
Fig. 3
Fig. 3. DNA methylation in sperm and oocytes.
a, Genomic distribution of gamete DMRs. b, Fate of gamete DMRs during embryogenesis. c, DNA methylation levels at individual CpG sites at a representative region of the imprinted NKRFL2 locus. d, DNA methylation profiles in eutherian and opossum oocytes at genes transcribed in oocytes (active), genes not transcribed in oocytes (inactive) and intergenic regions. The centre line indicates the median, the grey circle indicates the mean, the bounds indicate the first and third quartiles, and the whiskers indicate 1.5× IQR. Source data
Fig. 4
Fig. 4. DNA methylation status of the opossum X chromosome and RSX locus.
a, Methylation distribution of the autosomes and X chromosome in adult male and female brain represented as density plots showing the distribution of the data and the probability of a variable being a certain value. b, Methylation distribution of the autosomes and X chromosome in male and female gametes and embryos. c, Methylation at the RSX locus in gametes, embryos and adult tissues. d, Quantitative PCR analysis in DNMT1-knockout (KO) immortalized male fibroblasts. ncontrol = 3, nDNMT1 KO = 3. Unpaired t-test. Each point represents the mean of the replicates. Error bars represent s.e.m. e, RSX RNA fluorescence in situ hybridization in wild-type and DMNT1-KO day-8 immortalized male fibroblasts. DAPI, 4′,6-diamidino-2-phenylindole. Scale bars, 20 μm. f, Quantification of RSX clouds in RNA fluorescence in situ hybridization at 4 and 8 days after DNMT1 deletion. g, X/A gene expression ratios at 4 and 8 days after DNMT1 deletion. ncontrol = 3, nDNMT1 KO = 3. Unpaired t-test. Error bars represent s.d. Each point represents the median X/A ratio per replicate. h, Schematic of DNA methylation status in eutherian (left) and opossum (right) embryos. Source data
Extended Data Fig. 1
Extended Data Fig. 1. Description of mouse and opossum BS-seq data.
a. Histograms of methylation distribution at CpG sites captured at ≥ 5x coverage in mouse sperm (n = 2 libraries of ~100 sperm, in silico pooled), E3.5 embryos (n = 3, in silico pooled), and adult brain (n = 2, in silico pooled) (please note variable scales on y-axes). b. Principal component analysis of opossum methylation in all samples. c. Percentage of CpG sites captured at different coverage thresholds. d. Percentage of captured CpG sites for different chromosomes and genomic features. Source data
Extended Data Fig. 2
Extended Data Fig. 2. Opossum BS-seq data and mouse immunoanalysis.
a. Histograms of methylation distribution at CpG sites captured at ≥ 5x coverage in opossum adult liver and spleen. b. Pronuclear stage mouse embryos immunostained for 5-methylcytosine (5mC; n = 51), or 5-hydroxymethylcytosine (5hmC; n = 6), each co-immunostained for H3K9me3. mat = maternal, pat = paternal, pb = polar body. Scale bar = 10μm. c. Pairwise comparisons of percentage significantly differentially methylated sites (Fisher’s exact test, q-value <= 0.01, methylation difference 0.25) across entire developmental time course. For each comparison, “higher” and “lower” refers to the status of the second sample listed on the x-axis relative to the first sample d. Histograms of DNA methylation distribution at CpG sites captured at ≥ 5x coverage for each genomic feature (please note variable scale on y-axes). Source data
Extended Data Fig. 3
Extended Data Fig. 3. DNA methylation and expression of repetitive elements in opossum embryos.
a. Metaplots of methylation across L1, MIR, and ERV1 loci in opossum embryos. b. Expression of LINE, SINE and LTR repetitive elements in opossum embryos. Repetitive element subfamilies are labelled according to Repeatmasker nomenclature, including ‘?’ notation for presumptive subfamily. Noocyte = 12, NE1.5 = 14, NE2.5 = 42, NE3.5 = 124, NE4.5 = 110, NE5.5 = 280, NE6.5 = 402, NE7.5 EPI = 216, NE7.5 TE = 110. Error bars = 1.96*SE. Each point represents the mean of the replicates. Source data
Extended Data Fig. 4
Extended Data Fig. 4. Expression of methylation enzymes and non-CpG methylation levels.
A. Expression of methylation enzymes in EPI and TE using the multi-omics dataset. NE5.5 = 58, NE6.5 EPI = 19, NE6.5 TE = 19, NE7.5 EPI = 24, NE7.5 TE = 14. Error bars = 1.96*SE. Each point represents the mean of the replicates. b. Levels of non-CpG methylation (CHH and CHG sites) in opossum gametes and embryos. Source data
Extended Data Fig. 5
Extended Data Fig. 5. DNA methylation status of the opossum X chromosome cont.
a Allele-specific methylation distribution of the autosomes and X chromosome in adult mouse male and female brain and liver, represented as density plots showing the distribution of the data and the probability of a variable being a certain value. b. CGI methylation on the inactive and active X for data in a. c. Methylation distribution of the autosomes and X chromosome in adult opossum male and female liver. d. Allele-specific methylation analysis of the paternal and maternal alleles for data in c. e. Methylation at specific genomic features on the inactive and active X in adult opossum brain, liver and spleen. f. Gene body methylation on the inactive and active X for genes subject to or escaping XCI for female samples in e. g. Sexing of gamete and embryo samples via read mapping to the X and Y chromosome. Source data
Extended Data Fig. 6
Extended Data Fig. 6. Deletion of DNMT1 in opossum immortalised male fibroblasts.
a. Metaplot of 100,000 randomly selected 1000 nucleotide regions demonstrating global decrease in DNA methylation in DNMT1-deleted fibroblasts at day 4. b. Mosaic loss of DNA methylation at the RSX promoter post-DNMT1 deletion at day 4. c. Proportion of upregulated and downregulated genes by chromosome in DNMT1-deleted fibroblasts at day 8. d. Methylation and expression of repetitive elements following DNMT1-deletion. Above, metaplots showing decreased DNA methylation at L1, MIR and ERV1 repetitive elements 4 days after DNMT1-deletion. Below, line graphs showing transcriptional de-repression of L1, MIR, ERV1 and ERVK elements by day 8 after DNMT1-deletion. Ncontrol = 3, NDNMT1 KO = 3. Error bars = 1.96*SE. Each point represents the mean of the replicates. e. qPCR analysis of H19 in DNMT1 deletant fibroblasts. Ncontrol = 3, NDNMT1 KO = 3. Unpaired t-test. Error bars = SEM. Each point represents the mean of the replicate. Source data

References

    1. Oswald, J. et al. Active demethylation of the paternal genome in the mouse zygote. Curr. Biol.10, 475–478 (2000). - PubMed
    1. Mayer, W., Niveleau, A., Walter, J., Fundele, R. & Haaf, T. Demethylation of the zygotic paternal genome. Nature403, 501–502 (2000). - PubMed
    1. Smith, Z. D. et al. A unique regulatory phase of DNA methylation in the early mammalian embryo. Nature484, 339–344 (2012). - PMC - PubMed
    1. Smith, Z. D. et al. DNA methylation dynamics of the human preimplantation embryo. Nature511, 611–615 (2014). - PMC - PubMed
    1. Guo, H. et al. The DNA methylation landscape of human early embryos. Nature511, 606–610 (2014). - PubMed

MeSH terms

LinkOut - more resources