. 2025 May 14;15(1):16801.
doi: 10.1038/s41598-025-01759-9.

Prediction model of mitochondrial energy metabolism related genes in idiopathic pulmonary fibrosis and its correlation with immune microenvironment

Affiliations

Prediction model of mitochondrial energy metabolism related genes in idiopathic pulmonary fibrosis and its correlation with immune microenvironment

Linlin Yao et al. Sci Rep. .

Abstract

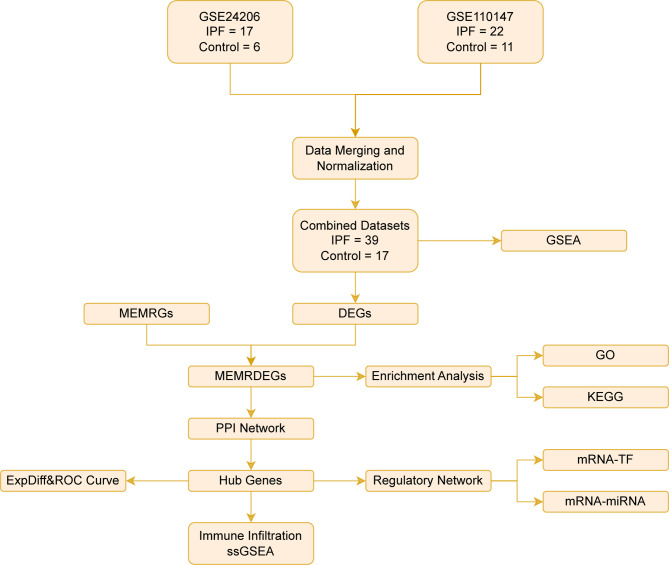
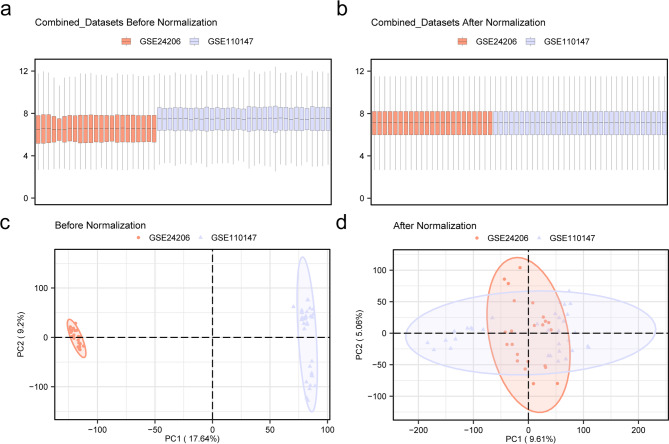
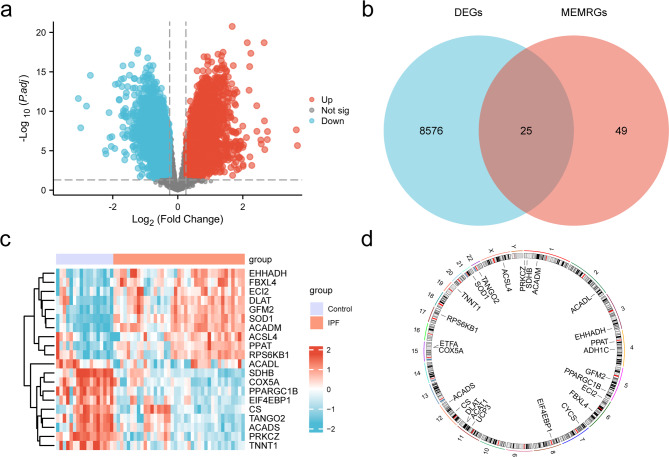
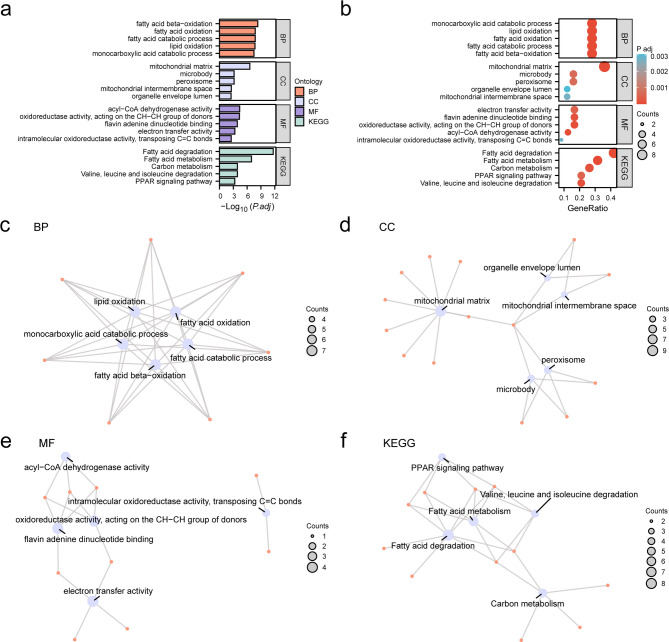
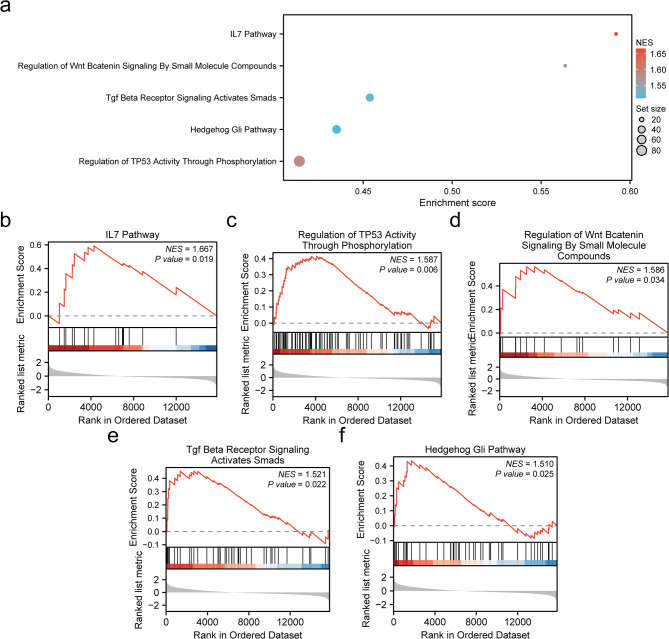
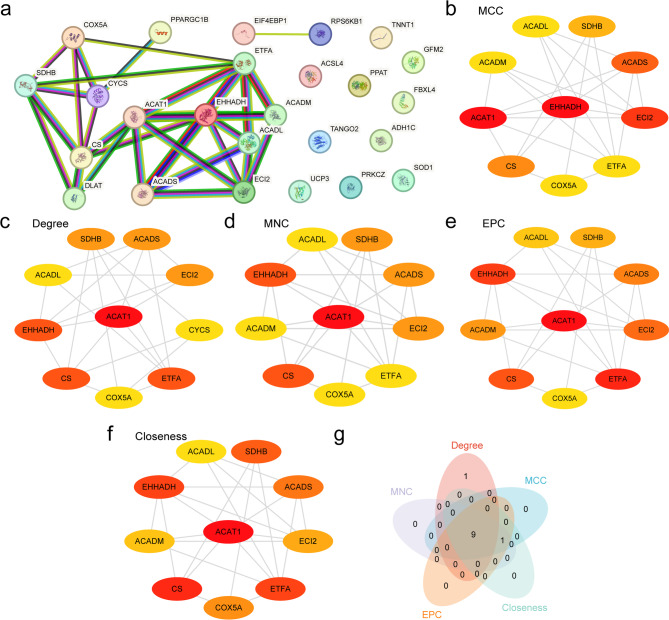
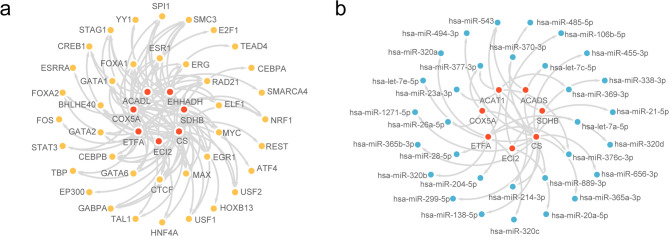
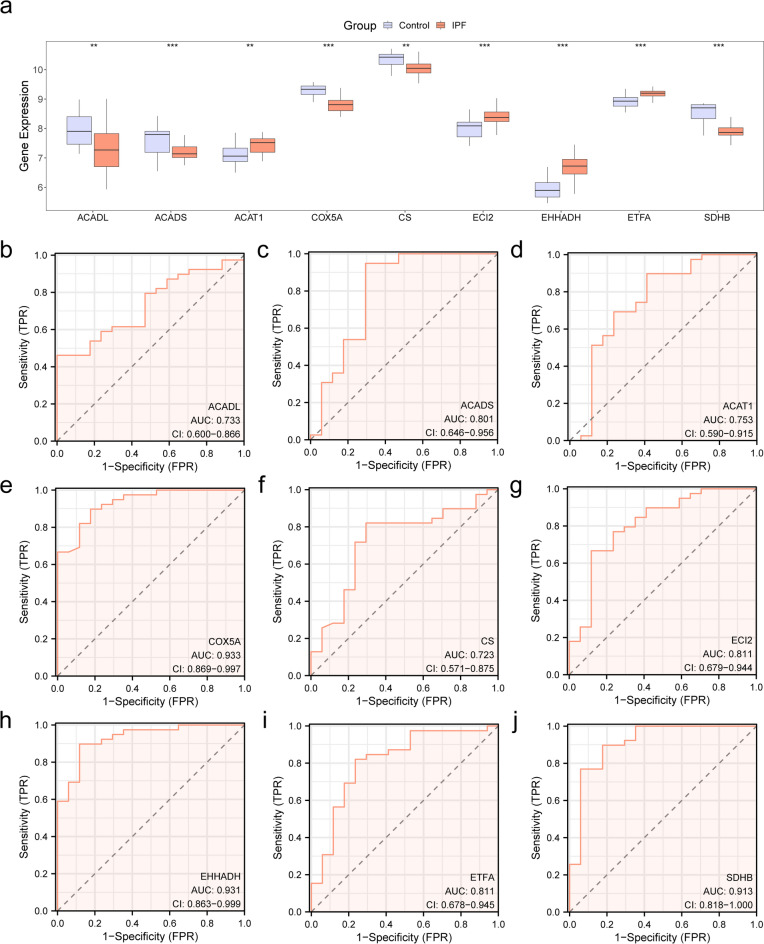
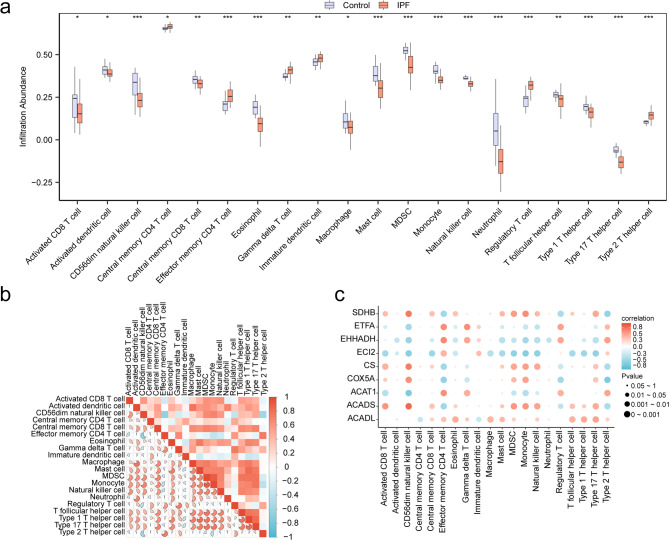
Idiopathic pulmonary fibrosis (IPF) is a progressive lung disease. Recent evidence suggests that the pathogenesis of IPF may involve abnormalities in mitochondrial energy metabolism. This study aimed to identify mitochondrial energy metabolism related differentially expressed genes (MEMRDEGs) and to elucidate their potential mechanistic involvement in IPF. We employed a multistep bioinformatics approach, including data extraction from the Gene Expression Omnibus database, removal of batch effects, and normalization and differential gene expression analyses. We then conducted Gene Ontology, Kyoto Encyclopedia of Genes and Genomes enrichment, and gene set enrichment analyses. A protein-protein interaction network was constructed from the STRING database, and hub genes were identified. Receiver operating characteristic curve analysis was performed to evaluate immune infiltration. Our integrated analysis of IPF datasets identified 25 MEMRDEGs. Nine hub genes emerged as central to mitochondrial energy metabolism in IPF. COX5A, EHHADH, and SDHB are potential biomarkers for diagnosing IPF with high accuracy. Single-sample gene set enrichment analysis revealed significant differences in the abundances of specertainfic immune cell types between IPF samples and controls. In conclusion, COX5A, EHHADH, and SDHB are potential biomarkers for the high-accuracy diagnosis of IPF. These findings pave the way for further investigations into the molecular mechanisms underlying IPF.

Keywords: Bioinformatics analysis; Genes; Idiopathic pulmonary fibrosis; Immune microenvironment; Mitochondrial energy metabolism.


Conflict of interest statement

Declarations. Competing interests: The authors declare no competing interests.

Figures

Fig. 1
Fig. 1
Flowchart for the comprehensive analysis of MEMRDEGs. IPF idiopathic pulmonary fibrosis, GSEA gene set enrichment analysis, DEGs differentially expressed genes, MEMRGs mitochondrial energy metabolism related genes, GO gene ontology, KEGG kyoto encyclopedia of genes and genomes, MEMRDEGs mitochondrial energy metabolism related differentially expressed genes, PPI protein-protein interaction, ROC receiver operating characteristic, TF transcription factor, ssGSEA single-sample gene set enrichment analysis.
Fig. 2
Fig. 2
Batch effects removal of GSE24206 and GSE110147. (a) Box plots of GEO combined with the dataset distribution before removing batch effects. (b) Postbatch integrated GEO dataset distribution boxplots. (c) 2D PCA plot of integrated GEO datasets before being debatched. (d) 2D PCA plot of the integrated GEO datasets after debatching. IPF datasets GSE24206 and GSE110147 are shown in orange and blue, respectively. GEO gene expression omnibus, PCA principal component analysis, IPF idiopathic pulmonary fibrosis.
Fig. 3
Fig. 3
Differential gene expression analysis.(a) Volcano plot of differentially expressed genes analysis in IPF and control samples in the combined GEO datasets. (b) DEG and MEMRG Venn diagrams of the integrated GEO datasets. (c) Heatmap of the top 10 positive and negative logFC MEMRDEGs in the integrated GEO datasets. (d) Chromosomal mapping of MEMRDEGs. In the heatmap group, orange represents the IPF sample, and blue represents the control sample. In the heatmap, red represents high expression, and blue represents low expression. IPF idiopathic pulmonary fibrosis, DEGs differentially expressed genes, MEMRGs mitochondrial energy metabolism related genes, MEMRDEGs mitochondrial energy metabolism related differentially expressed genes.
Fig. 4
Fig. 4
GO and KEGG enrichment analysis for MEMRDEGs. (a, b). GO and KEGG enrichment analysis results for MEMRDEGs. The bar graph (a) and bubble plot (b) show BP, CC, MF, and KEGG. GO and KEGG terms are shown on the ordinate. (cf). GO and KEGG enrichment analysis results for MEMRDEGs: BP (c), CC (d), MF (e), and KEGG (f). Blue nodes represent items, orange nodes represent molecules, and lines represent the relationships between items and molecules. The screening criteria for GO and KEGG enrichment analyses were adjusted to p < 0.05, FDR value (q value) < 0.25, and BH as the p-value correction method. The use of KEGG software has been licensed by the Kanehisa laboratory.MEMRDEGs mitochondrial energy metabolism related differentially expressed genes, GO gene ontology, KEGG kyoto encyclopedia of genes and genomes, BP biological process, CC cellular component, MF molecular function.
Fig. 5
Fig. 5
GSEA for combined datasets. (a). GSEA biological function bubble plot of integrated GEO datasets. (bf). GSEA showed that all genes were significantly enriched in the IL7 pathway (b), Regulation of TP53 activity through phosphorylation (c), regulation of Wnt beta-catenin signaling by small molecule compounds (d), Tgf Beta receptor signaling molecules (e), and the Hedgehog Gli pathway (f). The bubble size represents the number of enriched genes, and the color of the bubble represents the size of the NES value. The redder the color, the higher the value, while the bluer the color indicates a lower value. The screening criterion for GSEA was set at p < 0.05. GSEA gene set enrichment analysis.
Fig. 6
Fig. 6
PPI network and hub gene analysis. a. PPI network of MEMRDEGs calculated from the STRING database. (bf). The PPI network of the top 10 MEMRDEGs calculated by five algorithms of the CytoHubba plug-in, including MCC (b), Degree (c), MNC(d), EPC (e), and closeness (f). g. Venn diagram of the top 10 MEMRDEGs for the five algorithms of the CytoHubba plug-in. PPI network protein-protein interaction network, MEMRDEGs mitochondrial energy metabolism related differentially expressed genes, MCC maximal clique centrality, MNC maximum neighborhood component, EPC edge-percolated component.
Fig. 7
Fig. 7
Regulatory network of hub genes. (a) The mRNA-TF regulatory network of hub genes. (b) mRNA-miRNA regulatory network of hub genes. TF transcription factor. mRNAs are shown in red, TFs in yellow, and miRNAs in blue.
Fig. 8
Fig. 8
Differential expression validation and ROC curve analysis.(a). Group comparison plots of hub genes in IPF and control samples from combined GEO datasets. In the group comparison plots, the IPF samples are orange, and the control samples are blue. (bj). ROC curves of hub genes in the integrated GEO datasets .The x-axis represents the specificity of gene diagnosis, and the y-axis represents the sensitivity of diagnosis, with larger values indicating greater specificity or sensitivity. AUC > 0.9 indicates high accuracy, and AUC between 0.7 and 0.9 indicates moderate accuracy. p < 0.01, highly statistically significant; p < 0.001, very highly statistically significant. IPF idiopathic pulmonary fibrosis, ROC receiver operating characteristic, AUC area under the curve, TPR true positive rate, FPR false positive rate.
Fig. 9
Fig. 9
Immune infiltration analysis using the SsGSEA algorithm.(a) Group comparison plot of immune cells in IPF and control samples from combined GEO datasets. (b) Heat map of immune cell infiltration abundance in the integrated GEO datasets. (c) Bubble plot of the correlation between hub genes and immune cell infiltration abundance in the integrated GEO datasets. ssGSEA, single-sample gene set enrichment analysis. * represents p < 0.05, indicating statistical significance; ** represents p < 0.01, indicating high statistical significance; *** represents p < 0.001, indicating very high statistical significance. In the group comparison plots, the IPF samples are depicted in orange, and the control samples are depicted in blue. The absolute value of the correlation coefficient (r-value) below 0.3 indicates weak or no correlation, 0.3 to 0.5 indicates a weak correlation, 0.5 to 0.8 indicates a moderate correlation, and above 0.8 indicates a strong correlation. In the correlation heatmap, red and blue represent positive and negative correlations, respectively. The depth of the color indicates the strength of the correlation.

Similar articles

References

    1. Richeldi, L., Collard, H. R. & Jones, M. G. Idiopathic pulmonary fibrosis. Lancet389, 1941–1952 (2017). - PubMed
    1. King, T. E. Jr et al. A phase 3 trial of Pirfenidone in patients with idiopathic pulmonary fibrosis. N Engl. J. Med.370, 2083–2092 (2014). - PubMed
    1. Le Pavec, J. et al. Lung transplantation for idiopathic pulmonary fibrosis. Presse Med.49, 104026. 10.1016/j.lpm.2020.104026 (2020). - PubMed
    1. Liu, J. et al. Mitochondrial quality control in lung diseases: current research and future directions. Front. Physiol.14, 1236651. 10.3389/fphys.2023.1236651 (2023). - PMC - PubMed
    1. Piao, L., Marsboom, G. & Archer, S. L. Mitochondrial metabolic adaptation in right ventricular hypertrophy and failure. J. Mol. Med.88, 1011–1020. 10.1007/s00109-010-0679-1 (2010). - PMC - PubMed

MeSH terms

LinkOut - more resources