. 2025 May;6(5):820-837.
doi: 10.1038/s43018-025-00955-w. Epub 2025 May 14.

Evolutionary and immune microenvironment dynamics during neoadjuvant treatment of esophageal adenocarcinoma

Affiliations

Evolutionary and immune microenvironment dynamics during neoadjuvant treatment of esophageal adenocarcinoma

Melissa Barroux et al. Nat Cancer. 2025 May.

Abstract

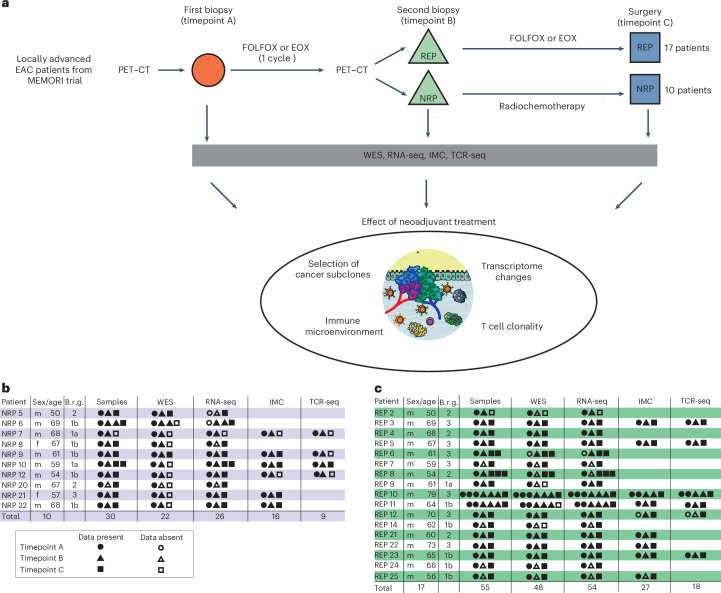
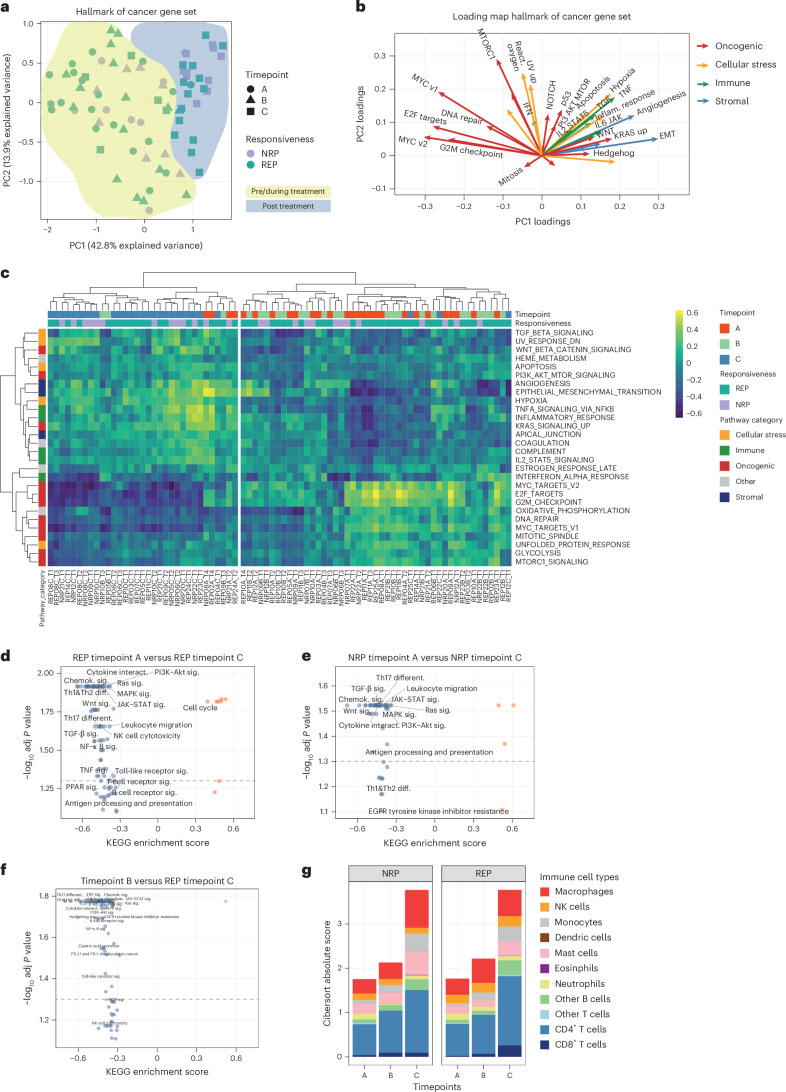
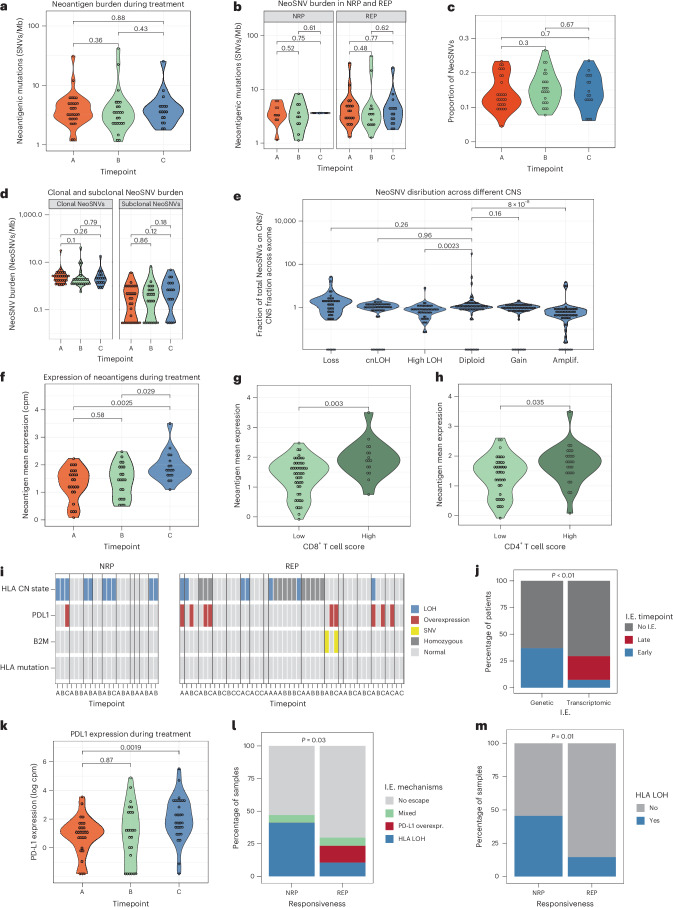
Locally advanced esophageal adenocarcinoma remains difficult to treat and the ecological and evolutionary dynamics responsible for resistance and recurrence are incompletely understood. Here, we performed longitudinal multiomic analysis of patients with esophageal adenocarcinoma in the MEMORI trial. Multi-region multi-timepoint whole-exome and paired transcriptome sequencing was performed on 27 patients before, during and after neoadjuvant treatment. We found major transcriptomic changes during treatment with upregulation of immune, stromal and oncogenic pathways. Genetic data revealed that clonal sweeps through treatment were rare. Imaging mass cytometry and T cell receptor sequencing revealed remodeling of the tumor microenvironment during treatment. The presence of genetic immune escape, a less-cytotoxic T cell phenotype and a lack of clonal T cell expansions were linked to poor treatment response. In summary, there were widespread transcriptional and environmental changes through treatment, with limited clonal replacement, suggestive of phenotypic plasticity.


Conflict of interest statement

Competing interests: J.T.S. receives honoraria as a consultant or for continuing medical education presentations from AstraZeneca, Bayer, Boehringer Ingelheim, Bristol Myers Squibb, Immunocore, iOMEDICO, MSD, Novartis, Roche/Genentech and Servier. His institution receives research funding from Abalos Therapeutics, Boehringer Ingelheim, Bristol Myers Squibb, Celgene, Eisbach Bio and Roche/Genentech; he holds ownership in FAPI Holding. K. Steiger is named on a patent on a radiopharmaceutical compound and serves as advisory board member for TRIMT GmbH; not related to the current work. M.Q. receives honoraria as consultant or for continuing medical education presentations from AstraZeneca, Bayer, Bristol-Myers Squibb, MSD Sharp Dohme, Novartis, Roche and Servier. T.A.G., B.C. and A.M.B. are named as co-inventors on patent applications that describe a method for TCR sequencing (GB2305655.9) and T.A.G. is named on a patent application for a method to measure evolutionary dynamics in cancers using DNA methylation (GB2317139.0). T.A.G. has received an honorarium from Genentech and consultancy fees from DAiNA Therapeutics. The remaining authors declare no competing interests.

Figures

Fig. 1
Fig. 1. Experimental workflow and overview of the study cohort.
a, Flowchart summarizing patient treatment and study design, including respective neoadjuvant treatment, sample acquisition and analyses. FOLFOX, oxaliplatin and 5-FU; EOX, epirubicin, oxaliplatin and capecitabine; WES, whole-exome sequencing; RNA-seq, RNA-sequencing; IMC, imaging mass cytometry; TCR-seq, T cell receptor sequencing. b,c, Overview of the study cohort of NRPs (b) and REPs (c) with indication of samples present for each type of data analysis. Samples from different timepoints are indicated with different shapes. Age, age at diagnosis; Brg, Becker remission grade.
Fig. 2
Fig. 2. Evolutionary dynamics of mutations during neoadjuvant treatment in EAC.
ac, Violin plots showing the distribution of mutational burden during neoadjuvant treatment for all patients (a), stratified by treatment response (b) and stratified by clonality of mutation (c). Mutations of each sample were classified as clonal or subclonal based on the copy number and cellularity adjusted cancer cell fraction. P values in ac were calculated by the two-sided Wilcoxon test. d, Selected phylogenetic trees with clade length indicating the number of shared mutations between samples. Timepoint of samples are annotated at the tip of the clades with the letters A–C. Numbers at the nodes indicate bootstrap values. EAC drivers harboring SNVs (without brackets) or indels (in squared brackets) and number of neoantigenic SNVs are annotated on the clades of the trees. HI, homoplasy index; NeoSNVs, neoantigenic SNV. e, Proportion of SNV types in treatment-naive SNVs (left), SNVs occurring under chemotherapy (middle) and SNVs occurring under RCTx (right) from phylogenetic tree analyses. A, adenine; T, thymine; C, cytosine; G, guanine. n = 5,341 CTx-induced SNVs, n = 283 RCTx induced SNVs, n = 9,787 treatment-naive SNVs. f, Proportion of COSMIC signatures in NRPs and REPs during treatment (COSMIC signature calling was limited to those with a weight >5% in the respective groups). Samples from NRP: n = 10 at timepoint A, n = 10 at timepoint B, n = 2 at timepoint C; samples from REP: n = 19 at timepoint A, n = 14 at timepoint B, n = 15 at timepoint C. g, Line graph showing changes in the proportion of COSMIC signature 4 in responders during treatment. For multi-region samples means were plotted for each timepoint. Source data
Fig. 3
Fig. 3. Dynamics in copy number alterations during neoadjuvant treatment.
a, Plot showing genome-wide copy number state. Each row represents a sample, with samples from the same patient grouped together and patient ID is annotated on the left. Treatment response and timepoint of each sample are annotated on the right. Dashed vertical lines indicate the centromere of each chromosome and continuous vertical lines are separating different chromosomes. CNS, copy number state; CNt, copy number. b, Percentage of altered exome in REPs and NRPs during neoadjuvant treatment. CNS: copy number state. Samples from NRPs n = 10 at timepoint A, n = 10 at timepoint B, n = 2 at timepoint C; Samples from REPs: n = 19 at timepoint A, n = 14 at timepoint B, n = 15 at timepoint C. c, Fragment size of clonal, subclonal and private CNAs. Box plots show the median, two hinges representing the first and third quartiles and two whiskers showing the minimum and maximum. In patients with only two samples available, no distinction between subclonal and private could be made and therefore CNAs were summarized in ‘subclonal/private’ category. Number of clonal fragments: n = 281 in REPs, n = 180 in NRPs. Number of subclonal fragments: n = 315 in NRPs, n = 1,492 in REPs; number of subclonal/private fragments n = 460 in NRPs, n = 307 in REPs; number of private fragments n = 202 in NRPs, n = 995 in REPs. P values are calculated by the two-sided Wilcoxon test. Subcl./priv., subclonal/private. d, Fraction of exome with changing copy number state between timepoint A and B in NRPs and REPs. P values are calculated by a two-sided Wilcoxon test. TP, timepoint. e, Plot shows genetic alterations, including CNAs, SNVs and indels for putative cancer driver genes identified by IntOGen. Each vertical column represents a sample. Samples of the same patients are grouped together and patient ID is annotated at the top. Information on timepoint, cancer cellularity and the patient’s pathological regression grade treatment are found in the top three rows. The following rows show information on genetic alterations in EAC driver genes. Cellularity was defined as low (10–30%), medium (31–60%) or high (61–100%). Regression grades were evaluated by a pathologist according to Becker regression classification. Source data
Fig. 4
Fig. 4. Neoadjuvant treatment leads to profound changes in gene and pathway expression in EAC.
a, PCA of single sample gene set enrichment analysis of cancer hallmark gene sets. Background shading represents a visual highlight. PC, principal component. b, Principal-component feature loadings (magnitude and direction) from PCA in a. Vectors are colored according to their biological classification of cancer hallmark gene sets. c, Hierarchical clustering with heatmap showing the significantly differentially expressed pathways between the two clusters (right cluster is predominantly samples from timepoint A/B and left cluster is predominantly timepoint C). Sample IDs and timepoints are annotated at the bottom of the heatmap. d, Enrichment analyses in KEGG pathways in REPs between timepoint A and C. Samples from REPs: n = 19 at timepoint A and n = 19 at timepoint C. e, Enrichment analyses in KEGG pathways in NRPs between timepoint A and C. Samples from NRPs: n = 8 at timepoint A and n = 10 at timepoint C. f, Enrichment analyses in KEGG pathways during chemotherapy (all samples at timepoint B versus REPs at timepoint C). Samples at timepoint B: n = 24 and REPs at timepoint C: n = 19. Dotted lines in df indicate significance level of Padj < 0.05 (false discovery rate (FDR)-adjusted P values). g, Plot shows immune cell composition based on CIBERSORT analysis in REPs and NRPs during neoadjuvant treatment. Samples from NRPs: n = 8 at timepoint A, n = 8 at timepoint B, n = 10 at timepoint C; Samples from REPs: n = 19 at timepoint A, n = 16 at timepoint B, n = 19 at timepoint C. sig., significant; diff., differentiation. Source data
Fig. 5
Fig. 5. Increasing immune escape during neoadjuvant treatment correlates with poor treatment response.
ad, Violins showing the neoantigenic mutational burden during neoadjuvant treatment in all samples (a), stratified by treatment response (b), expressed as a proportion of total SNVs (c) and stratified by clonality (d). Clonal and subclonal neoantigenic mutational burden during neoadjuvant treatment. Mutations of each sample were classified as clonal or subclonal based on the copy number (CN) and cellularity-adjusted CCF. e, Distribution of neoantigenic SNVs based on their copy number states. The CN-normalized proportion of neoantigenic SNVs in each CN segment was calculated. f, Expression of neoantigens during treatment. g,h, Neoantigen expression in EAC according to immune infiltration score for CD8+ T cells (g) and CD4+ T cells (h). i, Presence of HLA-LOH, PD-L1 overexpression and B2M mutations in individual samples from NRPs (left) and REPs (right). Samples from individual patients are separated by vertical black lines. PD-L1 overexpression was defined as PD-L1 expression >2 s.d. from the mean of all treatment-naive samples. j, Proportion of early and late occurrence of genetic and nongenetic immune escape in cohort of n = 27 patients. Genetic immune escape refers to mutations or LOH in HLA or B2M mutations, whereas PD-L1 overexpression represents transcriptomic immune escape. P value calculated by the two-sided chi-squared test (P = 0.003). k, PD-L1 expression during neoadjuvant treatment. l, Proportion of immune escaped samples and their escape mechanism stratified by treatment response in NRPs (n = 17 samples) and REPs (n = 47 samples) with matching WES and RNA-seq data. m, Proportion of samples with HLA-LOH stratified by treatment response in NRPs (n = 22 samples) and REPs (n = 48 samples). P values in jm are calculated by the two-sided chi-squared test. P values in all other panels are calculated by a two-sided Wilcoxon test, unless stated otherwise. Amplif., amplification; I.E., immune escape; overexpr., overexpression. Source data
Fig. 6
Fig. 6. Highly multiplexed imaging mass cytometry analysis reveals different T cell phenotype dynamics in NRPs and REPs during treatment.
a, Representative image IMC staining of EAC tissue. Scale bar, 100 μm. p53 (yellow), CD4 (red), CD8a (green) and DNA (blue) from IMC data channels are displayed. Representative IMC images were taken from a minimum of 15 ROIs across different samples. b, Representative IMC images of each marker together with DNA (blue). Representative IMC images for each marker were taken from a minimum of 15 ROIs across different samples. c, t-SNE visualization of the EAC tumor, stromal and immune map based on 28 identified cell clusters. d, Heatmap visualization of marker expression in the 28 cell clusters. Normalized median marker expression is shown. TCs, tumor cells; SMCs, smooth muscle cells; ICs, immune cells; act, activated; d.p., in direct proximity to each other; GzmB, Granzyme B. e, Cell cluster dynamics during treatment are shown for NRPs and REPs. Box plots show the median, two hinges representing the first and third quartiles and two whiskers showing the minimum and maximum. ROIs from NRPs (n = 8 at timepoint A, n = 10 at timepoint B, n = 6 at timepoint C). ROIs from REPs (n = 12 at timepoint A, n = 13 at timepoint B, n = 16 at timepoint C). P values were calculated by a two-sided analysis of variance test. Exact P values: P(C1,NRP) = 0.0007, P(C2,NRP) < 0.0001; P(C4,NRP) = 0.0008; P(C5,NRP) < 0.0001; P(C6, NRP) = 0.0003; P(C23,NRP) < 0.0001; P(C26,NRP) = 0.02; P(C1,REP) = 0.02; P(C4, REP) < 0.0001; P(C5,REP) = 0.03; P(C6,REP) = 0.002; P(C12,REP) = 0.0005; P(C16, REP) = 0.007; P(C17,REP) = 0.04; P(C7,NRP) = 0.035; P(C14, NRP) = 0.03; P(C19, NRP) = 0.005; P(C19,REP) = 0.003. Unreported P values did not reach the significance level. f, t-SNE visualization of CD45+ cell map based on 24 identified cell clusters. g, Heatmap visualization of marker expression in the 24 CD45+ cell clusters. Normalized median marker expression is shown. h, Absolute CD4+ and CD8+ cell counts per mm2 during treatment. i, T cell phenotypes in patients with EAC during treatment were analyzed for markers of T cell activation and exhaustion. Fractions of CD8+ cells (top row) and CD4+ cells (bottom row) were compared among patient groups and visualized by violin plots. j, Ratio of activated and exhausted CD8+ cells (top row) and CD4+ cells (bottom row) is shown during treatment for REPs and NRPs. P values in all other panels are calculated by the two-sided Wilcoxon test, unless stated otherwise. Source data
Fig. 7
Fig. 7. T cells show clonal expansion in patients with neoadjuvant treatment response.
a, Numbers of total TCRs α-chain (left) and β-chain (right) in REPs and NRPs during treatment. P values are calculated by a two-sided Wilcoxon test. b, Correlation between TCR counts α-chain (left) and β-chain (right) and quantitative deconvolution of T cells from RNA-seq data via CIBERSORT. Two-tailed Pearson’s correlation coefficients are reported in the plots. c, Abundance distribution profile of TCRs at timepoints A–C. The y axis shows the proportion of the TCRs that are found at the abundance indicated by the x axis. d, Fishplots show the number of fourfold-expanded TCRs between any two timepoints REP11 (top) and REP23 (bottom). The colors correspond to the combination of timepoints that the TCR expansion occur in. e, The proportions of T cell clones that are expanded ≥fourfold and ≥eightfold between timepoint A and C. f, Numbers of TCRs expanded ≥fourfold and ≥eightfold during treatment periods (A–B, A–C and B–C), stratified by pathological regression grades. P values are calculated by a two-sided Mann–Whitney U-test. Source data
Extended Data Fig. 1
Extended Data Fig. 1. Clinical data.
(a) Principle component analysis of single sample gene set enrichment analysis of cancer hallmark gene sets with color coding of FDG uptake at screening PET–CT. Q1-Q4: lowest to highest quantile of FDG uptake. (b) Proportion of patients with respective Becker regression grades in NRPs (n = 10) and REPs (n = 17) in the cohort for molecular genetic analyses. (c) Overall survival of NRPs (n = 22) and REPs (n = 45) in the clinical MEMORI cohort. (d) Overall survival of patients with different histopathologic regression grades according to Becker in the clinical MEMORI cohort. (Becker°I: n = 26; Becker°II: n = 24; Becker°II: n = 17). Source data
Extended Data Fig. 2
Extended Data Fig. 2. Genetic dynamics in EAC.
(a) Tumor cellularity of samples from different timepoints. Tumor cellularity was estimated from whole-exome sequencing data using Sequenza. (b) Violin plots showing the distribution of mutational burden stratified by treatment type (c). Mutations of each sample were classified as clonal or subclonal based on the copy number and cellularity adjusted cancer cell fraction. P values in panels A-C are calculated by the two-sided Wilcoxon test. (d) Selected phylogenetic trees with clade length indicating the number of shared mutations between samples from the same patient. Timepoint of samples are annotated at the tip of the clades with the letters A-C. Numbers at the nodes indicate bootstrap values. EAC drivers harboring mutations (without brackets) or indels (in squared brackets) and number of neoantigenic SNVs are annotated on the clades of the trees. REP: Responder, NRP: NonResponder, HI: homoplasy index, NeoSNVs: Neoantigenic single-nuceleotide variant. (e) Plot shows COSMIC signature weights of individual samples from NRP (left) and REP (right). Source data
Extended Data Fig. 3
Extended Data Fig. 3. Genetic alterations in 108 EAC driver genes in NonResponder and Responder.
Plot shows genetic alterations, including copy number alterations, SNVs and indels for 108 putative cancer driver genes identified by IntOGen© in NonResponder patients (a) and Responder patients (b). Each vertical column represents a sample. Samples from the same patients are grouped together and patient ID is annotated at the top. Information on timepoint, cancer cellularity and the patient’s pathological regression grade treatment are found in the top three rows. The following rows show information on genetic alterations in EAC driver genes. Cellularity was defined as low (10–40%), medium (41–60%), or high (61–100%). Regression grades were evaluated by a pathologist according to Becker regression classification. CNS: copy number state, CNt: copy numbers, SNV: single-nucleotide variant. REP: Responder, NRP: NonResponder. Source data
Extended Data Fig. 4
Extended Data Fig. 4. Genetic dynamics and expression of EAC driver genes during treatment.
Number of altered (CNA, SNV or indel) genes from 108 EAC drivers in (a) the overall cohort, (b) NRPs (left) and REPs (right). Number of driver genes with CNAs (c) in the overall cohort, (d) in NRPs (left) and REPs (right). Number of driver genes with SNVs or indels (e) in the overall cohort, (f) in NRPs (left) and REPs (right). (g) Violin plots show expression of 16 high-frequency EAC driver genes during neoadjuvant treatment. P values in all panels are calculated by the two-sided Wilcoxon test. cpm: counts per million. Source data
Extended Data Fig. 5
Extended Data Fig. 5. Correlations between copy number state/ mutational status and gene expression in high-frequency EAC driver genes.
(a) Plot shows correlations between copy number states and tumor cellularity adjusted RNA expression in 15 high-frequency EAC driver genes. RNA expression was adjusted for tumor cellularity estimated by GI pathologist. Correlations were calculated using two-tailed Pearson correlation. CNS: copy number state. (b) Violin plots showing cellularity adjusted RNA expressions of CDKN2A/ TP53 in CDKN2A/ TP53 mutated and non-mutated samples. P values are calculated by the two-sided Wilcoxon test. (c) Principle component analysis of single sample gene set enrichment analysis of cancer hallmark gene sets. Patients with multi-region samples are highlighted with different colors. PC: Principle component (d) Enrichment analyses in KEGG pathways during chemotherapy (all samples at Timepoint A (n = 27) versus REPs at Timepoint C (n = 19)). Dotted line indicates significance level of padj < 0.05 (FDR-adjusted P values). Source data
Extended Data Fig. 6
Extended Data Fig. 6. Immune cell dynamics in EAC during treatment.
(a) Plots show normalized odds ratios for different immune cell types deconvoluted from RNA expression data using Syllogist. (b) Plot shows immune cell scores for different immune cell types deconvoluted from RNA expression data using ConsensusTME. Samples from NRP: n = 8 at timepoint A, n = 8 at timepoint B, n = 10 at timepoint C; Samples from REP: n = 19 at timepoint A, n = 16 at timepoint B, n = 19 at timepoint C. Violins showing the (c) neoantigenic mutational burden stratified by treatment regime and (d) the subclonal neoantigenic SNVs in NRPs (left) and REPs (right). (e) Plot shows immune cell proportion based on CIBERSORT analysis in REP and NRP during neoadjuvant treatment. Samples from NRP: n = 8 at timepoint A, n = 8 at timepoint B, n = 10 at timepoint C; Samples from REP: n = 19 at timepoint A, n = 16 at timepoint B, n = 19 at timepoint C. (f) Plots show CIBERSORT scores for M2-macrophages (p-Val at Timepoint C = 0.0001) and (g) regulatory T cells during treatment deconvoluted from RNA expression. (hj) Enrichment scores for Hallmark of cancer pathways related to immune suppression in NRPs (left) and REPs (right) during treatment. (k) Exemplary visualization of indicated marker expression and DNA (blue) from IMC data. Scale bar: 5μm (l) Dynamics of immune clusters (ICs) with CD8 cells, (m) ICs with other T cells and (n) myeloid cells during treatment are shown by box plots. Box plots show the median, two hinges representing the first and third quartiles and two whiskers showing the minimum and maximum. P values in panels ln are calculated by the two-sided Kruskal-Wallis test. ROIs from NRPs (n = 8 at timepoint A, n = 10 at timepoint B, n = 6 at timepoint C). ROIs from REPs (n = 12 at timepoint A, n = 13 at timepoint B, n = 16 at timepoint C). P values in all other panels are calculated by the two-sided Wilcoxon test, unless stated otherwise. Source data
Extended Data Fig. 7
Extended Data Fig. 7. CD4 and CD8 cell dynamics.
Fractions of TIM-3-expressing CD4 cells (a) and CD8 cells (b) in NRPs and REPs during treatment. P values in panels are calculated by the two-sided Wilcoxon test. (c) Plot shows heterogeneity of CD4 and CD8 cell counts from IMC analyses in samples where multiple region of interests (ROIs) were analyzed. Dots represent CD4 (blue) or CD8 cell count (red) in individual ROIs. (d, e) Heterogeneity of ratio between activated and exhausted CD8 cells (d) and CD4 cells (e) in samples with multi-region ROIs. Ratio of activated and exhausted CD8 cells (f) and CD4 cells (g) during treatment including both single and multi-region IMC datasets. Ratio of activated and exhausted CD8 cells (h) and CD4 cells (i) stratified by treatment type. Proportion of high and low CD8 (j) and CD4 (k) activation status in immune escaped via HLA-LOH (n = 10) and non-escaped (n = 23) samples with matching IMC data. P value is calculated by the two-sided chi-square test. (l) Fishplots show the number of 4-fold expanded TCRs between any two timepoints for NRP10 (left panels) and REP05 (right panels). The colors correspond to the combination of timepoints the TCR expansion occur in. P values in all panels are calculated by the two-sided Wilcoxon test, unless stated otherwise. Source data
Extended Data Fig. 8
Extended Data Fig. 8. Reanalyzes of immune related results excluding post-treatment samples from patients with complete remission.
(a) Hierarchical clustering with heatmap showing the significantly differentially expressed pathways between the two clusters (right cluster is predominantly samples from timepoint A/B and left cluster is predominantly timepoint C). Sample IDs and timepoints are annotated at the bottom of the heatmap. (b) Enrichment in KEGG pathways in Responders between Timepoint A and C (left) and in NonResponder between Timepoint A and C (right). Dotted lines indicate significance level of padj < 0.05. FDR-adjusted P values. Samples from NonResponder: n = 8 at timepoint A, n = 8 at timepoint B, n = 8 at timepoint C; Samples from Responder: n = 19 at timepoint A, n = 16 at timepoint B, n = 18 at timepoint C. (c) Plot shows immune cell composition based on CIBERSORT analysis in Responders and NonResponders during neoadjuvant treatment. Samples from NonResponder: n = 8 at timepoint A, n = 8 at timepoint B, n = 8 at timepoint C; Samples from Responder: n = 19 at timepoint A, n = 16 at timepoint B, n = 18 at timepoint C. (d) Absolute CD4 and CD8 cell counts per mm2 during treatment. (e) T cell phenotypes in EAC patients during treatment were analyzed for markers of T cell activation and exhaustion. Fractions of CD8 cells (top row) and CD4 cells (bottom row) were compared among patient groups and visualized by violin plots. (f) Ratio of activated and exhausted CD8 cells (left) and CD4 cells (right) during treatment including both single and multi-region IMC datasets. (g) Ratio of activated and exhausted CD8 cells (left) and CD4 cells (right) stratified by treatment type. P values in all panels are calculated by the two-sided Wilcoxon test, unless other stated. Source data
Extended Data Fig. 9
Extended Data Fig. 9. Unsupervised analyses in PAXgene fixed and formalin-fixed samples.
Principle component analysis of RNA-expression data (a) in samples of different sequencing batches and (b) samples with different fixation methods. F: formalin-fixed samples, P: PAXgene fixed samples. (c) Mean expression of included IMC markers in PAXgene fixed samples and formalin-fixed samples samples from Timepoint C. P values in panels are calculated by the two-sided Wilcoxon test. F: formalin-fixed samples, P: PAXgene fixed samples. (d) Principle component analysis of expression-based analysis of included IMC markers including ROIs from all samples. PC: principal component. (e) Principle component analysis of expression-based analysis of included IMC markers including ROIs from Timepoint C. PC: principal component. Three samples clustering slightly apart (circled in the PCA) were ROIs from the same patient (REP23). Source data
Extended Data Fig. 10
Extended Data Fig. 10. Exemplary staining of cells from ambiguous clusters.
Plot shows exemplary stainings of cells from clusters C1, C4, C6, C11, C14, C18, C23 and C24 (white arrow) with respective marker expression. After manual revision of those clusters, cell types could be attributed. IMC images for unclear clusters were taken from a minimum of 20 cells across different samples. Scale bars: 10 μm.

Update of

References

    1. Sung, H. et al. Global cancer statistics 2020: GLOBOCAN estimates of incidence and mortality worldwide for 36 cancers in 185 countries. CA Cancer J. Clin.10.3322/caac.21660 (2021). - PubMed
    1. Morgan, E. et al. International trends in oesophageal cancer survival by histological subtype between 1995 and 2014. Gut70, 234–242 (2021). - PubMed
    1. Davies, A. R. et al. Tumor stage after neoadjuvant chemotherapy determines survival after surgery for adenocarcinoma of the esophagus and esophagogastric junction. J. Clin. Oncol.32, 2983–2990 (2014). - PubMed
    1. Al-Batran, S. E. et al. Perioperative chemotherapy with fluorouracil plus leucovorin, oxaliplatin, and docetaxel versus fluorouracil or capecitabine plus cisplatin and epirubicin for locally advanced, resectable gastric or gastro-oesophageal junction adenocarcinoma (FLOT4): a randomised, phase 2/3 trial. Lancet393, 1948–1957 (2019). - PubMed
    1. Shah, M. A. et al. Efficacy and safety of pembrolizumab for heavily pretreated patients with advanced, metastatic adenocarcinoma or squamous cell carcinoma of the esophagus: the phase 2 KEYNOTE-180 study. JAMA Oncol. 5, 546–550 (2019). - PMC - PubMed

MeSH terms

Supplementary concepts

LinkOut - more resources