. 2025 Oct;21(10):1577-1588.
doi: 10.1038/s41589-025-01893-5. Epub 2025 May 14.

Small-molecule dissolution of stress granules by redox modulation benefits ALS models

Affiliations

Small-molecule dissolution of stress granules by redox modulation benefits ALS models

Hiroyuki Uechi et al. Nat Chem Biol. 2025 Oct.

Abstract

Neurodegenerative diseases, such as amyotrophic lateral sclerosis, are often associated with mutations in stress granule proteins. Aberrant stress granule condensate formation is associated with disease, making it a potential target for pharmacological intervention. Here, we identified lipoamide, a small molecule that specifically prevents cytoplasmic condensation of stress granule proteins. Thermal proteome profiling showed that lipoamide stabilizes intrinsically disordered domain-containing proteins, including SRSF1 and SFPQ, which are stress granule proteins necessary for lipoamide activity. SFPQ has redox-state-specific condensate dissolving behavior, which is modulated by the redox-active lipoamide dithiolane ring. In animals, lipoamide ameliorates aging-associated aggregation of a stress granule reporter protein, improves neuronal morphology and recovers motor defects caused by amyotrophic lateral sclerosis-associated FUS and TDP-43 mutants. Thus, lipoamide is a well-tolerated small-molecule modulator of stress granule condensation, and dissection of its molecular mechanism identified a cellular pathway for redox regulation of stress granule formation.


Conflict of interest statement

Competing interests: A.H. is the Scientific Founder of Dewpoint Therapeutics. A.H. and S.A. are Dewpoint Therapeutics shareholders. R.J.W. is a Scientific Advisor for Dewpoint Therapeutics. A.M.d.J.D. is an employee of Dewpoint Therapeutics, but his contribution to this work was before his employment. A.H., M.B. and R.J.W. filed a patent related to this work (US20200150107A1 and synchronized worldwide applications). Dewpoint Therapeutics contributed intellectually to this work in the SAR analysis of lipoamide analogs. All other experimental work either predates the foundation of Dewpoint Therapeutics or was performed independently. The other authors declare no competing interests.

Figures

Fig. 1
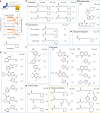
Fig. 1. Lipoamide reduces cytoplasmic condensation of stress granule proteins by partitioning into condensates.
a, Representative images of HeLa cells expressing GFP-tagged stress granule markers (G3BP1, PABPC1, TIAL1 or EWSR1) from three independent experiments. Cells were pretreated with 10 μM lipoamide or lipoic acid (with DMSO solvent control) for 1 h, followed by 1 mM arsenate for 1 h or DMSO without arsenate. b, Left, schema of lipoamide partitioning into FUS condensates in vitro. Right, mean ± s.e.m. of the concentration of racemic [15N]lipoamide in the condensate and the surrounding dilute phase of FUS–GFP in vitro, quantified using 15N(1H) NMR from four independent experiments. c, Chemical structure of the click-cross-link lipoamide analog, with the lipoamide backbone (orange) and the groups for UV cross-linking and click reaction (green). d, Representative images from three experiments using HeLa cells treated with 3 mM arsenate for 1 h, followed by 30 µM analog or control DMSO in the presence of arsenate for an additional 30 min before either irradiation with UV for cross-linking (+UV) or not (–UV), followed by fixation, immunostaining and click reaction with the fluorophore. Stress granules were labeled with G3BP1. Insets, stress granules in the boxed areas (analog and G3BP1 are boxed in green and magenta, respectively). e, Box plot of the partition coefficient of the analog into stress granules, mitochondria or nuclei relative to the cytoplasm (excluding stress granules and mitochondria) based on signal intensity of the fluorophore. Box plots show the median (bold bar), 25th and 75th percentiles and outliers (open dots), and whiskers extend to the most extreme values; n = 344 (–UV) and 345 (+UV) cells from three experiments. P values were determined by unpaired two-tailed t-test. f, Mean ± s.d. of signal intensity ratio (–UV against +UV) of the fluorophore in the indicated subcellular compartments from n = 3 experiment replicates. Source data
Fig. 2
Fig. 2. SAR shows that lipoamide activity is dependent on the dithiol but is nonenzymatic.
a, Top, schema of the chemical structure of lipoamide (racemic), highlighting its features. Bottom, lipoamide dose–response using HeLa and iPS cells, showing FUS–GFP condensate (stress granule) number (solid circles, left axis) and nuclear/cytoplasmic signal ratio (open circles, right axis) with 1 h pretreatment with lipoamide followed by 1 h of arsenate stress under continued lipoamide treatment. bj, Chemical structures and EC50 values of lipoamide and its derivatives using HeLa cells and the treatment scheme in a. EC50 values were calculated from dose–response curves (Methods), and each concentration of each compound was tested in duplicate wells (n = 1,750–2,650 cells per well) with two independent experiments. b, Enantiomers of lipoamide and lipoic acid. c, Comparison of mono- and dimethylated lipoamide. df, Additional carboxamide analogs of lipoamide. g, Modifications of the linker length between the carboxamide and the dithiolane ring of lipoamide. h, Substitution of the carboxamide of lipoamide. i, Carboxamide analogs of 6-amino-3-substituted-4-quinazolinones and five-membered aminoheterocyclic amides. j, Modifications of the dithiolane ring of lipoamide or similar compounds. Source data
Fig. 3
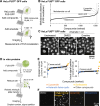
Fig. 3. Lipoamide interacts with disordered proteins in cells.
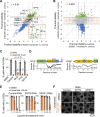
a, TPP scheme for testing the effect of lipoamide on protein thermal stability. Soluble protein quantity was measured by mass spectrometry, normalized to 0.1% DMSO-treated controls, of HeLa cells treated with 100 µM lipoamide and/or 1 mM arsenate at ten temperatures. Heating caused decreased detection through protein denaturation and precipitation, modulated by lipoamide. b, Volcano plot of thermal stabilization z scores (mean, n = 3 experiments) and FDRs following treatment with lipoamide and arsenate. Broken vertical and solid horizontal lines show the z score (±1.5) and FDR (<0.05) cutoffs, respectively, classifying stabilized (green) and destabilized (blue) proteins. The positions of DLD, SFPQ, SRSF1 and several stress granule proteins are indicated. c, Violin and box plots showing the proportions of IDRs in each protein, categorized into stabilized (z > 1.5, FDR < 0.05; 70 proteins), destabilized (z < 1.5, FDR < 0.05; 144 proteins) and unaffected (5,811 proteins). Box plots show the median (bold bar), 25th and 75th percentiles and outliers (closed dots), and whiskers extend to the most extreme values. P values were determined by a two-tailed Wilcoxon signed-rank test, followed by a Holm’s test. d, Mean ± s.d. enrichment (>0) or depletion (<0) of each amino acid in the IDRs of stabilized (green) and destabilized (blue) proteins compared to IDRs from all 6,025 detected proteins. P values were determined by unpaired t-test, followed by a Bonferroni test. e, Representative G3BP1 immunofluorescence images of HeLa cells (more then three independent experiments) depleted of SFPQ or SRSF1 and treated with 10 µM lipoamide or 0.1% DMSO for 1 h, followed by 1 mM arsenate for 1 h in the presence of lipoamide. f, Mean ± s.d. of the percentage of stressed HeLa cells with three or more G3BP1+ stress granules (SGs); n = 292–615 cells from three independent experiments. Dots indicate the mean values from each experiment. P values were determined by Tukey’s test. g, Representative immunofluorescence images of HeLa cells (more than three independent experiments) treated with 1 mM arsenate for 1 h. Broken lines indicate the edges of the cytoplasm and nucleus of one example cell. Source data
Fig. 4
Fig. 4. SFPQ redox state may mediate lipoamide activity.
a, Schema of the distributions of methionine (Met; 28 residues) and cysteine (Cys; 2) residues in human SFPQ; PLD, prion-like domain; RRM, RNA recognition motif; NOPS, NonA/paraspeckle domain; NLS, nuclear localization signal. b, Chemical structures of l-methionine and its nonnatural analog AHA. c, Left, representative images of HeLa cells subjected to the indicated RNAi knockdowns and cultured in complete medium (light gray) or methionine-free medium supplemented with 1 mM methionine (dark gray) or AHA (green) for 2 h, followed by 1 mM arsenate for 1 h (the experimental schematic is presented in Extended Data Fig. 7e). Stress granules were labeled with G3BP1. Right, mean ± s.d. of the percentage of stressed HeLa cells with three or more G3BP1+ SGs; n = 325–407 cells from three independent experiments. P values were calculated by a Tukey test without multiple-comparison correction. d, Schema of SFPQ as a redox sensor to modulate stress granule condensation. Source data
Fig. 5
Fig. 5. Lipoamide improves nuclear localization of FUS and TDP-43.
a, Representative images of iPS cell-derived MNs from three independent experiments treated with 0.1% DMSO or 10 µM lipoamide for 1 day, followed by 10 µM arsenite for 5 days in the presence or absence of lipoamide and labeled with TDP-43. The broken lines indicate the outlines of the nuclei. b, Mean ± s.e.m. of nuclear TDP-43 levels normalized to those of unstressed DMSO-treated MNs (control); n = 417–1,741 cells from three independent experiments. P values were determined by a Tukey test. c, Left, images showing recruitment of FUS–GFP to sites of UV laser-induced DNA damage (yellow arrow) in the nuclei (outlined with broken lines) of iPS cells at the indicated times after laser irradiation. Cells were analyzed after 1 h of treatment with lipoamide, followed by 1 h of arsenate stress. Right, mean ± s.d. of relative FUS–GFP signal intensity in response to DNA damage; n = 5 (DMSO) and 7 (lipoamide) cells. d, Left, images of nuclei (outlined with broken lines) of iPS cell-derived MNs expressing FUS-P525L–GFP from three independent experiments cultured for 21 days and then treated with 0.02% DMSO or 20 µM lipoamide for 24 h at the indicated times after laser irradiation. Yellow lines indicate laser-irradiated sites. Right, mean ± s.e.m. of the relative intensity of FUS–GFP at sites of DNA damage after ablation; n = 14 (DMSO) and 18 (lipoamide) cells from three independent experiments. e, Mean ± s.d. of relative full-length STMN2 mRNA levels normalized to those of GAPDH from two independent experiments. In b and e, MNs were treated as in a. Source data
Fig. 6
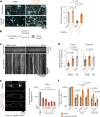
Fig. 6. Lipoamide improves cellular fitness in ALS iPS cell-derived MN and animal disease models.
a, Left, representative images of iPS cell-derived MNs treated as in Fig. 5a. Right, mean ± s.e.m. of the percentage of neurite (tubulin positive) area. Eighteen image fields were acquired from three independent experiments. P values were determined by a Tukey test without multiple-comparison correction. b, Schematic of a neuron culture showing the channels through which axons grow from the soma on the right. c, Kymographs of lysosome movement in the distal portion of FUS-P525L MN axons 3 days after treatment with compound solvent (DMSO) or 2 μM lipoamide, visualized with lysotracker. d, Mean ± s.e.m. of the relative proportion of lysotracker-labeled lysosomes moving at an average speed of greater than 0.2 μm s–1 following 3 days of treatment with 2 μM lipoamide or equivalent DMSO concentration solvent control for iPS cell-derived MNs expressing either FUS-P525L or WT FUS, normalized to the mean of proportion moving (proximal and distal) in DMSO-treated FUS-P525L MNs; n = 6 (FUS-P525L) or 3 (WT) biological replicates, analyzing five axon bundles per replicate. P values were determined by a Tukey test without multiple-comparison correction. e, Left, representative images of the pharynx of worms expressing fluorescently tagged PAB-1 with or without lipoic acid treatment (2 mM). Broken lines indicate the edges of the pharynges. Right, mean ± s.e.m. of the incidence of each protein aggregation in the pharyngeal muscles. Incidence of PAB-1 aggregation was scored from the proportion of animals with more than ten aggregates. P values were determined by two-tailed Fisher’s exact test; n = 107 to 230 for each sample from n = 1 experiment. f, Mean ± s.e.m. of the proportion of flies that climbed that were fed 0.1% DMSO (solvent control) or 430 µM lipoamide. Human WT or ALS-linked mutants of FUS (left) or TDP-43 (right) were expressed in MNs. P values were determined by unpaired two-tailed t-test; n = 30–40 (FUS) and 130–202 (TDP-43) flies from n = 3 or 4 independent experiments. Source data
Extended Data Fig. 1
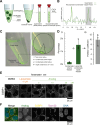
Extended Data Fig. 1. HeLa cell and in vitro follow-up screen identifying lipoamide.
a, Workflow for screening small molecules for effects on FUS–GFP localization in HeLa cells ex vivo. b, Ranked Mahalanobis distances for all 1600 compounds screened (mean from six fields of view) where high values indicate more compound effect. Several automated measures of FUS localization were combined into a single Mahalanobis distance score; the largest contributors were cytoplasmic FUS condensate number and area (see the method section). A cut-off of 130 was used to select 47 compounds for further analysis. c, The subcellular localization of FUS–GFP in unstressed HeLa cells, stressed cells with compound solvent (DMSO) negative control, and with the positive control emetine, as observed in the screen in B. Stress causes nuclear export of FUS and formation of stress granules (cytoplasmic liquid FUS-containing condensates). Insets, magnified images in the boxed areas. d, Workflow for screening small molecules for effects on FUS condensation of purified FUS–GFP in vitro. e, Ranked Z scores of change in condensate droplet number and signal partition into FUS–GFP droplets (formed under low salt conditions) where larger positive or negative values mean more compound effect. Scores were calculated at the maximum concentration at which the compound solvent (DMSO) negative control had no significant effect; 100 μM. Lipoamide, surfactant and heterotri-/tetracyclic compounds are indicated by data point colour. f, Appearance of the droplets with compound solvent (DMSO) negative control or examples of compound classes: cetylpyridinium chloride (surfactant), lipoamide or mitoxantrone (heterotricyclic). Note the larger drops with cetylpyridinium chloride and lipoamide and the fewer smaller drops with mitoxantrone. Source data
Extended Data Fig. 2
Extended Data Fig. 2. Lipoamide characterization in HeLa cells.
a, Mean ± s.d. of percentage of HeLa cells with ≥ 3 G3BP1-positive stress granules (SGs). Cells were treated with 1 mM arsenate for 1 h to induce SGs, followed by 10 µM lipoamide, lipoic acid, or 0.1% DMSO (control) in the presence of arsenate for indicated minutes. n = 52–248 cells from 3 independent experiments. b, Mean ± s.d. of relative intensity levels of puromycin normalized to those of GAPDH in HeLa cells treated with 10 µM lipoamide (0.1% DMSO as the control) for 1 h, followed by 1 mM arsenate for 1 h and 91.8 µM puromycin for 5 min, detected by immunoblotting from 3 independent experiments. c, Images of HeLa cells expressing GFP-tagged markers of other membrane-less organelle compartments subjected to 1 h treatment with 10 μM lipoamide (or DMSO control). Where unclear, thep position of nuclei is indicated with a broken outline. Lipoamide does not disrupt P bodies (DCP1A), Cajal bodies (COIL), or DNA damage foci (TRP53BP1). d, Images of U2OS cells stained with indicated markers of other membrane-less subcellular compartments subjected similarly to HeLa cells in G. Lipoamide also did not disrupt nuclear speckles (SC35), PML bodies (SP100), nucleoli (NPM1), or heterochromatin (HP1α). e, Images of HeLa cells expressing FUS–GFP subjected to different stresses – arsenate, sorbitol (osmotic), heat, or 6-deoxyglucose (DG; glycolysis) – with concurrent treatment with 10 μM lipoamide or lipoic acid. f, HeLa cells were treated with 0.1% DMSO (control), 10 µM lipoamide, or indicated concentrations of other known and potential antioxidants (ascorbic acid as representative images on the top) for 1 h, followed by 1 mM arsenate for 1 h in the presence of each chemical. SGs were labeled with G3BP1. Bottom, percentage of HeLa cells with ≥ 3 G3BP1-positive SGs from n = 119–202 cells. Source data
Extended Data Fig. 3
Extended Data Fig. 3. Tracking cellular uptake of [15N]-Lipoamide using NMR.
a, Methodology for quantitation of [15N]-lipoamide uptake by HeLa cells, using the trans-amide proton to measure [15N]-lipoamide concentration (see F- H). Medium with 100 μM [15N]-lipoamide was incubated for 1 h in the absence or presence of HeLa cells. Following removal of medium, the cells were washed with medium (without arsenate) and detached using EDTA-trypsin. Solution or cell pellet/in-cell NMR was used to determine [15N]-lipoamide concentration. Example spectra for cells stressed with 3 mM arsenate and incubated with R-(+)-lipoamide are shown with the same y axis scale. b, Cellular uptake was determined by subtracting signal from medium incubated with cells (red) from signal from medium without cells (blue). This was carried out for all four combinations of stressed (3 mM arsenate) or unstressed cells with [15N]-(R)-(+) or (±)-lipoamide. For stressed cells treated with [15N]-(R)-(+)-lipoamide the high signal intensity from the washed cell sample (green) is consistent with the large uptake from the medium calculated from the with (red) and without cell (blue) signal intensity. c, Quantitation of B showing percentage uptake and calculated intracellular concentration, assuming that lipoamide is uniformly distributed within cells (see Supplemental Methods). Uncertainty in measurement was approximately 30% and there was no significant difference in uptake between conditions. All measurements indicated substantial uptake of lipoamide and cellular concentrations >1 mM. d, Overview of synthesis of [15N]-lipoamide, highlighting the trans amide proton (14). e, 1H NMR spectrum of [15N]-lipoamide in CDCl3. Peaks can be unambiguously assigned to individual proton environments. f-h, Controls determining reliability of quantitation of [15N]-lipoamide using the amide protons in 15N edited 1H NMR experiments. f, Dependency of the cis (13) and trans (14) amide proton signal on temperature, at a constant pH of 8.3. Both resonances decreased with increasing temperature, indicating local molecular dynamics and/or interactions with H2O on ms to µs timescale reduce the signal. Trans amide proton resonance approaches a plateau towards 10 °C. g, Dependency of the cis and trans amide proton signal on pH, at a constant temperature of 10 °C. Together, indicating at 10 °C and below pH 8.6 integrated signal intensity of the trans-amide proton of lipoamide in 15N edited 1H NMR experiments is a reliable proxy for concentration. h, Signal intensity of the trans-amide proton of lipoamide, when dissolved in growth medium, decreased over time at 37 °C but not at 10 °C. At 10 °C signal intensity is stable for >10 h experiments. Source data
Extended Data Fig. 4
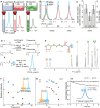
Extended Data Fig. 4. Experimental set up for portioning assays of lipoamide and its analog.
a-d, Methodology for determination of partition of [15N]-lipoamide into FUS condensates in vitro. a, Schematic showing the sample preparation process. b, Example of 15N edited 1H NMR signal around the 15N cis and trans amide protons for a dilute phase and condensate phase. Condensate phase spectrum is shown scaled by an experimentally determined signal factor, used in calculation of the signal fraction. c, Measurements for calculation of condensate pellet volume from macro photographs of the sample within a microcentrifuge tube. d, Mean ± s.d. of measured 15N edited 1H NMR signal fraction and condensate volume fraction (from 4 independent experiments) and calculated partition coefficient. Alternative presentation of the data in Fig. 2a. e, Representative images of HeLa cells pre-treated with indicated concentrations of lipoamide or the click-crosslink lipoamide analog in Fig. 2b for 1 h followed by 1 mM of arsenate for additional 1 h in the presence of compounds. SGs were labeled with G3BP1. f, The images of HeLa cells treated with the analog and subjected to arsenate treatment and UV cross-linking from Fig. 2c, with a channel of Tom-20 as a mitochondrial marker. Source data
Extended Data Fig. 5
Extended Data Fig. 5. Lipoamide weakly increases liquidity of FUS condensates in vitro.
a, NMR chemical shift deviations per residue for the FUS N-terminal PLD (residues 1 to 163) with 500 μM lipoamide compared to the drug solvent control (1% DMSO). Light gray bars indicate tyrosine residues and residues neighboring a tyrosine. b, Average 1H and 15N shifts across residues zero, one, two, three or more than three residues from a tyrosine in the presence of lipoamide. c, Top, fractions of FUS proteins condensed at indicated salt (KCl) concentrations in the presence of 300 µM lipoamide or the DMSO control (0.3% v/v). n = 16 image fields for each condition. Bottom, dilute phase concentrations (equivalent to saturation concentrations) of FUS–GFP at 150 mM KCl at different temperatures and lipoamide concentrations (errors are s.d.) d, Schematic illustrating the quantitation of condensate droplet liquidity using optical tweezers. Two droplets are brought into contact and begin to fuse: the time taken to relax to a single spherical droplet (once adjusted for the geometric mean radius as the characteristic droplet size) is a measure of the viscosity to surface tension ratio of the droplet – a proxy of liquidity. e, Droplet size-corrected relaxation times for droplet fusions with either 300 μM lipoamide (n = 93 independent fusion event) or equivalent DMSO solvent control (0.3%, n = 60). Box represents the 25th, 50th and 75th percentiles, whiskers represent 5th and 95th percentiles. p value by unpaired two-tailed t-test. Lipoamide reduces fusion time, indicating lower viscosity and/or greater surface tension. f–h, Effect of 30 μM lipoamide or lipoic acid on FUS G156E-GFP condensates ‘aging’, relative to an equivalent DMSO solvent control (0.3%). Condensates were formed under 50 mM of KCl while shaking. f, Representative images after 1 and 3 h aging, showing fiber formation in the DMSO sample in contrast to the lipoamide or lipoic acid samples. g, Representative fluorescence recovery after photobleaching (FRAP) time series of FUS condensates and fibers at corresponding time points. h, Mean ± s.d. of relative intensity of FUS–GFP FRAP in G. Aged (3 h) condensates treated with lipoamide or lipoic acid maintain large FUS-GFP mobile fraction. Both compounds delay fiber formation. i, Changes in intramolecular crosslinking due to lipoamide of FUS in in vitro low salt (80 mM KCl) condensates using the lysine-rich FUS K12 or FUS G156E. Significantly changed crosslinking sites with a change in intensity of more than two-fold and FDR ≤ 0.1; 3 independent experiments) are shown coloured in green (increased) or red (decreased). Other crosslinking sites are shown in gray. j, Dose-dependent effect of lipoamide on FUS K12, plotting absolute change in crosslink intensity relative to no lipoamide. Crosslinking sites with false discovery rate (FDR) > 0.1 are shown in blue, those with FDR ≤ 0.1 in orange (2 independent experiments). Two-fold change is indicated with a dashed red line. Source data
Extended Data Fig. 6
Extended Data Fig. 6. SFPQ and SRSF1 are cellular targets of lipoamide not necessary for stress granule formation.
a, Z scores of protein thermal stability in HeLa cells treated with only lipoamide and both lipoamide and arsenate. Proteins categorized as stabilized and destabilized in Fig. 4c, d are depicted in green and blue, respectively. The positions of FUS, TAF15, DLD, SFPQ, and SRSF1 are indicated. Black solid and broken lines indicate cutoffs of z scores used for the IDR analysis in Fig. 4c (±1.5) and the targeted RNAi screen (+2), respectively. b, Z scores of protein thermal stability in HeLa cells treated with only arsenate and both lipoamide and arsenate. Black lines indicate |z-score| = 1.5. In most proteins with Increased or decreased thermal stability by only arsenate treatment (|z-score [arsenate]| > 1.5), the shifts were prevented by lipoamide pre-treatment (|z-score [arsenate + lipoamide]| < 1.5; masked in orange). Proteins categorized in stabilized and destabilized in Fig. 4c, d are depicted in the same colors; note that shifts in their thermal stability was not primarily due to treatment with arsenate. c, Mean ± s.d. of percentage of HeLa cells with ≥ 3 G3BP1-positive stress granules. Cells depleted of indicated genes were treated with 10 µM lipoamide or 0.1% DMSO for 1 h followed by 1 mM arsenate for 1 h in the presence of lipoamide before stained with G3BP1. n = 324–393 cells from 3 independent experiments. p values by Tukey’s test with no multiple comparison corrections. d, Domain compositions and distributions of IDRs of human SFPQ (left) and SRSF1 (right). PLD, prion-like domain; RRM, RNA recognition motif; NOPS, NonA/paraspeckle domain; CC, coiled-coil domain; NLS, nuclear localizing signal; G-rich, glycine-enriched domain; SR-rich, serine/arginine-enriched domain. e, Mean ± s.d. of percentage of cells with ≥3 stress granules. HeLa cells depleted of indicated genes were treated with 3 mM arsenate for 1 h, and then with 100 µM lipoamide or the control DMSO in the presence of arsenate for indicated minutes. n = 213–467 cells from 3 independent experiments. f, Representative images of HeLa cells treated and labeled as in Fig. 4e but without arsenate, representative of 3 independent experiments. Source data
Extended Data Fig. 7
Extended Data Fig. 7. SFPQ dissolves FUS condensates in vitro.
a, Representative images of SFPQ-GFP (top, 10 µM) and FUS-GFP (bottom, 7 µM) protein condensates at a low salt condition (75 mM KCl) and in the presence of H2O2 from >3 independent experiments. b, SDS-PAGE (non-reduced condition) of 10 µM of the purified and untagged SFPQ proteins in diluted state oxidized with the indicated percentages of H2O2 for 30 min. c, Left, representative images of co-incubation of indicated concentrations of SFPQ-GFP and 6 µM of FUS-SNAP at a physiological salt concentration (150 mM KCl) from >3 independent experiments. SFPQ-GFP do not form condensates at 150 mM KCl while they suppress condensation of FUS proteins in dosage-dependent manner. Right, mean ± s.d. of FUS condensate fraction in the presence of GFP (control) or SFPQ-GFP. n = 16 image fields. d, Representative images of FUS-SNAP condensates (4 µM) co-incubated with 40 µM of GFP or SFPQ-GFP at a physiological salt concentration (150 mM KCl) in the presence of indicated percentages of H2O2 from 3 independent experiments. e, Schema of the time course used in Fig. 5c. Cells were firstly cultured in methionine (Met)-free medium and then in each medium (complete medium or Met-free medium supplemented with Met or AHA) before arsenate treatment. f, Left, mean ± s.d. of relative expression levels of SFPQ normalized to those of α-Tubulin in HeLa cells, detected by immunoblotting from 3 independent experiments. Right, mean ± s.d. of nucleus/cytoplasm signal ratio of SFPQ in HeLa cells, detected by immunostaining from 3 independent experiments (n = 363–402 cells). The cells were treated with the indicated medium as in E. p values from Tukey’s test. Source data
Extended Data Fig. 8
Extended Data Fig. 8. Lipoamide rescues nuclear localization and functioning of ALS-linked proteins.
a, Left, mean ± s.d. of nuclear-cytoplasmic intensity ratio of FUS and TDP-43 in HeLa cells pre-treated with 10 µM lipoamide (0.1% DMSO as the control) for 1 h followed by 1 mM arsenate for 1 h in the presence of lipoamide. n = 290–603 cells from 3 independent experiments. p values by two-tailed unpaired t-test. Right, representative image of the HeLa cells stained with TDP-43. Arrowheads indicate some of cytoplasmic punctate signals (stress granules). b, Mean ± s.d. of nuclear-cytoplasmic intensity ratio of FUS-GFP in SFPQ-depleted and the control HeLa cells pre-treated with 10 µM lipoamide (0.1% DMSO as the control) for 1 h followed by 1 mM arsenate for 1 h in the presence of lipoamide. n = 450–543 cells from 3 independent experiments. p values by Tukey’s test. c, (Left) time-lapse images of iPSC-derived MNs expressing FUS P525L-GFP cultured for 14 days. Cells were treated with 0.02% DMSO or 20 µM lipoamide for 1 h followed by 20 µM arsenite for indicated minutes in the presence of lipoamide. Broken lines indicate outline of some nuclei. Arrowheads indicate some cytoplasmic FUS P525L foci. (Right) mean ± s.e.m. of number of FUS P525L foci per MN after arsenite treatment. n = 16 (DMSO) and 18 (lipoamide) cells from 3 independent experiments. p value by two-tailed unpaired t-test. d, (Left) representative images of iPSC-derived MNs expressing FUS P525L-GFP cultured for 5 days and then 30 days in the presence of 0.02% DMSO or 20 µM lipoamide. Broken lines indicate outline of some nuclei. (Right) mean ± s.e.m. of nuclear intensity of FUS P525L-GFP, normalized to that in the control (DMSO). n = 64–198 cells from 5 independent experiments. p value by one-sample unpaired t-test. Source data
Extended Data Fig. 9
Extended Data Fig. 9. Extended analysis of C. elegans and D. melanogaster animal models of ALS.
a, Mean ± s.e.m. of incidence of each protein aggregation in the pharyngeal muscles. Incidence of RHO-1 was scored on a low, medium, high scale (see Methods). b, Mean ± s.e.m. of percentage of flies that climbed, with lipoic acid feeding in place of lipoamide in Fig. 6f. p values by unpaired two-tailed t-test. c, (Left) Representative images of synaptic boutons of TDP-43 M337V-expressing flies, immunostained with an antibody against horseradish peroxidase (HRP), which labels the neuronal membrane. Arrowheads indicate appearance of satellite boutons. (Right) mean ± s.d. of percentage of satellite boutons (number of satellite boutons/number of total boutons) per fly. The control flies fed with 0.1% DMSO (gray; n = 9) and TDP-43 M337V-expressing flies fed with 0.1% DMSO (n = 19) or that containing 430 µM lipoamide (orange; n = 19) were examined. p value by Tukey’s test. Source data

References

    1. Robberecht, W. & Philips, T. The changing scene of amyotrophic lateral sclerosis. Nat. Rev. Neurosci.14 248–264 (2013). - PubMed
    1. Miller, R. G., Mitchell, J. D. & Moore, D. H. Riluzole for amyotrophic lateral sclerosis (ALS)/motor neuron disease (MND). Cochrane Database Syst. Rev.2002, CD001447 (2012). - PubMed
    1. Abe, K. et al. Safety and efficacy of edaravone in well defined patients with amyotrophic lateral sclerosis: a randomised, double-blind, placebo-controlled trial. Lancet Neurol.16, 505–512 (2017). - PubMed
    1. Miller, T. M. et al. Trial of antisense oligonucleotide tofersen for SOD1 ALS. N. Engl. J. Med.387, 1099–1110 (2022). - PubMed
    1. Deng, H., Gao, K. & Jankovic, J. The role of FUS gene variants in neurodegenerative diseases. Nat. Rev. Neurol.10, 337–348 (2014). - PubMed

MeSH terms

Substances