. 2025 Jun;28(6):1213-1225.
doi: 10.1038/s41593-025-01956-9. Epub 2025 May 14.

Activity-driven myelin sheath growth is mediated by mGluR5

Affiliations

Activity-driven myelin sheath growth is mediated by mGluR5

Philipp N Braaker et al. Nat Neurosci. 2025 Jun.

Abstract

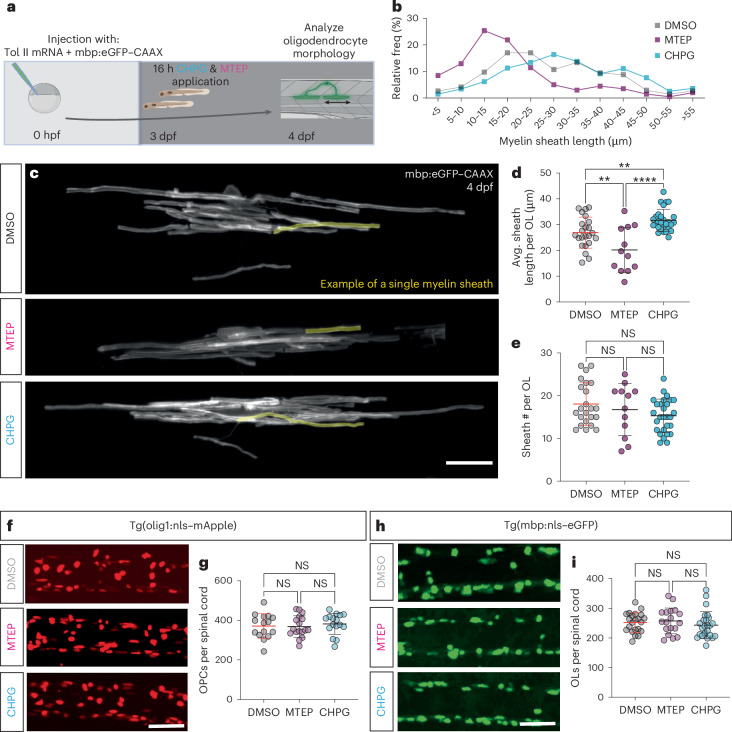
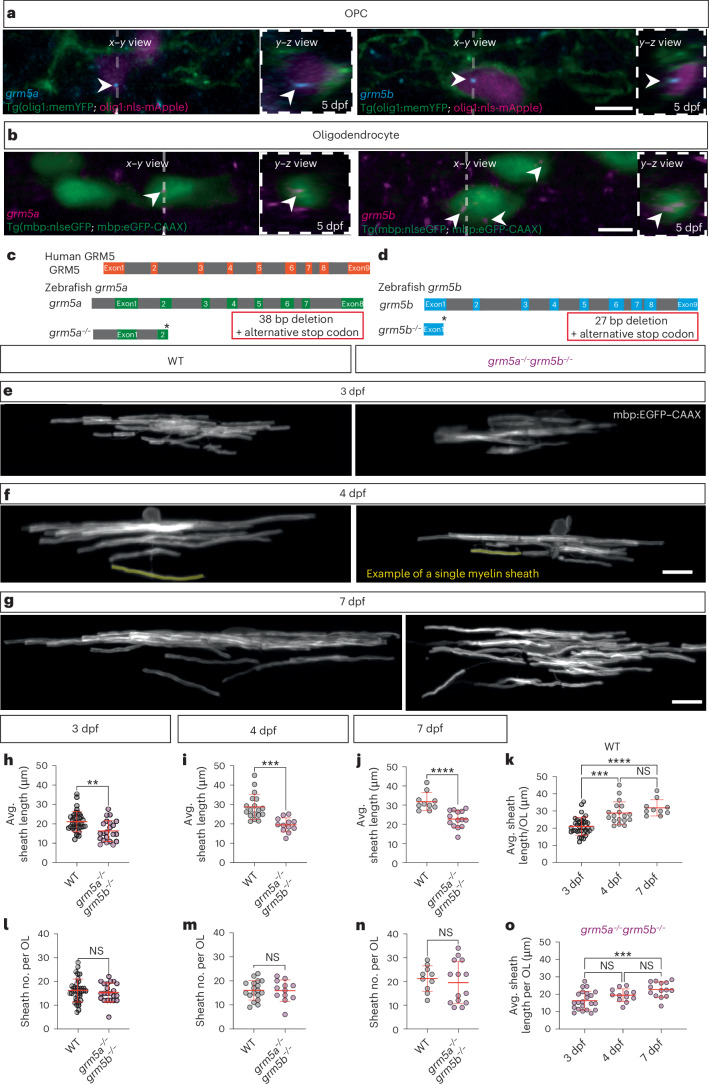
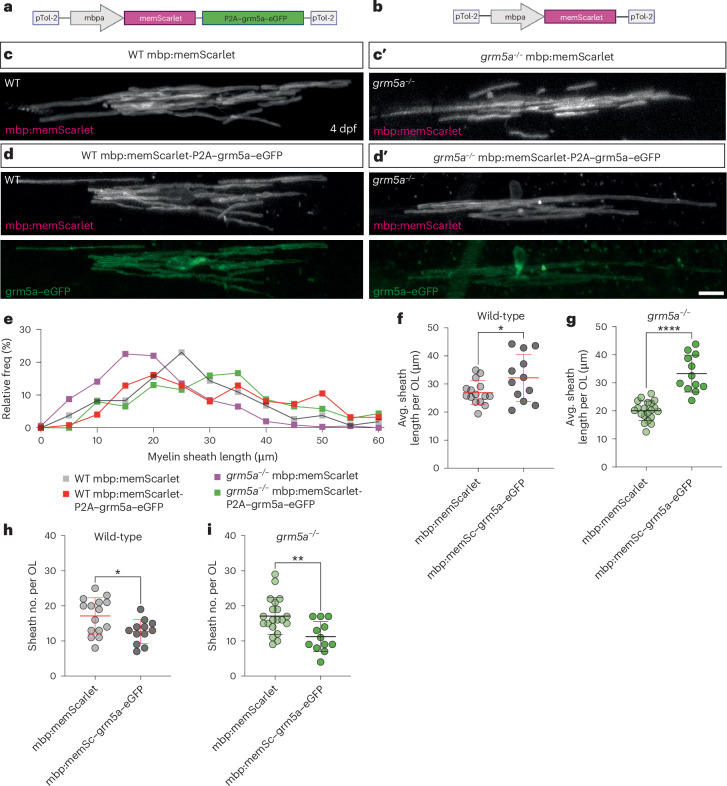
Myelination by oligodendrocytes in the central nervous system is influenced by neuronal activity, but the molecular mechanisms by which this occurs have remained unclear. Here we employed pharmacological, genetic, functional imaging and optogenetic-stimulation approaches in zebrafish to assess activity-regulated myelination in vivo. Pharmacological inhibition and activation of metabotropic glutamate receptor 5 (mGluR5) impaired and promoted myelin sheath elongation, respectively, during development, without otherwise affecting the oligodendrocyte lineage. Correspondingly, mGluR5 loss-of-function mutants exhibit impaired myelin growth, while oligodendrocyte-specific mGluR5 gain of function promoted sheath elongation. Functional imaging and optogenetic-stimulation studies revealed that mGluR5 mediates activity-driven high-amplitude Ca2+ transients in myelin. Furthermore, we found that long-term stimulation of neuronal activity drives myelin sheath elongation in an mGluR5-dependent manner. Together these data identify mGluR5 as a mediator of the influence of neuronal activity on myelination by oligodendrocytes in vivo, opening up opportunities to assess the functional relevance of activity-regulated myelination.


Conflict of interest statement

Competing interests: The authors declare no competing interests.

Figures

Fig. 1
Fig. 1. mGluR5 stimulation increases myelin sheath length without affecting cell number.
a, Protocol to label individual oligodendrocytes, manipulate mGluR5 activity and assess myelination. b, Relative frequency of sheath lengths (DMSO n = 427, mean 16.79 µm; MTEP n = 201, mean 18.41 µm; CHPG n = 470, mean 30.44 µm). c, Individual oligodendrocytes at 4 dpf, labeled with mbp:eGFP–CAAX, after treatment with DMSO, mGluR5 antagonist MTEP and allosteric agonist CHPG. Scale bar, 15 µm. d, Mean sheath length per oligodendrocyte (one OL/fish) post treatment (one-way analysis of variance (ANOVA), P < 0.0001; Holm–Šídák’s multiple comparisons test: DMSO versus CHPG P = 0.0062, DMSO versus MTEP P = 0.0047; CHPG versus MTEP P < 0.0001). 1% DMSO (N = 23, 26.90 µm ± 6.031), CHPG (N = 28, 31.66 µm ± 4.27) and MTEP (N = 12, 20.15 µm ± 8.77). e, Number of myelin sheaths produced by single oligodendrocytes (one-way ANOVA; P = 0.2090, Kruskal–Wallis DMSO versus CHPG P = 0.2477; DMSO versus MTEP P > 0.9999; CHPG versus MTEP P > 0.9999). DMSO, N = 23, 18.04 ± 4.995; MTEP, N = 12, 16.75 ± 3.89; CHPG N = 28, 15.32 ± 6.08). Scale bar, 50 µm. f, Representative images of Tg(olig1:nls–mApple) after pharmacological manipulation of mGluR5. Scale bar, 50 µm. g, Number OPCs in the spinal cord (one-way ANOVA; P = 0.7774; Tukey’s multiple comparisons test, DMSO versus MTEP P = 0.9908; DMSO versus CHPG P = 0.8579; CHPG versus MTEP P = 0.7781), DMSO (N = 15); CHPG (N = 17); MTEP (N = 16). DMSO 371.1 ± 62.39; MTEP 368.5 ± 54.37; CHPG 381.8 ± 53.13. h, Representative images of Tg(mbp:nls–eGFP) after pharmacological manipulation of mGluR5. i, Number of myelinating oligodendrocytes in the spinal cord (one-way ANOVA; P = 0.5155; Tukey’s multiple comparisons test: DMSO versus MTEP P = 0.9141; DMSO versus CHPG P = 0.7359; CHPG versus MTEP P = 0.5037), DMSO (N = 22); CHPG (N = 25); MTEP (N = 18). DMSO, 252 ± 33.24; MTEP, 257.3 ± 43.61; CHPG, 243 ± 45.46. Scale bar, 50 µm. Data indicate mean ± s.d. Source data
Fig. 2
Fig. 2. Mutations in genes encoding mGluR5 reduce myelin sheath length without affecting sheath number.
a, HCR detection of grm5a and grm5b messenger RNA in OPCs at 5 dpf. Scale bar, 5 μm. b: HCR detection of grm5a and grm5b mRNA in OLs at 5 dpf. Scale bar, 5 μm. c,d, Schematic showing organization of human and zebrafish genes encoding mGluR5 and their CRISPR/Cas9 based editing that led to identification of mutants with premature STOP codons in exons 2 and 1 of grm5a (c) and grm5b (d), respectively. e, Images of wild-type (N = 35) and grm5a−/−grm5b−/− (N = 22) oligodendrocytes expressing mbp:eGFP–CAAX. f, Images of wild-type (N = 18) and grm5a−/−grm5b−/− (N = 12) oligodendrocytes expressing mbp:eGFP–CAAX at 4 dpf. g, Images of wild-type (N = 10) and grm5a−/−grm5b−/− (N = 14) oligodendrocytes expressing mbp:eGFP–CAAX at 7 dpf. Scale bars 15 μm (eg). h, Mean sheath length of wild-type (N = 35, 21.11 ± 5.149) and grm5a−/−grm5b−/− (N = 22, 16.34 ± 5.38) oligodendrocytes, in 3 dpf old animals (two-sided Mann–Whitney U-test, P = 0.0035). i, Mean sheath length of wild-type (N = 18, 28.8 ± 6.5) and grm5a−/−grm5b−/− (N = 12, 19.47 ± 3.67) oligodendrocytes, in 4 dpf old animals (two-sided unpaired t-test: P = 0.0001). j, Mean sheath length of wild-type (N = 10, 31.79 ± 4.723) and grm5a−/−grm5b−/− (N = 14, 22.68 ± 4.40) oligodendrocytes, in 7 dpf old animals (two-sided unpaired t-test: P < 0.0001). k, Comparison of mean sheath length in wild-type animals between 3, 4 and 7 dpf animals (one-way ANOVA, Kruskal–Wallis test P < 0.0001; Dunn’s multiple comparisons test: wild-type 3 dpf versus 4 dpf P = 0.0002; wild-type 4 dpf to 7 dpf P = 0.7173, wild-type 3 dpf versus 7 dpf P < 0.0001). (3 dpf, 21.11 ± 5.149; 4 dpf, 28.8 ± 6.52; 7 dpf, 31.79 ± 4.72). l, Number of myelin sheath per oligodendrocyte in 3 dpf wild-type (16.2 ± 4.8) and grm5a−/−grm5b−/− (15.36 ± 3.94) (two-sided unpaired t-test; P = 0.4964). m, Number of sheaths per oligodendrocyte in 4 dpf wild-type (16.06 ± 4.03) and grm5a−/−grm5b−/− (15.92 ± 34.46) (two-sided unpaired t-test; P = 0.9301). n, Number of myelin sheath per oligodendrocyte in 7 dpf wild-type (21.2 ± 5.35) and grm5a−/−grm5b−/− (19.5 ± 8.91) (two-sided unpaired t-test; P = 0.5971). o, Comparison of the mean sheath length in grm5a−/−grm5b−/− animals between 3, 4 and 7 dpf animals (one-way ANOVA, Kruskal–Wallis test P < 0.0001; Dunn’s multiple comparisons test: grm5a−/−grm5b−/− 3 dpf versus 4 dpf P = 0.1675; grm5a−/−grm5b−/− 4 dpf to 7 dpf P = 0.2070, grm5a−/−grm5b−/− 3 dpf versus 7 dpf P < 0.0009) (3 dpf, 16.34 ± 5.38; 4 dpf, 19.47 ± 3.67; 7 dpf, 22.68 ± 4.40). Data show mean ± s.d. Source data
Fig. 3
Fig. 3. Oligodendrocyte-restricted expression of grm5a promotes myelin sheath elongation.
a, Construct used to express mGluR5 tethered to eGFP, alongside a membrane anchored reporter mScarlet, in myelinating oligodendrocytes. b, Control construct used to express fluorescent reporter in myelinating oligodendrocytes. c,c′, Images of oligodendrocytes expressing control mbp:memScarlet in wild-type (WT) (c) (N = 15) and grm5a−/− (c′) (N = 20) animals at 4 dpf. d,d′, Oligodendrocytes expressing mbp:memScarlet-P2A–grm5a–eGFP in WT (d) (N = 12) and grm5a−/− (d′) (N = 12) animals at 4 dpf. Scale bar, 10 μm. e, Relative frequency distribution of individual myelin sheath lengths. WT mbp:memScarlet n = 265 (mean 26.49 µm); WT mbp:memScarlet-P2A–grm5a–eGFP n = 124 (mean 31.55 µm); grm5a−/− mbp:memScarlet n = 365 (mean 19.54 µm); grm5a−/− mbp:memScarlet-P2A–grm5a–eGFP n = 138 (mean 31.58 µm). f, Mean sheath length of WT oligodendrocytes expressing mbp:memScarlet-P2A–grm5a–eGFP (N = 12, 32.19 ± 8.41) or mbp:memScarlet (N = 15, 26.92 ± 4.28) (two-sided unpaired t-test, P = 0.0445). g, Mean myelin sheath length of grm5a−/− oligodendrocytes expressing mbp:memScarlet-P2A–grm5a–eGFP (N = 12, 33.25 ± 6.57) or mbp:memScarlet (N = 20, 20.05 ± 3.45) (two-sided unpaired t-test, P = <0.0001). h, Sheath number per oligodendrocytes expressing mbp:memScarlet-P2A–grm5a–eGFP (12.67 ± 3.46) or mbp:memScarlet (17.13 ± 5.17) (two-sided unpaired t-test, P = 0.0164). i, Sheath number per oligodendrocytes in grm5a−/− mutants expressing mbp:memScarlet-P2A–grm5a–eGFP (N = 12, 11.25 ± 4.33) or mbp:memScarlet (N = 20, 17.1 ± 5.21) (two-sided unpaired t-test, P = 0.0027). Scale bar, 10 μm. Data show mean ± s.d. Source data
Fig. 4
Fig. 4. Endogenous mGluR5 is required for CHPG-induced high-amplitude myelin Ca2+ transients to occur.
a, Schematic of treatment of larvae and live imaging of Ca2+ activity in myelin sheaths. b,b′, Top shows representative maximum time series projections of Tg(mbp:memGCaMP7s) fluorescence with Ca2+ transients detected by AQuA2 false-colored automatically; bottom show single time-point images from the time-lapse series and highlight transients identified within yellow boxes. WT (N = 14) (b) and grm5a−/−grm5b−/− animals (b′) (N = 16) treated with vehicle and CHPG (WT N = 15; grm5a−/−grm5b−/− N = 17). Scale bar, 10 µm. c, Median amplitude (dF/F) of Ca2+ transients per fish (one-way ANOVA; P = 0.0079; Tukey’s multiple comparison test; WT DMSO versus CHPG P = 0.111, WT DMSO versus grm5a−/−grm5b−/− DMSO P = 0.9633; WT DMSO versus grm5a−/−grm5b−/− CHPG P = 0.9210, WT CHPG versus grm5a−/−grm5b−/− DMSO P = 0.0310, WT CHPG versus grm5a−/−grm5b−/− CHPG P = 0.0407; grm5a−/−grm5b−/− CHPG versus grm5a−/−grm5b−/− DMSO P = 0.9987) (WT DMSO N = 14, 0.94 ± 0.24, WT CHPG N = 15, 1.21 ± 0.31, grm5a−/−grm5b−/− DMSO N = 16, 0.98 ± 0.16, grm5a−/−grm5b−/− CHPG N = 17, 0.99 ± 0.19). d, Frequency of myelin Ca2+ transients in CHPG and DMSO-treated grm5a−/−grm5b−/− mutant and WT animals (one-way ANOVA P = 0.1658; Holm–Šídák’s multiple comparisons tests: WT DMSO versus WT CHPG P = 0.3022; WT DMSO versus grm5a−/−grm5b−/− DMSO P = 0.2591; WT CHPG versus grm5a−/−grm5b−/− DMSO P = 0.9840; WT CHPG versus grm5a−/−grm5b−/− CHPG P = 0.6868; WT DMSO versus grm5a−/−grm5b−/− CHPG P = 0.6868). WT DMSO 138 ± 149.2, WT CHPG 74.39 ± 48.68, grm5a−/−grm5b-/, DMSO 75.04 ± 82.95, grm5a−/−grm5b−/− CHPG 108.9 ± 95.43. Scale bar, 10 µm. e, Median duration of Ca2+ transients per fish (one-way ANOVA P = 0.2687; Tukey’s multiple comparisons test: WT DMSO versus WT CHPG P = 0.4745; WT DMSO versus grm5a−/−grm5b−/− DMSO P = 0.9864; WT DMSO versus grm5a−/−grm5b−/− CHPG P = 0.8633; WT CHPG versus grm5a−/−grm5b−/− DMSO P = 0.2638, WT CHPG versus grm5a−/−grm5b−/− CHPG P = 0.08864; grm5a−/−grm5b−/− DMSO versus grm5a−/−grm5b−/− CHPG P = 0.6516). WT DMSO 12.76 ± 6.964, WT CHPG 9.495 ± 5.044, grm5a−/−grm5b−/−, DMSO 13.52 ± 5.936, grm5a−/−grm5b−/−, CHPG 11.06 ± 6.233. f, Ca2+ transient dF/F traces of the events shown in corresponding conditions in b and b'. Data show mean ± s.d. Source data
Fig. 5
Fig. 5. Opto-stimulation of neuronal activity induces mGluR5-dependent high-amplitude myelin Ca2+ transients.
a, Opto-stimulation of ChRimsonR-expressing Chx10 interneurons is carried out during continuous time-lapse imaging of myelin Ca2+ transients in Tg(mbp:memGCaMP7s) animals. b, Optogenetic-stimulation paradigm, consisting of the pre-stimulation period ‘pre’ (gray), stimulation period ‘stim’ (black; single opto-stimulation/light pulse (red) per min, ending with 4× stimulations within 10 s) and post-stimulation period (green). c, Maximum projection of AQuA2-detected Ca2+ transients in a WT Tg(chx10:Gal4 UAS:ChRimsonR–tdTomato;mbp:memGCaMP7s) animal at 4 dpf. c′, Individual frames of time series showing the increase in fluorescence associated with myelin Ca2+ transient indicated by boxed area in c. d, Maximum projection of AQuA2-detected Ca2+ transients in a grm5a−/−grm5b−/−, Tg(chx10:Gal4 UAS:ChRimsonR–tdTomato; mbp:memGCaMP7s) animal at 4 dpf. Scale bar, 10 µm. d′, Individual frames of time series showing the increase in fluorescence associated with myelin Ca2+ transient indicated by boxed area in d. e, Frequency of myelin Ca2+ transients in WT animals across pre, stim and post-stim periods (two-sided Friedman test P = 0.0103; multiple comparisons test: pre versus stim P = 0.1017; pre versus post P = 0.0140; stim. versus post P > 0.9999) (WT N = 9, WT pre 2.55 ± 1.83, WT stim 7.51 ± 7.95; WT post 14.97 ± 14.75). f, Frequency of myelin Ca2+ transients per grm5a−/−grm5b−/− animals over time across pre, stim and post-stim periods (two-sided Friedman test P = 0.008; multiple comparisons test: pre versus stim P > 0.9999; pre versus post: P = 0.0179; stim versus post P = 0.0373) (grm5a−/−grm5b−/− N = 8, grm5a−/−grm5b−/− pre 1.28 ± 0.53; grm5a−/−grm5b−/− stim 1.93 ± 1.39; grm5a−/−grm5b−/− post 6.34 ± 5.06). g, Individual WT Ca2+ amplitudes separated into three periods, pre (n = 65), stim (n = 175) and post-stimulation (n = 173) (One-way ANOVA, P = <0.0001, Kruskal–Wallis test multiple comparison: pre versus stim P > 0.9999; pre versus post P < 0.0001, stim versus post P < 0.0001) WT pre 0.76 ± 0.25, WT stim 0.88 ± 0.61 WT post 1.22 ± 0.78. h, Individual grm5a−/−grm5b−/− Ca2+ amplitudes separated into the three periods, pre (n = 50), stim (n = 45) and post-stimulation (n = 45) (one-way ANOVA, Kruskal–Wallis test P= 0.6768, Dunn’s multiple comparison, pre versus stim P > 0.9999; pre versus post P > 0.9999, stim versus post P > 0.9999) grm5a−/−grm5b−/− pre 0.63 ± 0.19, grm5a−/−grm5b−/− stim 0.69 ± 0.34 grm5a−/−grm5b−/− post 0.66 ± 0.20. Scale bar, 10 µm. Data are shown as mean ± s.d. Source data
Fig. 6
Fig. 6. mGluR5 mediates myelin sheath growth in response to opto-stimulation of chx10 interneurons.
a, Experimental setup for long-term (16 h) opto-stimulation of individual ChRimsonR-positive and -negative Tg(mbp:memGCaMP7s) fish. Fish were screened for transgenesis, responsiveness to opto-stimulation and placed in individual wells of a 96-well plate and optically stimulated for 16 h before myelin morphology was assessed. b, Representative images, following 16 h of opto-stimulation, of a WT (left) and grm5a−/−grm5b−/− mutant (right) expressing Tg(chx10:ChRimsonR–tdTomato;mbp:memGCaMP7s) (ChR+) (WT N = 21, grm5a−/−grm5b−/− N = 18) (top). Representative images of Tg(mbp:memGCaMP7s), ChRimsonR–tdTomato negative (ChR) WT (left) and grm5a−/−grm5b−/− mutants (right) following 16 h of opto-stimulation (WT N = 13, grm5a−/−grm5b−/− N = 9) (bottom). Scale bar, 10 µm. c, Avg. myelin sheath length per WT and grm5a−/−grm5b−/− ChR+ and ChR animals (one-way ANOVA; P < 0.0001; Tukey’s multiple comparisons; WT ChR+ versus WT ChR P = 0.0032; WT ChR+ versus grm5a−/−grm5b−/− ChR+ P < 0.0001; WT ChR+ versus grm5a−/−grm5b−/− ChR P < 0.0001; WT ChR versus grm5a−/−grm5b−/− ChR+ P = 0.1636; WT ChR versus grm5a−/−grm5b−/− ChR P = 0.0488; grm5a−/−grm5b−/− ChR+ versus grm5a−/−grm5b−/− ChR P = 0.7810) WT ChR N = 13, 18.02 ± 4.73 WT ChR+ N = 21, 22.24 ± 3.16 grm5a−/−grm5b−/− ChR N = 18, 14.24 ± 2.44 grm5a−/−grm5b−/− ChR+ N = 18, 15.51 ± 2.40. d: Relative frequency distribution of individual sheath lengths, measured post-stimulation (WT ChR+ n = 462, 21.67 µm; WT ChR n = 315, 16.23 µm; grm5a−/−grm5b−/− ChR+ n = 271, 14.04 µm; grm5a−/−grm5b−/− ChR n = 271, 15.11 µm). Data are shown as mean ± s.d. Source data
Extended Data Fig. 1
Extended Data Fig. 1. mGluR5 loss of function mutants develop normally and show normal swimming behavior.
A: Brightfield image of a 4 dpf old zebrafish. B Brightfield image of a 4 dpf grm5a−/− grm5b−/− mutant zebrafish. C: Swimming behavior of 5 dpf mGluR5 mutants and WT siblings in light and dark phases (WT N = 21 mean 863.8, SD: ±260.6; grm5a−/− N =14, mean: 860.3, SD: ±296.4; grm5b−/− N =13, mean: 856.7, SD: ±351.8; grm5a−/−grm5b−/− N =30, mean:860.3, SD: ±238.9). Average distances swam over time and distinct phases by different groups. D: Distance swam by individual fish during all dark phases combined (WT N = 21 mean 863.8, SD: ±260.6; grm5a-/- N=14, mean: 860.3, SD: ±296.4; grm5b-/-=13, mean: 856.7, SD: ±351.8; grm5a−/−grm5b-/- N=30, mean:860.3, SD: ±238.9). (One-Way ANOVA; p-value = 0.9999, Tukey’s multiple comparisons test: WT vs. grm5a-/- p-value = 0.9999, WT vs. grm5b-/- p-value = 0.9999, WT vs. grm5a-/-grm5b-/- p-value = 0.9999, grm5a-/- vs. grm5b-/- p-value = 0.9999, grm5a-/- vs. grm5a-/-grm5b-/- p-value = 0.9999,). E: Distance swam by individual fish during all light phases combined (WT N= 21 mean 348, SD: ±259.5; grm5a-/- N=14, mean: 313.9, SD: ±259.5; grm5b-/- N=13, mean: 390.8 SD: ±269.3; grm5a-/-grm5b-/-=30, mean:344.5, SD: ±253.3). (One-Way ANOVA; p-value = 0.2334; Tukey’s multiple comparisons test: WT vs. grm5a-/- p-value = 0.9807, WT vs. grm5b-/- p-value = 0.9650, WT vs. grm5a-/-grm5b-/- p-value = 0.9999 grm5a-/- vs. grm5b-/- p-value = 0.8653, grm5a-/- vs. grm5a-/-grm5b-/- p-value = >0.983, grm5a-/- vs. grm5a-/-grm5b-/- p-value = 0.9484). Source data
Extended Data Fig. 2
Extended Data Fig. 2. mGluR5 loss of function oligodendrocytes have shorter myelin sheaths and are growing between 3 and 4 dpf.
A: 3 and 4 dpf wild-type oligodendrocytes labeled with mpb:eGFP-CAAX (N = 36). B: 3 and 4 dpf grm5a-/-grm5b-/- oligodendrocytes at 3 dpf (N = 22). C: 3 and 4 dpf grm5a-/- oligodendrocytes (N = 14). D: 3 and 4 dpf grm5b-/- oligodendrocytes (N = 17). E: Relative frequency distribution of individual measured myelin sheath lengths in 3 dpf control and loss of function mutants (WT n = 583, mean: 20.03 µm) (grm5a-/- n = 259, mean: 14.08 µm) (grm5b-/- n = 279 mean: 13.48 µm) (grm5a-/-grm5b-/- n = 338, mean: 15.89 µm). F: Relative frequency distribution of individual measured myelin sheath lengths in 4 dpf control and loss of function mutants (WT n = 288, mean: 27.52 µm; grm5a-/- n = 164, mean: 15.9 µm; grm5b-/- n = 209, mean: 19.72 µm; grm5a-/-grm5b-/- n = 191, mean: 18.88 µm). G Relative frequency distribution of individual measured myelin sheath length in 7 dpf WT (n:212 mean: 31.34 µm) and grm5a-/-grm5b-/- (n = 259, mean: 21.87) animals. H: Comparison between sheath lengths per cell in 3 and 4 dpf fish (One-Way ANOVA p-value > 0.0001; Tukey’s multiple comparisons test: 3 dpf WT vs. 3 dpf grm5a-/- p-value = 0.0038; 3 dpf WT vs. 3 dpf grm5b-/- p-value = 0.0064; WT 3 dpf vs. 3 dpf grm5a-/- grm5b-/-p-value = 0.0293; 3 dpf WT vs. 4 dpf WT: p-value = <0.0001; WT 4 dpf vs. 4 dpf grm5a-/- p-value = <0.0001; WT 4 dpf vs. 4 dpf grm5b-/- p-value = <0.0028; WT 4 dpf vs. 4 dpf grm5a-/-grm5b-/- p-value = 0.0002; 3 dpf WT vs 4 dpf grm5a-/-grm5b-/- p-value = 0.9842; 3 dpf grm5a-/- vs. 4 dpf WT p-value = <0.0001; 3 dpf grm5b-/- vs. 4 dps WT p-value = <0.0001, 3 dpf grm5a-/-grm5b-/- vs. 4 dpf WT p-value = <0.0001). WT 3 dpf mean: 21.11, SD: ±5.15; 3 dpf grm5a-/- mean= 14.5, SD: ±4.77; 3 dpf grm5b-/- mean= 15,17 SD: ±5.38; 3 dpf grm5a-/- grm5b-/- mean= 16.34 SD: ±5.376; 4 dpf WT mean: 28.8, SD: ±6.519; 4 dpf grm5a-/- mean: 15.99 SD: ±3.94, 4 dpf grm5b-/- mean: 20.83 SD: ±6.716; 4 dpf grm5a-/-grm5b-/- mean: 19.47, SD: ±3.67). I: Myelin sheath numbers of 3 and 4 dpf WT and mGluR5 mutants (One-way ANOVA p-value = 0.2457 Tukey’s multiple comparisons test: 3 dpf WT vs. 3 dpf grm5a-/- p-value = 0.8436; 3 dpf WT vs. 3 dpf grm5b-/- p-value = 0.9995; WT 3 dpf vs. 3 dpf grm5a-/- grm5b-/-p-value = 0.9988; 3 dpf WT vs. 4 dpf WT: p-value = >0.9999; WT 4 dpf vs. 4 dpf grm5a-/- p-value = 0.4523; WT 4 dpf vs. 4 dpf grm5b-/- p-value = 0.982; WT 4 dpf vs. 4 dpf grm5a-/-grm5b-/-p-value = >0.9999; 3 dpf WT vs. 4 dpf grm5a-/-grm5b-/- p-value = 0.9992, 3 dpf grm5a-/- vs. 4 dps WT p-value = 0.8797; 3 dpf grm5b-/- vs. 4 dps WT p-value = 0.9994, 3 dpf grm5a-/-grm5b-/- vs. 4 dpf WT p-value = 0.9999). WT 3 dpf mean: 16.2, SD: ±4.80; 3 dpf grm5a-/- mean: 18.5, SD: ±5.00 3 dpf grm5b-/- mean: 17, SD: ±4.74; 3 dpf grm5a-/- grm5b-/- mean: 15.36 SD: ±3.94; 4 dpf WT mean: 16.06 SD: ±4.04; 4 dpf grm5a-/- mean: 20.5 SD: ±8.23, 4 dpf grm5b-/- mean: 17.83 SD: ±7.49; 4 dpf grm5a-/-grm5b-/- mean: 15.92, SD: ±4.46). Source data
Extended Data Fig. 3
Extended Data Fig. 3. mGluR5 loss of function mutation does not alter myelin thickness, or nodal gap width.
A: Confocal images of mbp:memGCaMP7s used to assess myelin thickness around the Mauthner axon in wild-type and grm5a-/- grm5b-/- at 3 and 7 dpf. B: Confocal images of mbp:memGCaMP7s indicating myelin sheaths and nodal gaps in wild-type and grm5a-/- grm5b-/- animals at 3 and 7 dpf. C: Myelin thickness in wild-type (N = 13, mean: 0.40 µm, SD: ±0.09) and grm5a-/- grm5b-/- (N = 10, mean: 0.41 µm, SD: ±0.11) animals at 3 dpf (Unpaired t-test: p-value = 0.8754). D: Myelin thickness in wild-type (N = 11, mean: 0.64 µm, SD: ±0.11) and grm5a-/- grm5b-/- (N = 9, mean: 0.71 µm, SD: ±0.07) animals at 7 dpf (Unpaired t-test: p-value = 0.1385). E: Avg. nodal gap per animal in wild-type (N = 13, mean: 1.49 µm, SD: ±0.40) and grm5a-/- grm5b-/- animals (N = 9, mean: 1.80 µm, SD: ±0.41) at 3 dpf (Unpaired t-test: p-value = 0.091). F: Avg. nodal gap per animal in wild-type (N = 6, mean: 1.09 µm, SD: ±0.26) and grm5a-/- grm5b-/- (N = 7, mean: 1.08 µm, SD: ±0.22) animals at 7 dpf (Unpaired t-test: p-value = 0.9618). G: Avg. Myelin sheath length per animal in wild-type (N = 13, mean: 21.71 µm SD: ±4.92) and grm5a-/- grm5b-/- (N = 9, mean: 16.11 µm SD: ±4.40) animals at 3 dpf (Unpaired t-test: p-value = 0.0128). H: Avg. Myelin sheath length per animal in wild-type (N = 13, mean: 24.57 µm, SD: ±3.08) and grm5a-/- grm5b-/- (N = 8 mean:15.81 µm, SD: ±1.64) animals at 7 dpf (Mann–Whitney test: p-value = 0.0002). Source data
Extended Data Fig. 4
Extended Data Fig. 4. mGluR5 can localize to the tips of myelin sheaths.
Subcellular localization of grm5a-eGFP in myelin sheaths (mCherry-CAAX). Arrows indicating grm5a-eGFP along myelin sheaths with aggregates at the growing tips. Scale bar, 10 μm.
Extended Data Fig. 5
Extended Data Fig. 5. The effects of oligodendrocyte-specific expression of grm5a is abrogated by MTEP.
A: Confocal images of individual oligodendrocytes in WT larvae expressing mbp:memScarlet treated with DMSO (N = 11) and MTEP at 4 dpf (N = 9). B: Confocal images of individual oligodendrocytes in WT larvae expressing mbp:memScarlet-P2A-grm5a-eGFP treated with DMSO (N = 10) and MTEP at 4 dpf (N = 11). C: Avg. myelin sheath length in DMSO and MTEP-treated animals expressing mbp:memScarlet or mbp:memScarlet-P2A-grm5a-eGFP (One-Way ANOVA: <0.0001; Tukey’s multiple comparisons test; mbp:memScarlet DMSO vs. mbp:memScarlet MTEP p-value = 0.0163; mbp:memScarlet DMSO vs. mbp:memScarlet-P2A-grm5a-eGFP DMSO p-value = 0.0221; mbp:memScarlet-P2A-grm5a-eGFP DMSO vs. mbp:memScarlet-P2A-grm5a-eGFP MTEP p-value = 0.0351; mbp:memScarlet DMSO; mbp:memScarlet-P2A-grm5a-eGFP MTEP p-value = 0.9974; mbp:memScarlet MTEP vs. mbp:memScarlet-P2A-grm5a-eGFP MTEP p-value = 0.0101; mbp:memScarlet MTEP vs. mbp:memScarlet-P2A-grm5a-eGFP DMSO p-value = <0.0001). DMSO mbp:memScarlet-P2A-grm5a-eGFP mean: 32.46, SD: ±8.232; MTEP mbp:memScarlet-P2A-grm5a-eGFP mean: 24.39 SD: ±6.62, DMSO mbp:memScarlet mean: 23.85 SD: ±6.46; MTEP mbp:memScarlet mean: 14.65, SD: ±3.51). D: Myelin sheath number in DMSO and MTEP-treated animals expressing mbp:memScarlet or mbp:memScarlet-P2A-grm5a-eGFP (One-Way ANOVA p-value = 0.0049; Tukey’s multiple comparisons test; mbp:memScarlet DMSO vs. mbp:memScarlet MTEP p-value = 0.7695; mbp:memScarlet DMSO vs. mbp:memScarlet-P2A-grm5a-eGFP DMSO p-value = 0.2217; mbp:memScarlet-P2A-grm5a-eGFP DMSO vs. mbp:memScarlet-P2A-grm5a-eGFP MTEP p-value = 0.9553; mbp:memScarlet DMSO vs. mbp:memScarlet-P2A-grm5a-eGFP MTEP p-value = 0.0710; mbp:memScarlet MTEP vs. mbp:memScarlet-P2A-grm5a-eGFP MTEP p-value = 0.0092; mbp:memScarlet MTEP vs. mbp:memScarlet-P2A-grm5a-eGFP DMSO p-value = 0.0379). DMSO mbp:memScarlet-P2A-grm5a-eGFP mean: 13.5, SD: ±4.478; MTEP mbp:memScarlet-P2A-grm5a-eGFP mean: 12.27, SD: ±5.99, DMSO mbp:memScarlet mean: 18.18, SD: ±5.78; MTEP mbp:memScarlet mean: 20.56, SD: ±5.41). E: Relative frequency distribution of individual sheath length (n = 504) DMSO mbp:memScarlet-P2A-grm5a-eGFP n = 95, mean: 30.54; MTEP mbp:memScarlet-P2A-grm5a-eGFP n = 108, mean: 20.62; DMSO mbp:memScarlet n = 139, mean:21.7; MTEP mbp:memScarlet n = 162, mean: 13.64). Source data
Extended Data Fig. 6
Extended Data Fig. 6. AQuA2 detects small and large myelin Ca2+ transients that are mGluR5-regulated.
A: Relative frequency distribution of myelin Ca2+ transients of different sizes (1 µm2 bins), after 1 h CHPG and DMSO treatment (DMSO n = 85; CHPG n = 95). B: Frequency of myelin Ca2+ transients after 1 h of CHPG treatment separated by size (less than or greater than 1 µm2) (DMSO N = 17; CHPG N = 17) (One-way Anova p-value = 0.0084; Dunn’s multiple comparisons test; DMSO < 1 µm2 vs. < 1 µm2 CHPG p-value = >0.9999; DMSO < 1 µm2 vs. CHPG < 1 µm2 p-value = 0.5854; DMSO < 1 µm2 vs. > 1 µm2 CHPG p-value = 0.3726; DMSO > 1 µm2 vs. > 1 µm2 CHPG p-value = 0.0384; DMSO < 1 µm2 vs. > 1 µm2 CHPG p-value = 0.0200; CHPG < 1 µm2 vs. > 1 µm2 CHPG p-value = >0.9999). DMSO < 1 µm2 mean: 28.3, SD: ±25.71; DMSO > 1 µm2 mean: 18.69 SD: ±25.11; CHPG < 1 µm2 mean: 66.06, SD: ±73.09; CHPG > 1 µm2 mean: 71.96, SD: ±78.67). C: Avg. Ca2+ transients amplitude comparison of small ( < 1 µm2) Ca2+ transients after 1 h treatment with DMSO (N = 9, mean: 0.82, SD: ±0.21) and CHPG (N = 12, mean: 1.08, SD: ±0.25) (Mann–Whitney test; p-value = 0.0148). D: Comparison of large ( > 1 µm2) Ca2+ transients amplitude after 1 h treatment with DMSO (mean: 0.87, SD: ±0.16) and CHPG (mean: 0.99, SD: ±0.18) (Unpaired t-test; p-value = 0.0853). Source data
Extended Data Fig. 7
Extended Data Fig. 7. CHPG treatment affects myelin Ca2+ transients.
A: Representative time-lapse images with AQuA2-detected transient shown (top) and Fire LUT (bottom) of mbp:mem:GCaMP7s expressing oligodendrocytes treated with DMSO and CHPG after immediate application of compounds (top rows), 1 h (middle rows) and 16 h (bottom rows) after drug application (hpt). Scale bar, 10 µm. B: Avg. dF/F of myelin Ca2+ transients immediately after CHPG application (0 hpt) (DMSO N = 16, mean: 0.87, SD: ±0.17; CHPG N = 19 mean: 0.87, SD: ±0.12) (unpaired t-test: p-value = 0.6774). C: Avg. dF/F of myelin Ca2+ transients 1 h after CHPG application (1 hpt) (DMSO N = 16, mean: 0.82, SD: ±0.23; CHPG N = 19, mean: 1.08, SD: ±0.55) (Mann–Whitney test: p-value = 0.0275). D: Avg. dF/F of myelin Ca2+ transients 16 h after CHPG application (16 hpt) (DMSO N = 15 mean: 0.66, SD: ±0.15; CHPG N = 10 mean: 0.64, SD: ±0.17) (unpaired t-test: p-value = 0.7351). E: Mean of the average dF/F of myelin Ca2+ transients after 0, 1 and 16 hpt after CHPG/DMSO application. F: Frequency of myelin Ca2+ transients per animal immediate after CHPG application (0 hpt) (DMSO N = 23, mean: 63.2 SD: ±86.53; CHPG N = 19, mean: 136, SD: ±85.49) (Mann–Whitney test: p-value = 0.0005). G: Frequency of myelin Ca2+ transients per animal 1 h after CHPG application (1 hpt) (DMSO = 16, mean: 50.15, SD: ±61.26; CHPG N = 19, mean: 133.1, SD: ±133.0) (Mann–Whitney test: p-value = 0.0159). H: Frequency of myelin Ca2+ transients per animal 16 h after CHPG application (16 hpt) (DMSO N = 16, mean: 103.1, SD: ±81.94; CHPG N = 13 mean: 98.40, SD: ±118.1) (Mann–Whitney test: p-value = 0.3980). I: Mean Frequency of myelin Ca2+ transients over treatment, 1 hpt and 16 hpt. Source data
Extended Data Fig. 8
Extended Data Fig. 8. mGluR5 regulates myelin Ca2+ levels and myelin volume.
Whole CNS measurement of mbp:memGCaMP7s fluorescent intensity and myelin volume using computational 3D reconstruction of SDCM images. A: Representative image of a 4 dpf zebrafish expressing mbp:memGCaMP7s in spinal oligodendrocytes and Schwann cells. Scale bar,100 µm. B: Computational reconstruction of the transgenic myelin reporter mbp:memGCaMP7s used to assess myelin Ca2+ baseline activity and myelin volume. C: Reconstruction of 4 dpf CNS myelin in animals treated with DMSO (N = 17), MTEP (N = 28) and CHPG (N = 20). Green reflects myelin along dorsal axons, while yellow labels ventral myelin. D: Doral myelin as volumetric pixel volume (vpx) (One-was ANOVA p-value = <0.0001; Tukey’s multiple Comparisons test: DMSO vs. CHPG p-value = 0.0194; DMSO vs. MTEP p-value = 0.0090; CHPG vs. MTEP p-value = <0.0001) DMSO: mean: 337125, SD: ±51246; MTEP mean: 271853, SD: ±60709; CHPG mean: 400665, SD: ±90675). E: Relative Fluorescent intensity (RFU) in dorsal myelin sheaths of mbp:memGCaMP7s, reflecting baseline myelin Ca2+ activity (One-was ANOVA p-value = <0.0001; Tukey’s multiple Comparisons test: DMSO vs. CHPG p-value = 0.0344; DMSO vs. MTEP p-value = 0.0068; CHPG vs. MTEP p-value = <0.0001; DMSO: mean: 54580775 SD: ±13046833; MTEP mean: 39357143, SD: ±21823431; CHPG mean: 67789985, SD: ±21823431). F: Ventral myelin as volumetric pixel volume (vpx) (One-was ANOVA p-value = <0.0001; Tukey’s multiple Comparisons test: DMSO vs. CHPG p-value = 0.0398; DMSO vs. MTEP p-value = 0.0131; CHPG vs. MTEP p-value = <0.0001). DMSO: mean: 593429, SD: ±146357; MTEP mean: 484280, SD: ±111349; CHPG mean: 694801, SD: ±116964). G: Relative Fluorescent intensity (RFU) in ventral myelin sheaths of mbp:memGCaMP7s, reflecting baseline myelin Ca2+ activity (One-was ANOVA p-value = <0.0001; Tukey’s multiple Comparisons test: DMSO vs. CHPG p-value = 0.0030; DMSO vs. MTEP p-value = 0.1009; CHPG vs. MTEP p-value = <0.0001). DMSO: mean: 198536209, SD: ±66337105; MTEP mean: 156607143, SD: ±50820920; CHPG mean: 273645670, SD: ±84901986). H: Representative reconstruction of wild-type (N = 16) and grm5a-/- grm5b-/- (N = 17) expression of mbp:memGCaMP7s reporting dorsal (green) and Ventral axon myelination (yellow). I: Doral myelin volume in of wild-type and grm5a-/- grm5b-/- animals as volumetric pixel volume (vpx) (Unpaired t-test p-value = 0.0024). J: Relative Fluorescent intensity (RFU) in dorsal myelin sheaths of wild-type (N = 16, mean: 54180897, SD: ±29591313 and grm5a-/- grm5b-/- (N = 17, mean: 28549095, SD: ±13030576) animals expressing mbp:memGCaMP7s, reflecting baseline myelin Ca2+ activity (Unpaired t-test p-value = 0.0027). K: Ventral myelin volume in of wild-type (N = 16, mean: 944652 SD: ±252246) and grm5a-/- grm5b-/- (N = 17, mean: 470384, SD: ±219208) animals as volumetric pixel volume (vpx) (Unpaired t-test p-value = <0.0001). L: Relative Fluorescent intensity (RFU) in ventral myelin sheaths of wild-type (N = 16, mean: 246369587 SD: ±92539193) and grm5a-/- grm5b-/- (N = 17, mean: 88194157 SD: ±54784433 animals expressing mbp:memGCaMP7s, reflecting baseline myelin Ca2+ activity (Mann–Whitney test p-value = <0.0001). Source data
Extended Data Fig. 9
Extended Data Fig. 9. Opto-stimulation of WT and grm5a-/-grm5b-/-chx10 interneurons.
A: Opto-simulation of a WT Tg(chx10:Gal4;UAS:ChRimsonR-tdTomato) animal with a 595 nm fiber optic coupled laser induces a characteristic motor response. B: Opto-simulation of a grm5a-/-grm5b-/- Tg(chx10:Gal4;UAS:ChRimsonR-tdTomato) animal with a 595 nm fiber optic coupled laser also induces a characteristic motor response. C: Images of chx10:Gal4;UAS:axonGCaMP7s in an animal treated with the neuromuscular blocker Mivacurium Chloride and subsequently with the Na+ channel blocker MS222. C’: dF/F trace of axonal GCaMP7s with Mivacurium, with opto-stimulations indicated by red lines. C”: dF/F trace of axonal GCaMP7s with MS222, with opto-stimulations indicated by red lines. D: Opto-stimulation of a WT Tg(chx10:Gal4;UAS:ChRimsonR-tdTomato;UAS:axonGCaMP7s) animal and corresponding time-lapse recording of axonal GCaMP7s signal following two separate stimulation steps (Optostim 1 (yellow) and Optostim2 (orange)) of two distinct ROIs. E: Mean dF/F traces of axonal GCaMP7s following two to three opto-stimulations per fish (N = 6). F: Individual dF/F traces of all axonal GCaMP7s following opto-stimulation of animals noted in E (n = 31). G: Representative image of the double transgene Tg(chx10:Gal4;UAS:ChRimsonR-tdTomato;UAS:axonGCaMP7s). Scale bar, 10 µm. H: Latency between optical stimulation and max. amplitude dF/F of the axonal GCaMP7s signal after the first, second and third stimulation. I. Relative frequency of myelin sheaths exhibiting a myelin Ca2+ transient with and without opto-stimulation. Source data
Extended Data Fig. 10
Extended Data Fig. 10. Characterization of motor responses to long-term (16 h) opto-stimulation.
A: Long-term opto-stimulation of the chx10 pre-motor interneuron circuitry followed by assessment of motor response. The opto-stimulation was carried out identically to the experiments in Fig. 6. Control siblings were kept in a 96-well plate in the dark. After long-term opto-stimulation of chx10:ChRimsonR, the effects of acute activation were tested by assessing the latency between the onset of fiber illumination and initiation of the swimming movement. B: Optical stimulation of a control animal, showing induction of the swimming movement (asterisk). C: Optical stimulation of an animal following 16 h of long-term opto-stimulation, showing induction of swimming movement (asterisk). D: Mean latency between opto-stimulation and motor response in controls and animals that had undergone 16 h of long-term opto-stimulation. E: Latency from the first opto-stimulation to motor response per animal (Control N = 20, mean: 127.5 SD: ±54.86; Opto-stimulated N = 33, mean: 77.27, SD: ±29.71) (Mann–Whitney test; p-value = 0.0003). Source data

References

    1. Almeida, R. G. & Lyons, D. A. On myelinated axon plasticity and neuronal circuit formation and function. J. Neurosci.37, 10023–10034 (2017). - PMC - PubMed
    1. Taylor, K. R. & Monje, M. Neuron–oligodendroglial interactions in health and malignant disease. Nat. Rev. Neurosci.24, 733–746 (2023). - PMC - PubMed
    1. Pajevic, S., Plenz, D., Basser, P. J. & Fields, R. D. Oligodendrocyte-mediated myelin plasticity and its role in neural synchronization. eLife12, e81982 (2023). - PMC - PubMed
    1. Bonetto, G., Belin, D. & Káradóttir, R. T. Myelin: a gatekeeper of activity-dependent circuit plasticity? Science374, eaba6905 (2021). - PubMed
    1. Fields, R. D. A new mechanism of nervous system plasticity: activity-dependent myelination. Nat. Rev. Neurosci.16, 756–767 (2015). - PMC - PubMed

MeSH terms

Substances

LinkOut - more resources