. 2025 May 14;24(1):211.
doi: 10.1186/s12933-025-02734-4.

Dysregulated inflammation, oxidative stress, and protein quality control in diabetic HFpEF: unraveling mechanisms and therapeutic targets

Affiliations

Dysregulated inflammation, oxidative stress, and protein quality control in diabetic HFpEF: unraveling mechanisms and therapeutic targets

Simin Delalat et al. Cardiovasc Diabetol. .

Abstract

Background: Type 2 diabetes mellitus (T2DM) represents a significant risk factor for cardiovascular disease, particularly heart failure with preserved ejection fraction (HFpEF). HFpEF predominantly affects elderly individuals and women, and is characterized by dysfunctions associated with metabolic, inflammatory, and oxidative stress pathways. Despite HFpEF being the most prevalent heart failure phenotype in patients with T2DM, its underlying pathophysiological mechanisms remain inadequately elucidated.

Objective: This study aims to investigate the effects of diabetes mellitus on myocardial inflammation, oxidative stress, and protein quality control (PQC) mechanisms in HFpEF, with particular emphasis on insulin signaling, autophagy, and chaperone-mediated stress responses.

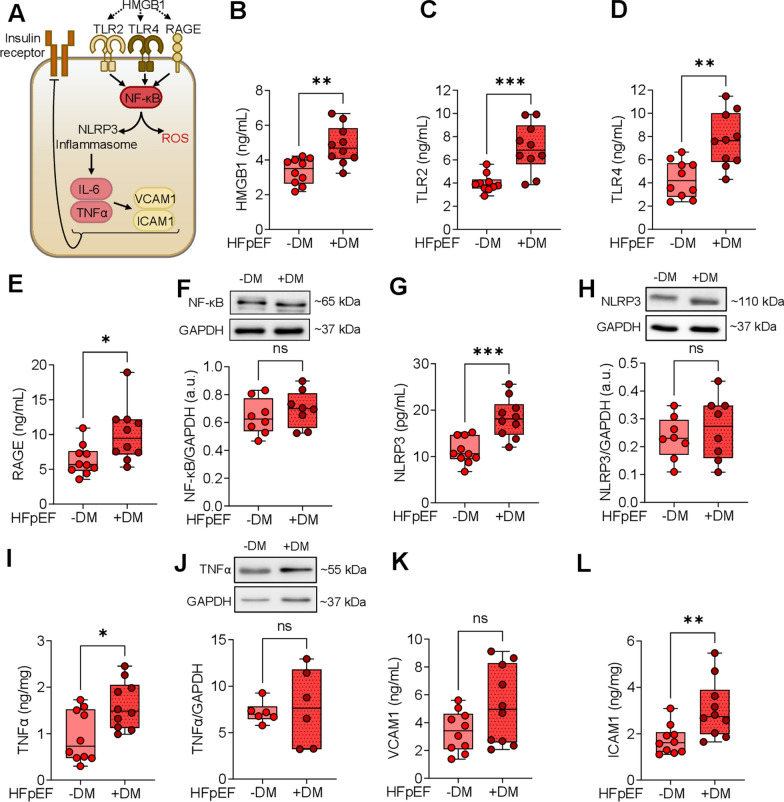
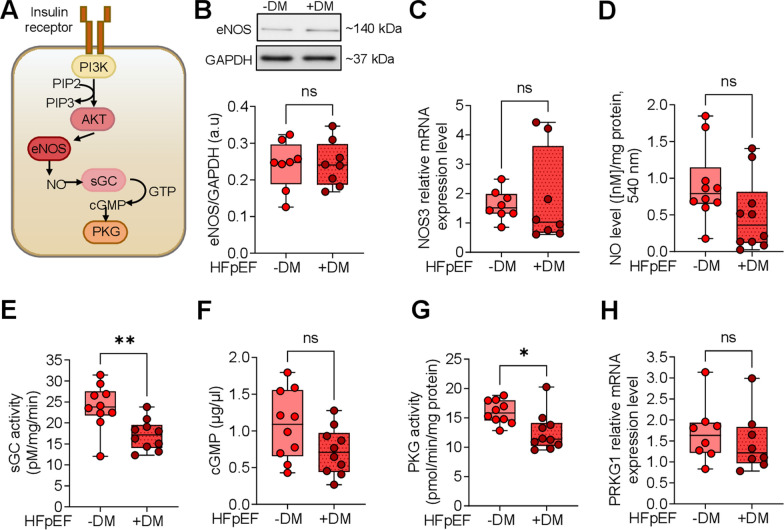
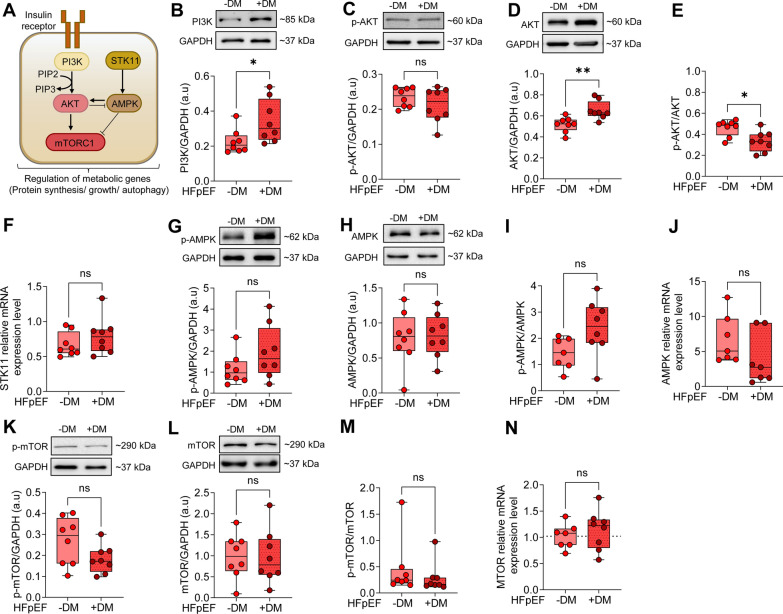
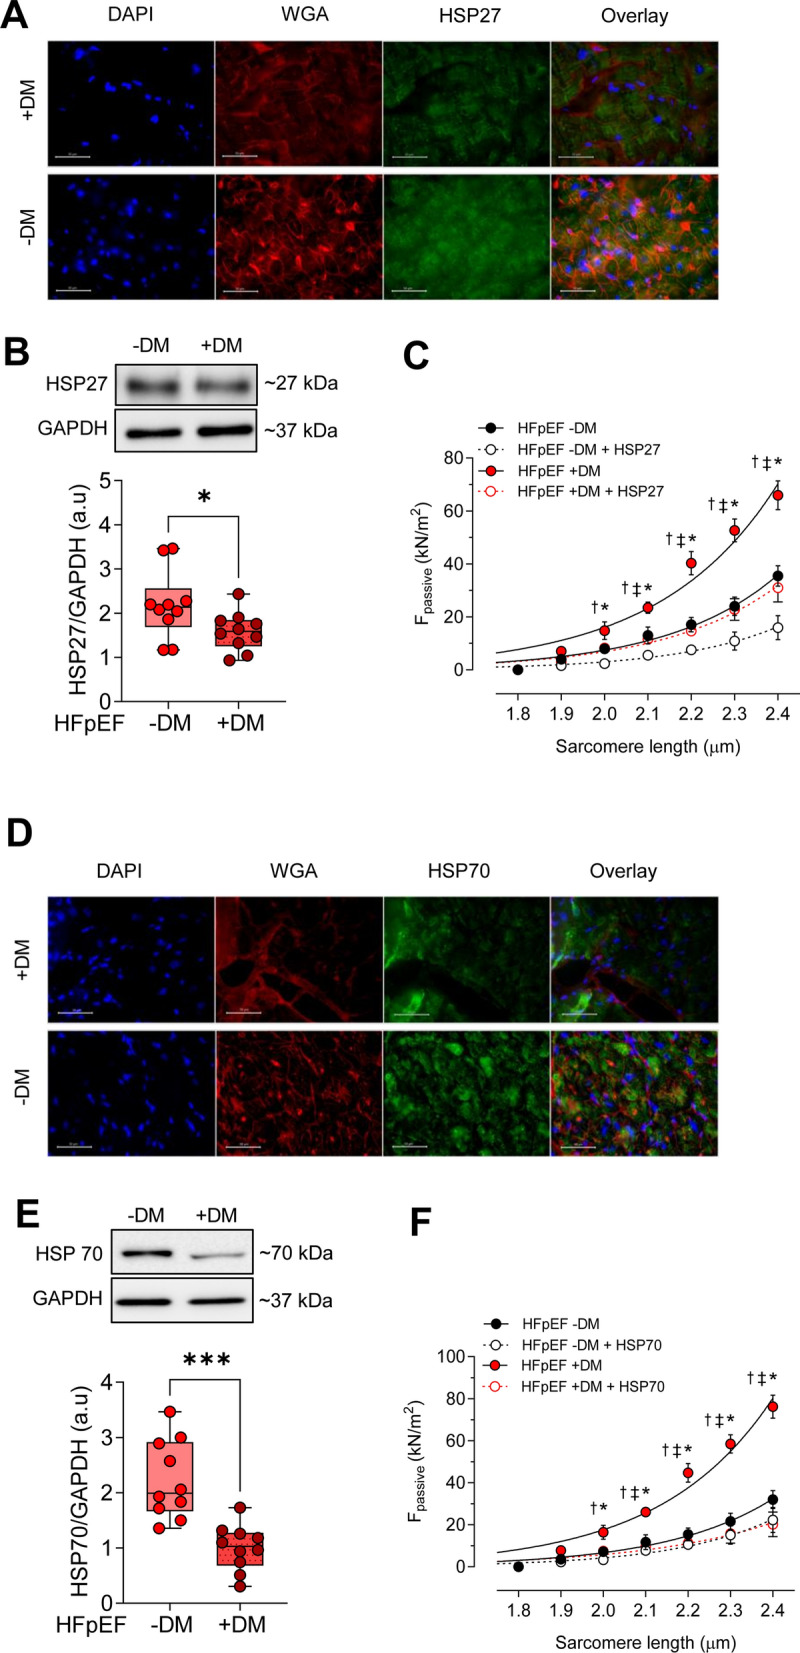
Methods: We conducted an analysis of left ventricular myocardial tissue from HFpEF patients, both with and without diabetes, employing a range of molecular, biochemical, and functional assays. The passive stiffness of cardiomyocytes (Fpassive) was assessed in demembranated cardiomyocytes before and after implementing treatments aimed at reducing inflammation (IL-6 inhibition), oxidative stress (Mito-TEMPO), and enhancing PQC (HSP27, HSP70). Inflammatory markers (NF-κB, IL-6, TNF-α, ICAM-1, VCAM-1, NLRP3), oxidative stress markers (ROS, GSH/GSSG ratio, lipid peroxidation), and components of signaling pathways (PI3K/AKT/mTOR, AMPK, MAPK, and PKG) were evaluated using western blotting, immunofluorescence, and ELISA techniques.

Results: Hearts from diabetic HFpEF patients exhibited significantly heightened inflammation, characterized by the upregulation of NF-κB, IL-6, and the NLRP3 inflammasome. This increase in inflammation was accompanied by elevated oxidative stress, diminished nitric oxide (NO) bioavailability, and impaired activation of the NO-sGC-cGMP-PKG signaling pathway. Notably, dysregulation of insulin signaling was observed, as indicated by decreased AKT phosphorylation and impaired autophagy regulation mediated by AMPK and mTOR. Additionally, PQC dysfunction was evidenced by reduced expression levels of HSP27 and HSP70, which correlated with increased cardiomyocyte passive stiffness. Targeted therapeutic interventions effectively reduced Fpassive, with IL-6 inhibition, Mito-TEMPO, and HSP administration leading to improvements in cardiomyocyte mechanical properties.

Conclusion: The findings of this study elucidate a mechanistic relationship among diabetes, inflammation, oxidative stress, and PQC impairment in the context of HFpEF. Therapeutic strategies that target these dysregulated pathways, including IL-6 inhibition, mitochondrial antioxidants, and chaperone-mediated protection, may enhance myocardial function in HFpEF patients with T2DM. Addressing these molecular dysfunctions could facilitate the development of novel interventions specifically tailored to the diabetic HFpEF population.

Keywords: Autophagy; Cardiomyocyte stiffness; Heart failure with preserved ejection fraction; Heat shock proteins; Inflammation; Insulin resistance; Oxidative stress; Protein quality control; Type 2 diabetes.


Conflict of interest statement

Declarations. Ethics approval and consent to participate: All samples were obtained with informed consent and approval from the local Ethics Committee. All procedures were performed according to the Declaration of Helsinki and were approved by the local ethics committee. Biopsies were obtained for the primary purpose of diagnosis following Ethics Committee approval numbers WO18.026, 20-6976 BR, 20-6976-1- BR and informed consent. Consent for publication: Not applicable. Competing interests: The authors declare no competing interests.

Figures

Fig. 1
Fig. 1
Signaling Pathways of Inflammation in Left Ventricular Biopsies from Patients with HFpEF, with (+ DM) and without Concomitant Diabetes (-DM). A Schematic representation of intracellular inflammatory signaling pathways. HMGB1: high mobility group box protein 1; ICAM1: intercellular adhesion molecule; IL-6: interleukin 6; NF-κB: nuclear factor kappa B; NLRP3: NOS-like receptor protein 3; RAGE: receptor for advanced glycation end products; ROS: reactive oxygen species; TLR: Toll-like receptor; TNFα: tumour necrosis factor α; VCAM1: vascular cell adhesion protein. B HMGB1 levels. C. TLR2 levels. D TLR4 levels. E RAGE levels. F. NF-κB expression over GAPDH. G NLRP3 levels. H NLRP3 expression over GPADH. I TNFα levels. J TNFα expression over GAPDH. K VCAM1 levels. L ICAM1 levels. Data are represented as box and whisker plots (median, 25th to 75th percentiles, minimum, and maximum (n = 6–10 samples/group). P-values are derived from an unpaired t-test; * P < 0.05, ** P < 0.01, *** P < 0.001
Fig. 2
Fig. 2
Inflammatory Markers in Left Ventricular Biopsies from Patients with HFpEF, with (+ DM) and without Concomitant Diabetes (−DM). A Interleukin-6 (IL-6) levels. B IL-6 expression over GAPDH. C Immunoflourescence staining of IL-6. DAPI staining (blue) and WGA (anti-wheat agglutinine 555 conjugate, red) staining are used for nucleic acids and membranes. D Fpassive at sarcomere length 1.8–2.4 µm in the presence or absence of IL-6 inhibitor. Curves are second-order polynomial fits to the means (± SEM; n = 30–36/5 cardiomyocytes/heart per group), * P < 0.05 HFpEF -DM vs. HFpEF + DM, P < 0.05 HFpEF -DM vs. HFpEF -DM after IL-6inh, † P < 0.05 HFpEF + DM vs. HFpEF + DM after IL-6inh treatment by one-way ANOVA. P-values were corrected for multiple comparisons by the Tukey method. E IL-6 receptor (IL6-R) expression over GAPDH. F Immunoflourescence staining of IL6-R. G Immunoflourescence staining of myeloperoxidase (MPO). H Immunoflourescence staining of neutrophil elastase (NE). Panels A + B + E. Data are represented as box and whisker plots (median, 25th to 75th percentiles, minimum, and maximum (n = 6–10 samples/group). P-values are derived from an unpaired t-test
Fig. 3
Fig. 3
Protein kinase G Signaling Pathway in Inflammation in Left Ventricular Biopsies from Patients with HFpEF, with (+ DM) and without Concomitant Diabetes (-DM). A Schematic representation of the PKG signaling pathway. AKT: AKT serine/threonine kinase; cGMP: cyclic guanosine monophosphate; eNOS, endothelial nitric oxide synthase; GTP: guanosine triphosphate; NO: nitric oxide; PI3K: phosphatidylinositol-3-kinase; PIP2: phosphatidylinositol-4,5-bisphosphate; PIP3: phosphatidylinositol-3,4,5-trisphosphate; PKG: protein kinase G; sGC: soluble guanylyl cyclase. B Expression of eNOS over GAPDH. C NOS3 mRNA level. D NO level. E Activity of sGC. F Myocardial cGMP level. G PKG activity. H PRKG1 mRNA level. Data are represented as box and whisker plots (median, 25th to 75th percentiles, minimum, and maximum (n = 8–10 samples/group). P-values are derived from an unpaired t-test; * P < 0.05, ** P < 0.01
Fig. 4
Fig. 4
Oxidative Stress Markers in Inflammation in Left Ventricular Biopsies from Patients with HFpEF, with (+ DM) and without Concomitant Diabetes (-DM). A 3-Nitrotyrosine levels. B Ratio of myocardial oxidized glutathione (GSSG) over reduced glutathione (GSH). C Myocardial hydrogen peroxide (H2O2) levels. D Myocardial lipid oxidation (LPO) levels. Data are represented as box and whisker plots (median, 25th to 75th percentiles, minimum, and maximum (n = 10 samples/group). P-values are derived from an unpaired t-test; * P < 0.05, ** P < 0.01. E Fpassive at sarcomere length 1.8–2.4 µm in the presence or absence of Mito-TEMPO. Curves are second-order polynomial fits to the means (± SEM; n = 30–36/5 cardiomyocytes/heart per group), * P < 0.05 HFpEF -DM vs. HFpEF + DM, P < 0.05 HFpEF -DM vs. HFpEF -DM after Mito-TEMPO, † P < 0.05 HFpEF + DM vs. HFpEF + DM after Mito-TEMPO treatment by one-way ANOVA. P-values were corrected for multiple comparisons by the Tukey method
Fig. 5
Fig. 5
The PI3K/AKT/AMPK/mTOR Signaling Pathway Left Ventricular Biopsies from Patients with HFpEF, with (+ DM) and without Concomitant Diabetes (-DM). A Schematic representation of the PI3K/AKT/AMPK/mTOR signaling pathway. AMPK: AMP-activated protein kinase; AKT: AKT serine/threonine kinase; mTORC1: mammalian target of rapamycin complex 1; PI3K: phosphatidylinositol-3-kinase; PIP2: phosphatidylinositol-4,5-bisphosphate; PIP3: phosphatidylinositol-3,4,5-trisphosphate; STK11: serine/threonine kinase 11. B Expression of PI3K over GAPDH. C Phosphorylation of AKT over GAPDH. D Expression of AKT over GAPDH. E Ratio of phosphorylated over total AKT. F STK11 mRNA level. G Phosphorylation of AMPK over GAPDH. H Expression of AMPK over GAPDH. I. Ratio of phosphorylated over total AMPK. J. AMPK mRNA level. K Phosphorylation of mTOR over GAPDH. L. Expression of mTOR over GAPDH. M Ratio of phosphorylated over total mTOR. N mTOR mRNA level. Data are represented as box and whisker plots (median, 25th to 75th percentiles, minimum, and maximum (n = 7–10 samples/group). P-values are derived from an unpaired t-test; * P < 0.05, ** P < 0.01
Fig. 6
Fig. 6
MAPKs and GSK3β in Left Ventricular Biopsies from Patients with HFpEF, with (+ DM) and without Concomitant Diabetes (-DM). A Schematic representation of the PI3K/AKT/ERK signaling pathway. AKT: AKT serine/threonine kinase; ERK1/2: extracellular-signal regulated kinases; GSK-3: glycogen synthase kinase 3; MEK: mitogen-activated protein kinase; PI3K: phosphatidylinositol-3-kinase; PIP2: phosphatidylinositol-4,5-bisphosphate; PIP3: phosphatidylinositol-3,4,5-trisphosphate; B Expression of GSK3β over GAPDH. C Expression of MAPK p38 over GAPDH. D Expression of ERK2 over GAPDH. E MAPK1 mRNA level. F MAPK3 mRNA level. Data are represented as box and whisker plots (median, 25th to 75th percentiles, minimum, and maximum (n = 6–10 samples/group). P-values are derived from an unpaired t-test; ** P < 0.01
Fig. 7
Fig. 7
Heat-Shock Proteins (HSPs) and Cardiomyocyte Passive Stiffness in Left Ventricular Biopsies from Patients with HFpEF, with (+ DM) and without Concomitant Diabetes (-DM). A Immunoflourescence staining of HSP27. DAPI staining (blue) and WGA (anti-wheat agglutinine 555 conjugate, red) staining are used for nucleic acids and membranes. B Expression of HSP27 over GAPDH. C Fpassive at sarcomere length 1.8–2.4 µm in the presence or absence of HSP27. D Immunoflourescence staining of HSP70. E. Expression of HSP70 over GAPDH. F. Fpassive at sarcomere length 1.8–2.4 µm in the presence or absence of HSP70. Panels B + E: Data are represented as box and whisker plots (median, 25th to 75th percentiles, minimum, and maximum (n = 6–10 samples/group). P-values are derived from an unpaired t-test; * P < 0.05, *** P < 0.001. Panels C + F: Curves are second-order polynomial fits to the means (± SEM; n = 30–36/5 cardiomyocytes/heart per group). * P < 0.05 HFpEF -DM vs. HFpEF + DM, P < 0.05 0.05 HFpEF -DM vs. HFpEF -DM after HSP27 or HSP70 treatment, † P < 0.05 HFpEF + DM vs. HFpEF + DM after HSP27 or HSP70 treatment by one-way ANOVA. P-values were corrected for multiple comparisons by the Tukey method

References

    1. Ren J, Pulakat L, Whaley-Connell A, Sowers JR. Mitochondrial biogenesis in the metabolic syndrome and cardiovascular disease. J Mol Med. 2010;88(10):993–1001. 10.1007/s00109-010-0663-9. - PMC - PubMed
    1. Sasso FC, et al. Role of tight glycemic control during acute coronary syndrome on CV outcome in type 2 diabetes. J Diabetes Res. 2018;2018:1–8. 10.1155/2018/3106056. - PMC - PubMed
    1. IDF Diabetes Atlas, 9th edn. Federation ID, editor. Brussels: International Diabetes Federation (2019). 2019.
    1. Jia G, Hill MA, Sowers JR. Diabetic cardiomyopathy. Circ Res. 2018;122(4):624–38. 10.1161/CIRCRESAHA.117.311586. - PMC - PubMed
    1. Jankauskas SS, et al. Heart failure in diabetes. Metabolism. 2021;125:154910. 10.1016/j.metabol.2021.154910. - PMC - PubMed

MeSH terms