

A novel tri-mode detection platform for ampicillin and drug resistance genes by CRISPR-driven luminescent nanozymes
- PMID: 40369543
- PMCID: PMC12076998
- DOI: 10.1186/s12951-025-03454-3
A novel tri-mode detection platform for ampicillin and drug resistance genes by CRISPR-driven luminescent nanozymes
Abstract
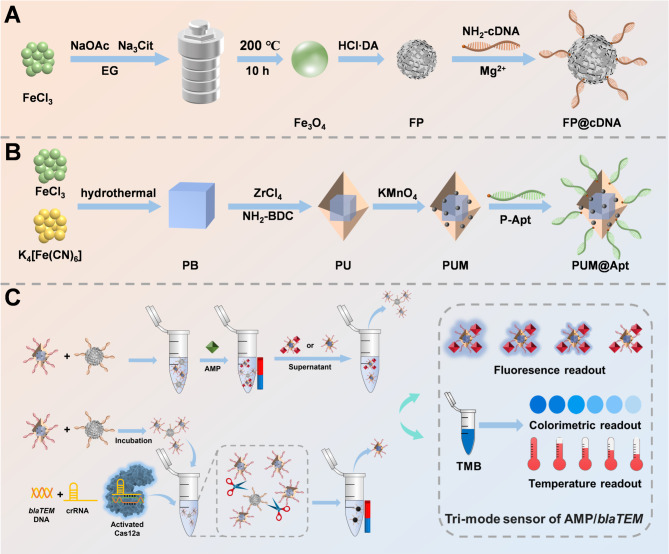
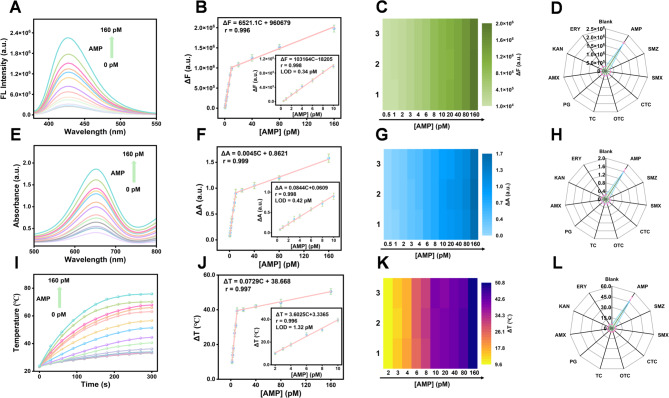
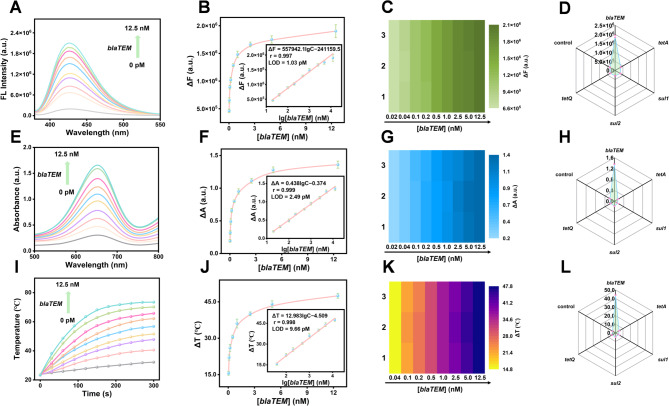
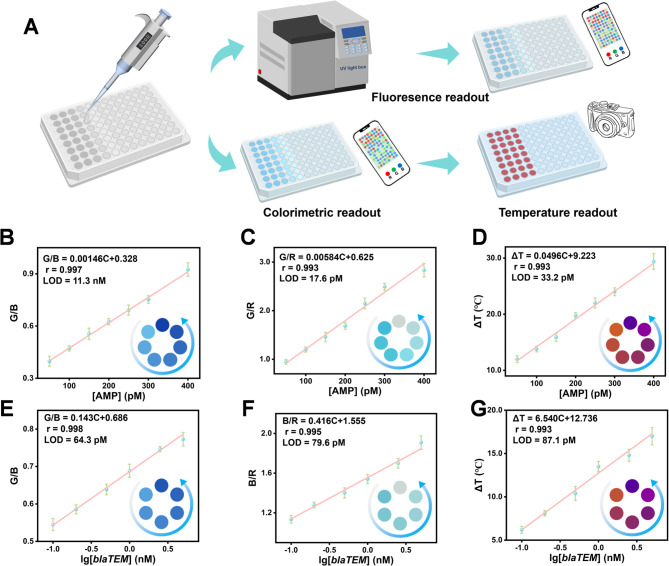
The antibiotic residues pose significant risks for bacterial resistance. To address the practical requirements for rapid, accurate, and on-site detection of antibiotic residues and monitoring the abundance of associated resistance genes, we report a smartphone-integrated multi-mode platform. The platform is aimed to simultaneous, accurate, and visual quantitative detection of ampicillin (AMP) and β-lactam antibiotic resistance genes (blaTEM). Specifically, we developed a magnetically controlled fluorescence, colorimetric, and photothermal biosensor based on a magnetic separation unit (aminated modified complementary DNA chain (NH2-cDNA) loading on the surface of Ferrosoferric Oxide@polydopamine (Fe3O4@PDA, FP), FP@cDNA) and a signal unit (the aptamer nucleic acid chain modified by phosphate group linked to Prussian blue@UiO-66@manganese dioxide (PB@UiO-66@MnO2, PUM) through Zr-O-P bond, PUM@Apt), for the integrated detection of AMP and blaTEM. By utilizing complementary base pairing between FP@cDNA and PUM@Apt, along with precise aptamer recognition the AMP, we achieved the fluorescence quantitative detection of AMP by measuring the signal unit in the supernatant. Subsequently, the difference of signal units in colorimetric process leads to a varying conversion rate of oxidized 3,3',5,5'-Tetramethylbenzidine (oxTMB), enabling the output of colorimetric and photothermal signals. The competitive binding of aptamers permitting the determination of AMP in the range of 0-160 pM with a low detection limit (0.34 pM). Additionally, in the presence of blaTEM, the activated CRISPR/Cas12a indiscriminately cleaves the single-stranded portion of the FP@DNA@PUM complex obtained by magnetic separation. A PUM-based three-signal detection scheme was established for the sensitive determination of blaTEM with the limit of detection (LOD) of 1.03 pM. The integration of smartphone-assisted analysis broadens the potential of the platform for visual detection. Notably, the innovative platform, with its excellent stability, exhibits great potential as a simple yet robust approach for the simultaneously visually monitoring antibiotics and drug resistance genes, and holds promise in the field of kit development.
Keywords: BlaTEM; Ampicillin; Aptamer; CRISPR/Cas12a; Tri-mode detection; Visual detection.
© 2025. The Author(s).
Conflict of interest statement
Declarations. Ethical approval: Ethics is not applicable for this work. This work does not involve human and animal ethics. Consent for publication: All authors of this work participated in and completed the work, have read the manuscript and have agreed to publish it. Competing interests: The authors declare no competing interests.
Figures
References
-
- Nag P, Sadani K, Mohapatra S, Mukherji S, Mukherji S. Evanescent wave optical Fiber sensors using enzymatic hydrolysis on nanostructured polyaniline for detection of β-Lactam antibiotics in food and environment. Anal Chem. 2021;93:2299–308. - PubMed
-
- Behere MJ, Shinde AH, Haldar S. Determination of antibiotic resistance profile of bacterial community from environmental water using antibiotic-resistant bacterial contamination detection (ABCD) kit. Biosens Bioelectron. 2023;221:114943. - PubMed
-
- Chen Y, Yang J, Zeng L, Zhu M. Recent progress on the removal of antibiotic pollutants using photocatalytic oxidation process. Crit Rev Environ Sci Technol. 2022;52:1401–48.
-
- Zainab SM, Junaid M, Xu N, Malik RN. Antibiotics and antibiotic resistant genes (ARGs) in groundwater: A global review on dissemination, sources, interactions, environmental and human health risks. Water Res. 2020;187:116455. - PubMed
-
- De La Fuente-Nunez C, Cesaro A, Hancock REW. Antibiotic failure: beyond antimicrobial resistance. Drug Resist Updates. 2023;71:101012. - PubMed
MeSH terms
Substances
Grants and funding
LinkOut - more resources
Full Text Sources
Medical
Research Materials
Miscellaneous
