. 2025 May 14;23(1):186.
doi: 10.1186/s12957-025-03829-8.

Prognostic value of circadian rhythm-associated genes in breast cancer

Affiliations

Prognostic value of circadian rhythm-associated genes in breast cancer

Ling Wang et al. World J Surg Oncol. .

Abstract

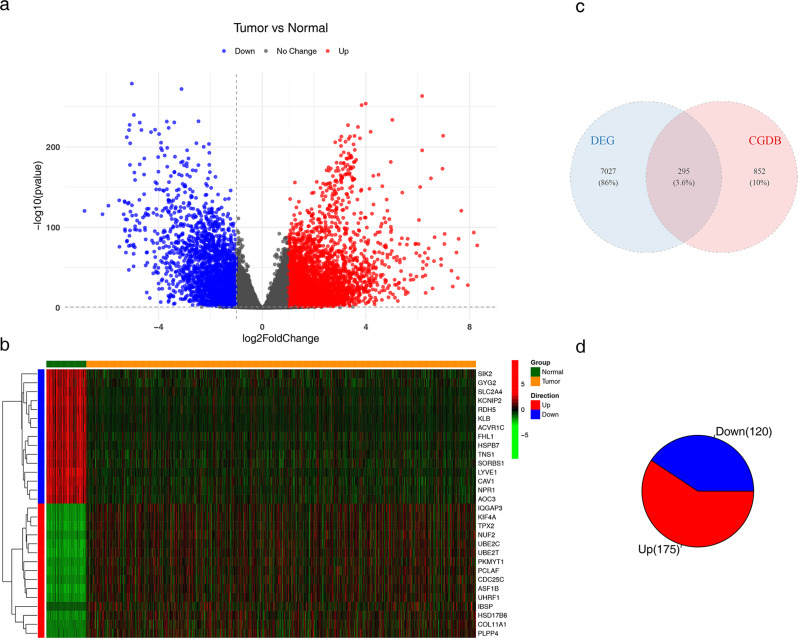
Objective: Breast cancer (BC) remains the most prevalent malignancy among women. Clinical evidence indicates that genetic variations related to circadian rhythms, as well as the timing of therapeutic interventions, influence the response to radiation therapy and the toxicity of pharmacological treatments in women with BC. This study aimed to identify key circadian rhythm-related genes (CRGs) using bioinformatics and machine learning, and construct a prognostic model to predict clinical outcomes.

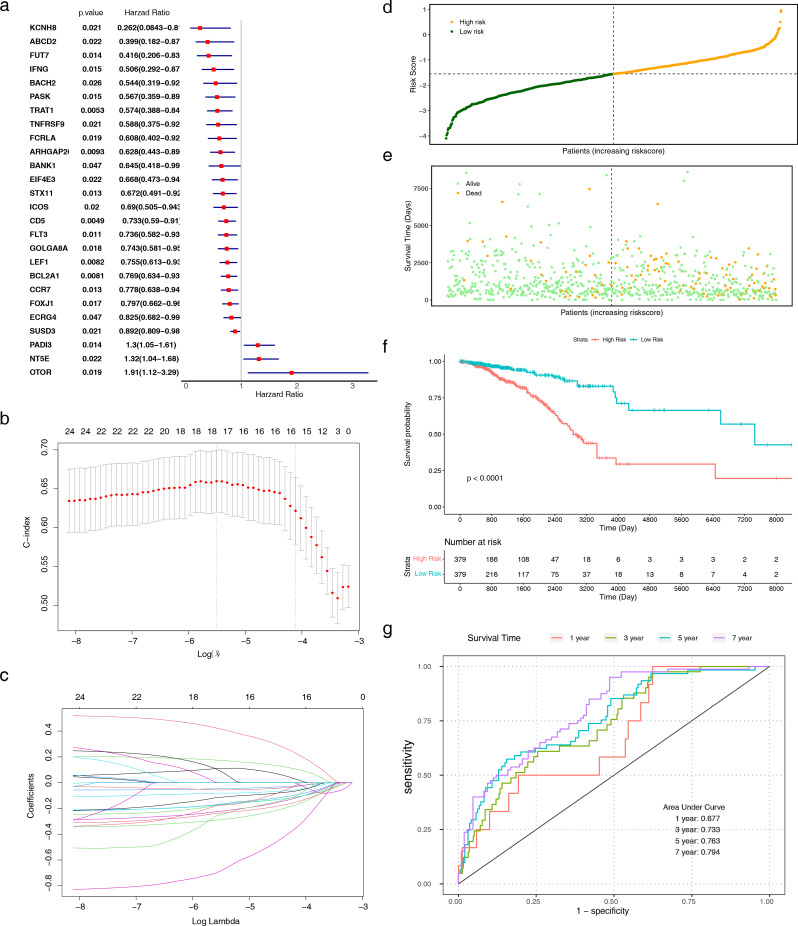
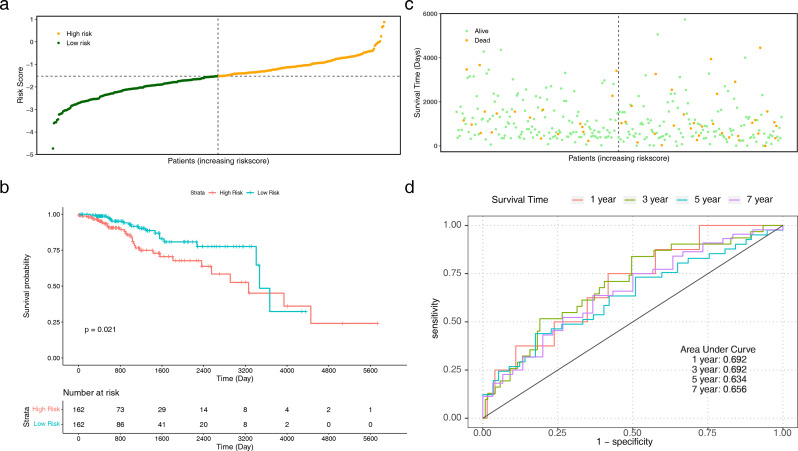
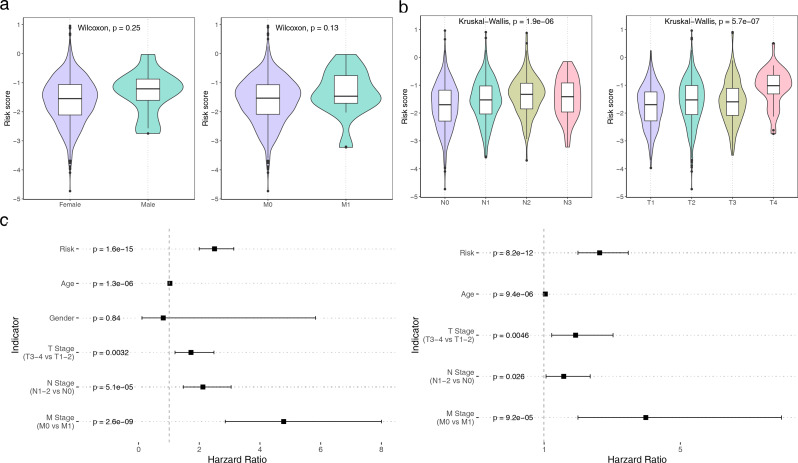
Methods: Transcriptome data for BC were retrieved from The Cancer Genome Atlas database. Univariate Cox regression and least absolute shrinkage and selection operator regression analyses were used to develop a prognostic model based on CRGs. The predictive performance of the risk score model was evaluated. Univariate and multivariate Cox regression analyses were applied to construct the prognostic model and stratify patients into high-risk and low-risk groups. Additionally, differences in immune microenvironment, immunotherapy efficacy, and tumor mutation burden were assessed between risk groups.

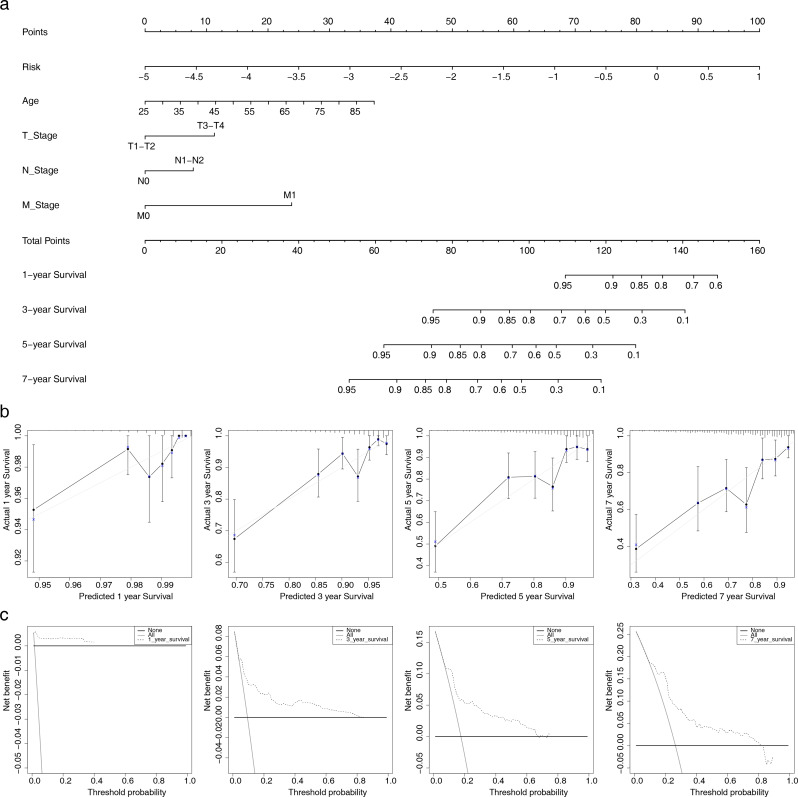
Results: A prognostic risk score model comprising 17 CRGs was developed. The areas under the receiver operating characteristic curve for overall survival at 1, 3, 5, and 7 years exceeded 0.6, indicating acceptable predictive performance. Calibration plots and decision curve analyses demonstrated the use of the model in prognostic prediction. Significant differences in immune microenvironment, immunotherapy efficacy, and tumor mutation burden were identified between the low-risk and high-risk groups.

Conclusion: The circadian rhythm-based gene model, effectively predicted the prognosis of individuals with BC, highlighting its potential to inform personalized therapeutic strategies and improve patient outcomes.

Keywords: Bioinformatic analysis; Breast cancer; Immune microenvironment; Prognosis; TMB.


Conflict of interest statement

Declarations. Ethics approval and consent to participate: This study was conducted with approval from the Ethics Committee of Dongzhimen Hospital, Beijing University of Chinese Medicine. This study was conducted in accordance with the declaration of Helsinki. Consent for publication: Not applicable. Competing interests: The authors declare no competing interests.

Figures

Fig. 1
Fig. 1
Differential expression analysis. (a) A volcano plot depicting 7,322 DEGs in BC samples compared with normal samples. (b) A heatmap showing the expression levels of the top 12 upregulated and downregulated DEGs in BC samples. (c) A Venn diagram illustrating the overlap between DEGs and circadian rhythm-related genes, identifying DECRGs. (D) A bar chart depicting the upregulated and downregulated DECRGs in BC samples. Abbreviations: BC: breast cancer; DEGs: differentially expressed genes; DECRGs: differentially expressed circadian rhythm-related genes
Fig. 2
Fig. 2
The functional enrichment and PPI network construction of candidate genes. (a) Bubble plot representing the top 10 enriched GO terms for the DECRGs. (b) Bubble plot revealing the top 7 KEGG pathways enriched in DECRGs. (c) PPI network constructed for the DECRGs. Abbreviations: GO: Gene Ontology; KEGG: Kyoto Encyclopedia of Genes and Genomes; PPI: protein–protein interaction; DECRGs: differentially expressed circadian rhythm-related genes
Fig. 3
Fig. 3
The construction and evaluation of the risk model in the training set. (a) Univariate Cox regression analysis of 26 DECRGs to identify prognostic genes. (b) The error plot of LASSO cross-validation. The dashed line on the left represents lambda.min, which is the position of the minimum cross-validation error, and the number of feature genes is shown above it. The dashed line on the right represents the line with fewer features. (c) The LASSO coefficient path plot. The lines in different colors correspond to different genes and their coefficients; as lambda increases, the coefficients of the feature variables approach zero, which is the optimal condition for selecting the target genes. (d-e) Risk score distribution and associated survival status of samples in the training set. (f) KM survival curve comparing overall survival between the high-risk and low-risk groups. (g) ROC curve evaluating the predictive performance of the prognostic model in the training set. Abbreviations: DECRGs: differentially expressed circadian rhythm-related genes; LASSO: least absolute shrinkage and selection operator; KM: Kaplan–Meier; ROC: receiver-operating characteristic
Fig. 4
Fig. 4
The evaluation of the risk model in the validation set. (a-b) Risk score distribution and associated survival status of samples in the testing set. (c) KM survival curve showing significant survival differences between high-risk and low-risk groups. (d) ROC curve assessing the prognostic accuracy of the model in the testing set. Abbreviations: KM: Kaplan Meier; ROC: receiver-operating characteristic
Fig. 5
Fig. 5
GSVA between the high- and low-risk groups. (a) Top five pathways enriched in BP terms between the high- and low-risk groups. (b) Top five pathways enriched in CC terms. (c) Top five pathways enriched in MF terms. (d) KEGG pathways enriched in the high- and low-risk groups, highlighting distinct biological mechanisms in each group. Abbreviations: GSVA: gene set variation analysis; BP: biological process; CC: cellular component; MF: molecular function; KEGG: Kyoto Encyclopedia of Genes and Genomes
Fig. 6
Fig. 6
The immune microenvironment analysis of the high-risk and low-risk groups was conducted. (a) Correlation between immune and stromal scores with the risk scores, highlighting associations between the tumor microenvironment and prognostic risk. (b-c) Abundance levels of 22 immune cell types in samples from the high-risk and low-risk groups, illustrating variations in immune cell infiltration. (d) Relationships among the 22 immune cell types, showing their interactions and relevance within the tumor microenvironment. (e) Differential analysis identifying 14 immune cell types that significantly vary between the high-risk and low-risk groups
Fig. 7
Fig. 7
Differences in response to immunotherapy between the high- and low-risk groups: (a) Expression levels of the top 15 immune checkpoint genes in the two risk score groups. (b) Expression levels of the top 15 HLA family genes in the two risk score groups. (c) Correlation between the TIDE dysfunction score and the risk score. (d) Correlation between the TIDE exclusion score and the risk score. (e) Drugs exhibiting differential sensitivity between the high-risk and low-risk groups. (f) Differences in the IPS between the high-risk and low-risk groups, reflecting varying responses to immunotherapy. Abbreviations: HLA: human leukocyte antigen; TIDE: tumor immune dysfunction and exclusion; IPS: immunophenoscore
Fig. 8
Fig. 8
Analysis of tumor mutation status in the high- and low-risk groups (a) Waterfall plot displaying the mutation landscape of genes in the BC samples. (b-c) Waterfall plots of mutated genes in the high-risk and low-risk groups, respectively. (d) Comparison of TMB between the high-risk and low-risk groups. (e) Mutation frequency comparison for 19 genes between the two risk score groups. (f) Mutation analysis of the 17 signature genes in breast cancer samples, identifying key genetic changes. Abbreviations: BC: breast cancer; TMB: tumor mutational burden
Fig. 9
Fig. 9
Independent prognostic analysis of clinical information. (a) The correlation analysis between the risk score and clinical information. (b-c) Identification of significant predictive factors through univariate and multivariate Cox regression analyses. These factors were selected based on their association with prognosis in breast cancer patients
Fig. 10
Fig. 10
Development and validation of a nomogram. (a) Construction of a nomogram that integrates the identified predictive factors to estimate 1-, 3-, 5-, and 7-year survival probabilities for BC patients. (b) Calibration curve demonstrating the concordance between the nomogram-predicted survival probabilities and actual outcomes, indicating the accuracy of the model. (c) DCA evaluating the clinical utility of the nomogram by assessing the net benefit across different threshold probabilities
Fig. 11
Fig. 11
Validation of the Expression of Circadian Rhythm-Related Genes in BC Cell Lines and Tissues: (a) qRT-PCR Analysis: Expression levels of BACH2, KCNH8, and ARHGAP25 in various cell lines, highlighting differential expression in BC cell lines compared to normal breast cell lines. (b) Western Blotting Results: Protein expression levels of GRAF, LY6G5C, and BACH2 in BC tissues compared to normal tissues, demonstrating significant differences in expression. (c) Immunohistochemistry Results: Visualization of GRAF, LY6G5C, and BACH2 expression in BC and normal tissues, providing further validation of their differential expression. BC: breast cancer

Similar articles

References

    1. Fahad Ullah MB. Cancer: current perspectives on the disease status. Adv Exp Med Biol. 2019;1152:51–64. - PubMed
    1. Zhou Y, et al. Tumor biomarkers for diagnosis, prognosis and targeted therapy. Signal Transduct Target Ther. 2024;9(1):132. - PMC - PubMed
    1. Zhang ZY, et al. Machine learning applications in breast cancer survival and therapeutic outcome prediction based on multi-omic analysis. Yi Chuan. 2024;46(10):820–32. - PubMed
    1. Ye F, et al. Advancements in clinical aspects of targeted therapy and immunotherapy in breast cancer. Mol Cancer. 2023;22(1):105. - PMC - PubMed
    1. Klerman EB, Brager A, Carskadon MA, et al. Keeping an eye on circadian time in clinical research and medicine. Clin Transl Med. 2022;12(12):e1131. - PMC - PubMed

Substances

LinkOut - more resources