

Atherogenic lipid parameters in people with normal glucose tolerance: implications from elevated 1-hour post-load plasma glucose
- PMID: 40369580
- PMCID: PMC12079842
- DOI: 10.1186/s12933-025-02722-8
Atherogenic lipid parameters in people with normal glucose tolerance: implications from elevated 1-hour post-load plasma glucose
Abstract
Background: Existing evidence suggests that elevated 1-hour post-load plasma glucose (1-h PG ≥ 8.6 mmol/L) during an oral glucose tolerance test (OGTT) is associated with atherogenic lipid parameters which are linked to an increased risk of cardiovascular disease (CVD). However, it remains unclear whether normal glucose tolerance (NGT) individuals with elevated 1-h PG (NGT-1hPG-high) should still be considered low-risk. Therefore, this study aims to demonstrate comprehensive lipid characteristics in individuals with different glycemic status stratified by 1-h PG, with a particular focus on those with NGT-1hPG-high.
Methods: This cross-sectional study included individuals aged 25-55 years with high-risk of diabetes from the Daqing Diabetes Prevention Study II (Daqing DPS-II). Individuals were categorized into different glycemic status based on the World Health Organization's 1999 criteria and the International Diabetes Federation's 2024 position statement on 1-h PG. Traditional (TC, TG, HDL-C, LDL-C) and non-traditional lipid parameters [ApoA-1, ApoB, sdLDL-C, Lp(a), non-HDL-C, remnant cholesterol (RC), ApoB/ApoA-1, LDL-C/ApoB] were measured. Dyslipidemia was defined according to the 2023 Chinese Guidelines for Lipid Management. The China-PAR equation was used to estimate 10-year CVD risk. Spearman's correlation coefficients were calculated to evaluate the correlation between lipid parameters and 10-year CVD risk. Logistic and multiple linear regression models were performed to assess the association between 1-h PG and dyslipidemia as well as lipid parameters adjusting for covariates.
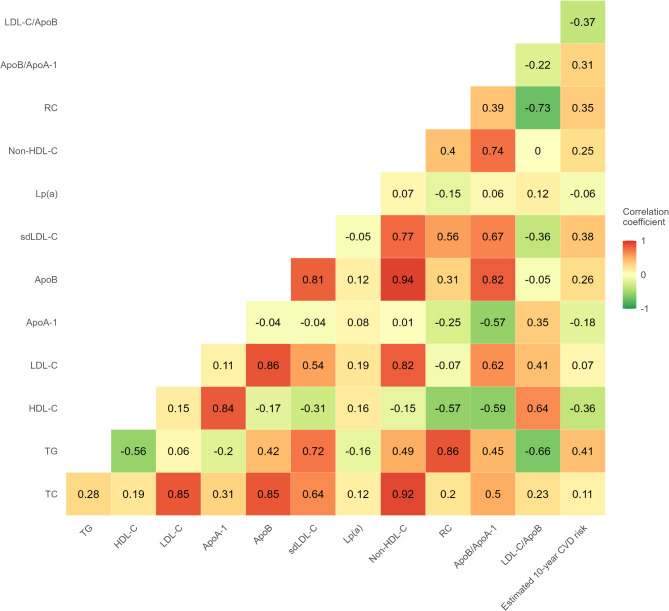
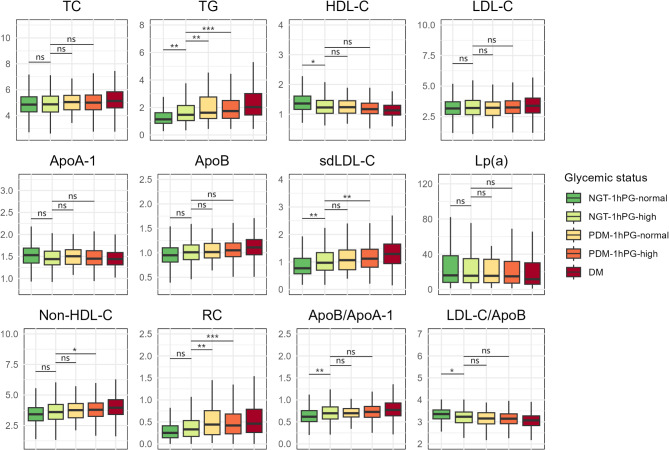
Results: Among 2 469 individuals, 22.7% had NGT with normal 1-h PG (NGT-1hPG-normal), 19.9% had NGT-1hPG-high, 2.6% had prediabetes with normal 1-h PG (PDM-1hPG-normal), 34.2% had prediabetes with elevated 1-h PG (PDM-1hPG-high), and 20.6% had newly diagnosed diabetes. The prevalence of dyslipidemia did not significantly differ between NGT-1hPG-high and PDM-1hPG-high (OR = 1.13, 95%CI: 0.88-1.44, P > 0.05). Higher 1-h PG levels were consistently associated with an atherogenic lipid profile, characterized by increased TC, TG, LDL-C, ApoB, sdLDL-C, non-HDL-C, RC and ApoB/ApoA-1, along with decreased ApoA-1, HDL-C and LDL-C/ApoB (all P < 0.05). Among lipid parameters, TG, sdLDL-C, RC, ApoB/ApoA-1, LDL-C/ApoB and HDL-C showed the strongest correlation with 10-year CVD risk, with Spearman's correlation coefficients of 0.41, 0.38, 0.35, 0.31, - 0.37 and - 0.36, respectively. In the NGT-1hPG-high, TG, sdLDL-C, and ApoB/ApoA-1 levels were significantly higher, while HDL-C and LDL-C/ApoB levels were significantly lower compared to counterparts with NGT-1hPG-normal (all P < 0.05). Moreover, except for TG and RC (both P < 0.01), the majority of lipid parameter levels in NGT-1hPG-high did not significantly differ from those in PDM (all P > 0.05).
Conclusions: NGT-1hPG-high exhibited a similar atherogenic lipid profile to that observed in PDM. 1-h PG could serve as a potential indicator for the early identification of at-risk individuals who may otherwise go undetected among NGT population.
Keywords: 1-hour post-load plasma glucose; Cardiovascular disease; Diabetes; Dyslipidemia; Lipid parameters.
© 2025. The Author(s).
Conflict of interest statement
Declarations. Ethics approval and consent to participate: This study was conducted in accordance with the Declaration of Helsinki and was approved by the Institutional Ethics Committee of the Chinese Academy of Medical Sciences & Peking Union Medical College under approval number [CAMS-PUMC-IEC-2022-061]. Written informed consent was obtained from all participants prior to their inclusion in the study. Consent for publication: All participants provided written informed consent for the publication of anonymized data. Competing interests: The authors declare no competing interests.
Figures
References
-
- International Diabetes Federation. Global diabetes data report 2000–2045. https://diabetesatlas.org/data/en/world/
-
- Haffner SM, Stern MP, Hazuda HP, et al. Cardiovascular risk factors in confirmed prediabetic individuals. Does the clock for coronary heart disease start ticking before the onset of clinical diabetes? JAMA. 1990;263(21):2893–8. - PubMed
-
- Bergman M, Tuomilehto J. International diabetes federation position statement on the 1-hour post-load plasma glucose for the diagnosis of intermediate hyperglycaemia and type 2 diabetes. Diabetes Res Clin Pract. 2024;210:111636. - PubMed
-
- Rong L, Luo N, Gong Y, et al. One-hour plasma glucose concentration can identify elderly Chinese male subjects at high risk for future type 2 diabetes mellitus: A 20-year retrospective and prospective study. Diabetes Res Clin Pract. 2021;173:108683. - PubMed
MeSH terms
Substances
Grants and funding
LinkOut - more resources
Full Text Sources
Medical
Miscellaneous
