

NNKcat: deep neural network to predict catalytic constants (Kcat) by integrating protein sequence and substrate structure with enhanced data imbalance handling
- PMID: 40370097
- PMCID: PMC12078937
- DOI: 10.1093/bib/bbaf212
NNKcat: deep neural network to predict catalytic constants (Kcat) by integrating protein sequence and substrate structure with enhanced data imbalance handling
Abstract
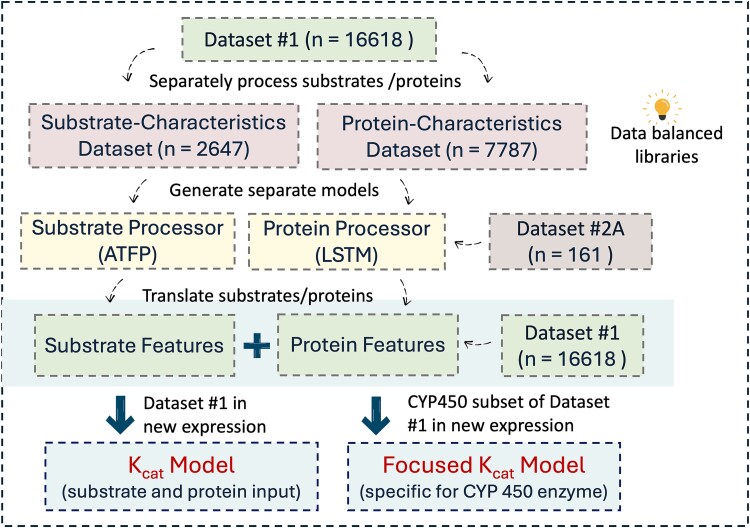
Catalytic constant (Kcat) is to describe the efficiency of catalyzing reactions. The Kcat value of an enzyme-substrate pair indicates the rate an enzyme converts saturated substrates into product during the catalytic process. However, it is challenging to construct robust prediction models for this important property. Most of the existing models, including the one recently published by Nature Catalysis (Li et al.), are suffering from the overfitting issue. In this study, we proposed a novel protocol to construct Kcat prediction models, introducing an intermedia step to separately develop substrate and protein processors. The substrate processor leverages analyzing Simplified Molecular Input Line Entry System (SMILES) strings using a graph neural network model, attentive FP, while the protein processor abstracts protein sequence information utilizing long short-term memory architecture. This protocol not only mitigates the impact of data imbalance in the original dataset but also provides greater flexibility in customizing the general-purpose Kcat prediction model to enhance the prediction accuracy for specific enzyme classes. Our general-purpose Kcat prediction model demonstrates significantly enhanced stability and slightly better accuracy (R2 value of 0.54 versus 0.50) in comparison with Li et al.'s model using the same dataset. Additionally, our modeling protocol enables personalization of fine-tuning the general-purpose Kcat model for specific enzyme categories through focused learning. Using Cytochrome P450 (CYP450) enzymes as a case study, we achieved the best R2 value of 0.64 for the focused model. The high-quality performance and expandability of the model guarantee its broad applications in enzyme engineering and drug research & development.
Keywords: Kcat; data imbalance; deep neural network; enzyme turnover number; focused learning; machine learning.
© The Author(s) 2025. Published by Oxford University Press.
Figures


 K_cat
K_cat values and the experimental ones in dataset #1. Lower RMSE value indicates lower prediction error of log_2 K_cat. GPR: Gaussian process regression; NN: Neural network; SVM: Support vector machine; tree: Decision tree.


Similar articles
-
DeepEnzyme: a robust deep learning model for improved enzyme turnover number prediction by utilizing features of protein 3D-structures.Brief Bioinform. 2024 Jul 25;25(5):bbae409. doi: 10.1093/bib/bbae409. Brief Bioinform. 2024. PMID: 39162313 Free PMC article.
-
A novel interpretability framework for enzyme turnover number prediction boosted by pre-trained enzyme embeddings and adaptive gate network.Methods. 2025 May;237:45-52. doi: 10.1016/j.ymeth.2025.02.010. Epub 2025 Feb 26. Methods. 2025. PMID: 40021034
-
PCP-GC-LM: single-sequence-based protein contact prediction using dual graph convolutional neural network and convolutional neural network.BMC Bioinformatics. 2024 Sep 2;25(1):287. doi: 10.1186/s12859-024-05914-3. BMC Bioinformatics. 2024. PMID: 39223474 Free PMC article.
-
MPEK: a multitask deep learning framework based on pretrained language models for enzymatic reaction kinetic parameters prediction.Brief Bioinform. 2024 Jul 25;25(5):bbae387. doi: 10.1093/bib/bbae387. Brief Bioinform. 2024. PMID: 39129365 Free PMC article.
-
A survey on protein-DNA-binding sites in computational biology.Brief Funct Genomics. 2022 Sep 16;21(5):357-375. doi: 10.1093/bfgp/elac009. Brief Funct Genomics. 2022. PMID: 35652477 Review.
References
MeSH terms
Substances
Grants and funding
LinkOut - more resources
Full Text Sources
Miscellaneous
