. 2025 Apr 30:19:1568143.
doi: 10.3389/fncom.2025.1568143. eCollection 2025.

Synaptic plasticity facilitates oscillations in a V1 cortical column model with multiple interneuron types

Affiliations

Synaptic plasticity facilitates oscillations in a V1 cortical column model with multiple interneuron types

Giulia Moreni et al. Front Comput Neurosci. .

Abstract

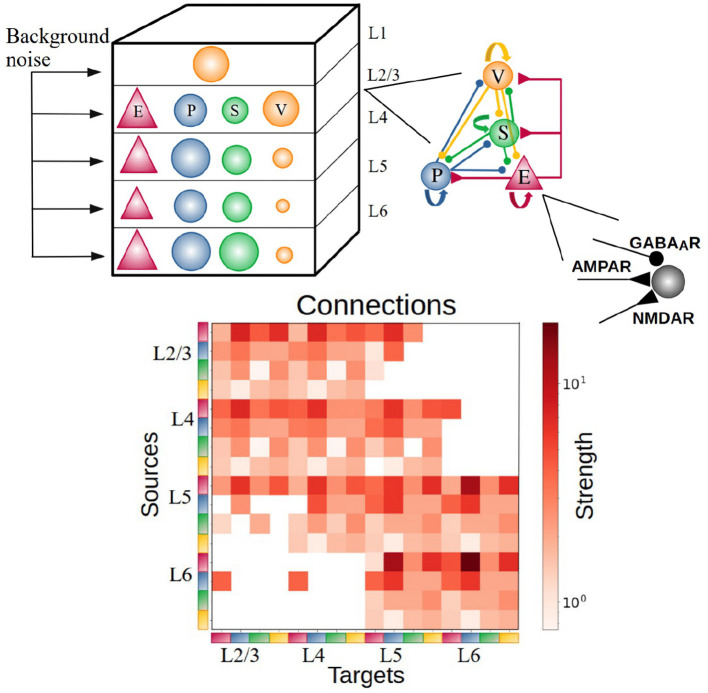
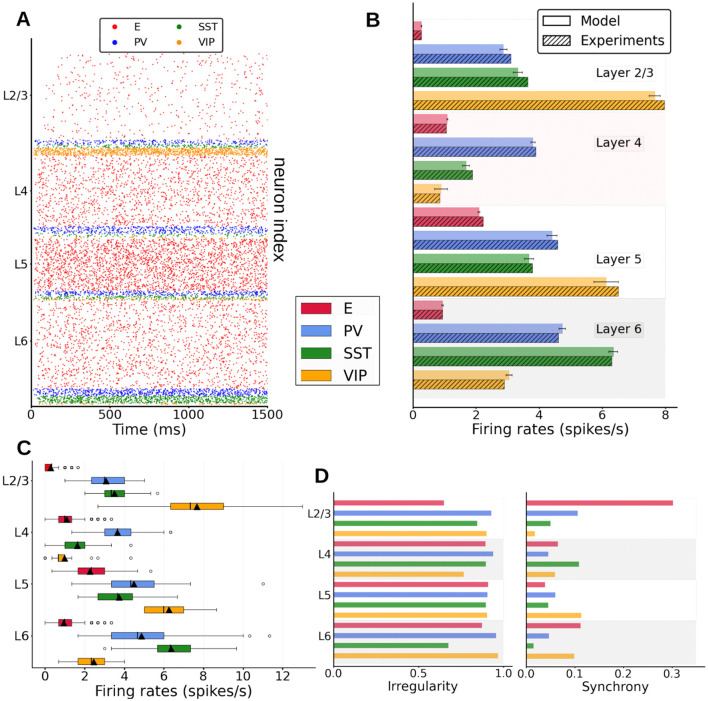
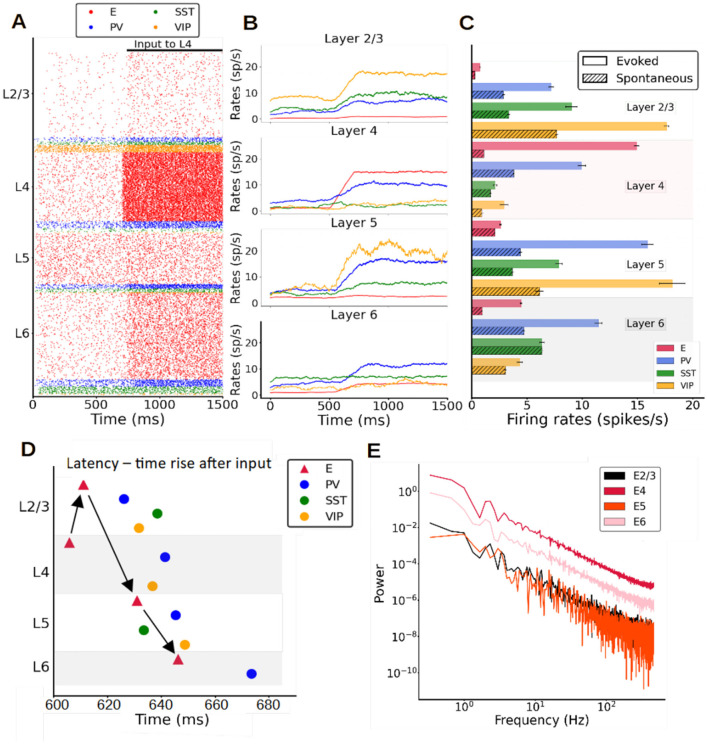
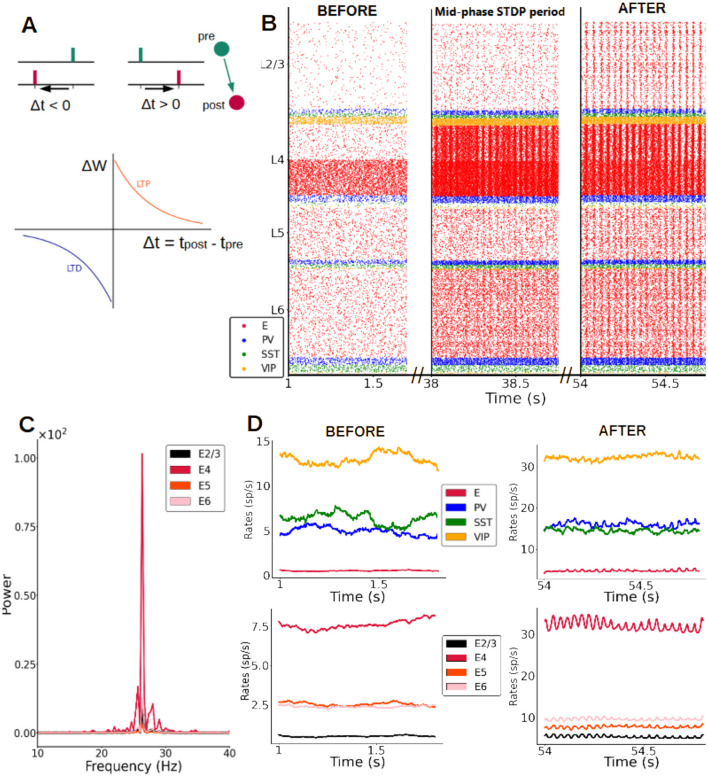
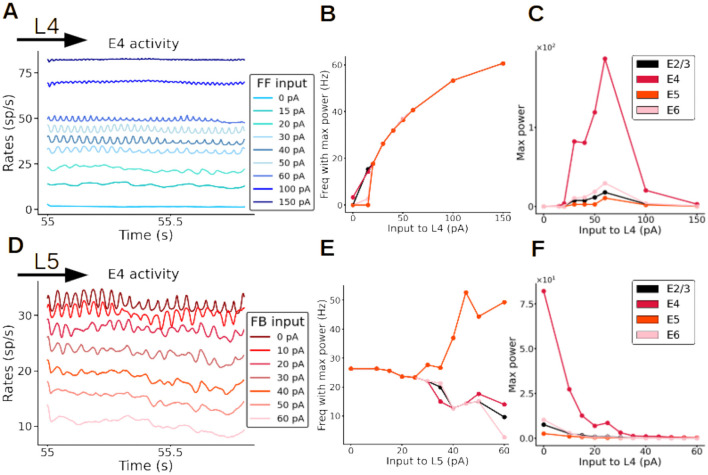
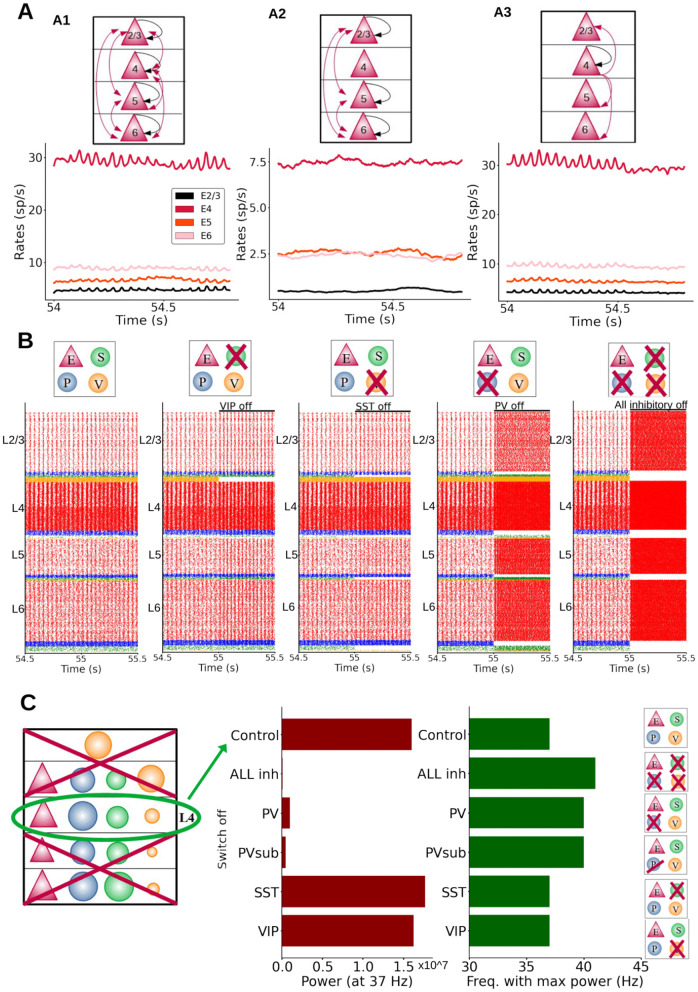
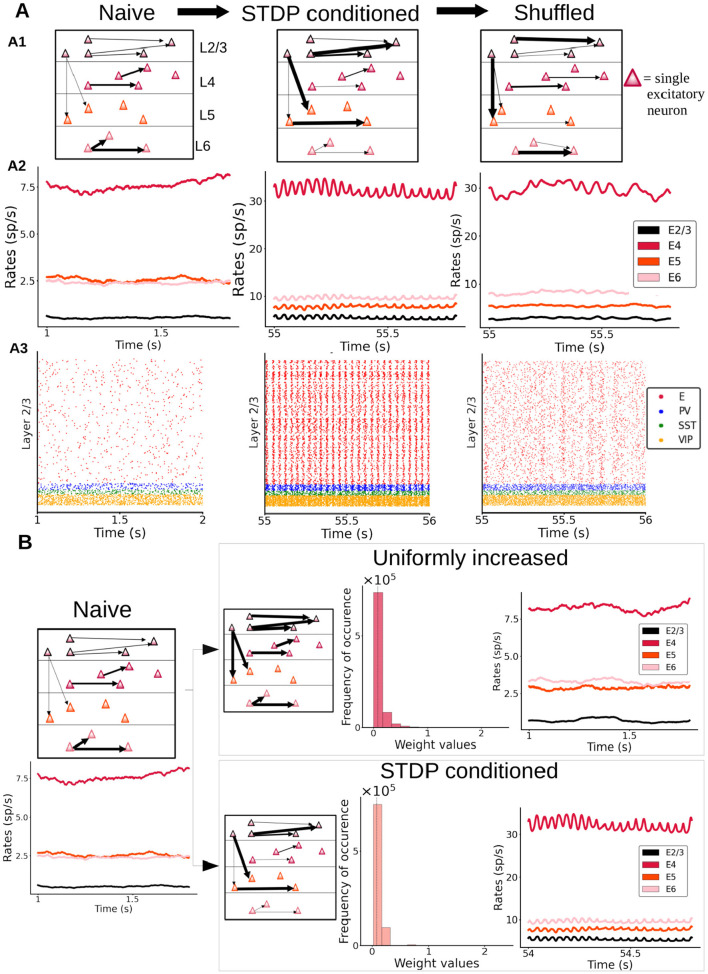
Neural rhythms are ubiquitous in cortical recordings, but it is unclear whether they emerge due to the basic structure of cortical microcircuits or depend on function. Using detailed electrophysiological and anatomical data of mouse V1, we explored this question by building a spiking network model of a cortical column incorporating pyramidal cells, PV, SST, and VIP inhibitory interneurons, and dynamics for AMPA, GABA, and NMDA receptors. The resulting model matched in vivo cell-type-specific firing rates for spontaneous and stimulus-evoked conditions in mice, although rhythmic activity was absent. Upon introduction of long-term synaptic plasticity in the form of an STDP rule, broad-band (15-60 Hz) oscillations emerged, with feedforward/feedback input streams enhancing/suppressing the oscillatory drive, respectively. These plasticity-triggered rhythms relied on all cell types, and specific experience-dependent connectivity patterns were required to generate oscillations. Our results suggest that neural rhythms are not necessarily intrinsic properties of cortical circuits, but rather they may arise from structural changes elicited by learning-related mechanisms.

Keywords: cortical column; interneurons; oscillations; synaptic plasticity; visual cortex.


Conflict of interest statement

The authors declare that the research was conducted in the absence of any commercial or financial relationships that could be construed as a potential conflict of interest. The author(s) declared that they were an editorial board member of Frontiers, at the time of submission. This had no impact on the peer review process and the final decision.

Figures

Figure 1
Figure 1
Sketch of the cortical column model. In layers 2/3, 4, 5, and 6 an excitatory population E (red triangles) and 3 types of inhibitory population (PV, SST, VIP as blue, green, orange circles: P, S, and V, respectively) are present. In layer 1 only VIP cells are present. The size of the circles in the top-left panel represents the relative size of the inhibitory populations. Connections between groups are not explicitly shown in the top left diagram; the zoomed-in schematic to the right shows inter-population connectivity and postsynaptic receptors (AMPA, GABA, NMDA) involved. The connectivity matrix is shown at the bottom [adapted from previous work (Billeh et al., 2020)].
Figure 2
Figure 2
Spontaneous cell-type specific activity in the columnar model. (A) Raster plot of spiking activity simulated for 1,500 ms in layers 2/3, 4, 5, and 6 (see inset for cell types). (B) Mean firing rates for each model population (full bars, standard deviation computed over 10 network realizations or initializations) vs. experiment (dashed bars, data for SST and VIP cells from Billeh et al., private communication). (C) Boxplot of single-unit firing rates in the model. Circles show outliers, black triangles indicate the mean firing rate of the population, and black vertical lines in each box indicate the median. (D) Left: Irregularity of single-unit spike trains quantified by the coefficient of variation of the inter-spike intervals. Right: Synchrony of multi-neuron spiking activity quantified by membrane potential traces.
Figure 3
Figure 3
Stimulus-evoked cell-type specific activity in the columnar model. (A) Raster plot of spiking activity for 1,500 ms showing the response of neurons after an input current (30 pA) is applied to layer 4 pyramidal neurons at 700 ms. (B) Mean firing rate traces (computed with a 200 ms sliding window and a 1-ms step) showing the increase of the overall activity when the input current is injected. (C) Mean firing rates after stimulus onset of each population for the model (solid bars) vs. spontaneous mean firing rates (dashed bars, Figure 1B). The error bar for the model are computed as standard deviation over 10 different simulations. (D) Propagation order of the signal elicited by layer 4 excitatory cell stimulation. This is obtained averaging the times rise of 10 different simulations. (E) Power spectrum of excitatory mean firing rates across all layers, showing no signs of oscillatory activity.
Figure 4
Figure 4
Synaptic plasticity gives rise to fast oscillations. (A) Scheme of STDP rule, with reductions vs. increases in excitatory synaptic strength (excitatory-excitatory synapses only) driven by pre- and post-synaptic spike timing. Δt is the time between pre and post synaptic spike of a pair of connected neurons. ΔW is the change of synaptic weight of the pair according to the STDP rule, LTP stands for long term potentiation and LTD for long term depression. (B) Raster plot of spike activity in the column at three example time points after STDP is introduced (concretely 1 s, 38 s and 54 s after plasticity is activated), showing the emergence of oscillations. An input of 30 pA (from t = 0.5 s onwards) is given to half of the pyramidal cells in layer 4 and all excitatory-to-excitatory connections in the entire column evolve according to the STDP rule. (C) Power spectrum of the firing rates of pyramidal cells for different layers. The oscillations of pyramidal activity at the end of the plasticity period (55 s) have a mean frequency of 26 Hz for an input of 30 pA. (D) Firing rate traces at the beginning (left) and at the end (right) of the plasticity period. Top row: rates in layer 2/3 for all four neuron types. Bottom row: rates of excitatory neurons in all layers.
Figure 5
Figure 5
Fast oscillations are modulated by external input. (A–C) Modulation of oscillations of excitatory neurons in layer 4 (E4) by feedforward (FF) input strength. (A) Firing rates of excitatory neurons in layer 4, each color represents a simulation with a different input strength (color code in inset). The stronger the input to layer 4, the faster the oscillations are (dark blue trace). When no input to layer 4 is present the oscillations disappear (light blue trace; 0 pA). (B) Frequency of firing rate of excitatory neurons in all layers as a function of input strength to layer 4. (C) Maximal power of oscillations as a function of input strength to layer 4. (D–F) Modulation of oscillations of excitatory neurons in layer 4 by feedback (FB) input strength, while input to layer 4 is kept constant at 30 pA. (D) Firing rates of excitatory neurons in layer 4, each color represents a simulation with a different input strength to layer 5 (color code in inset). The stronger the input to layer 5, the slower the oscillations are. When the input strength to layer 5 is very high (60 pA) the oscillations disappear (pink trace). (E) Frequency of oscillatory activity of excitatory neurons as a function of the input to layer 5. (F) Maximal power of oscillations as a function of the input strength to layer 5.
Figure 6
Figure 6
Mechanistic origin of oscillations. (A) Different effects on oscillations depending on the layer in which plasticity of excitatory-to-excitatory synapses is enabled (Black arrows: plasticity within a group; red arrows: plasticity between different groups). A1: plasticity in all excitatory-to-excitatory connections. Firing rate profiles were obtained while L4 input was provided to half of the pyramidal cells in layer 4. A2: plasticity in connections between all layers except those from and to layer 4. A3: plasticity enabled only in synapses from layer 4 excitatory neurons. There was no plasticity in the connections going from layer 2/3, 5, 6 to the other layers. (B) Raster plots of the whole column model for different inactivation conditions. Each group(s) is inactivated at 55 s, to better visualize the effects on neural dynamics. From left to right: control, inactivation of SST, VIP, PV cells and all inhibitory neurons, respectively. Inhibition of PV cells had the largest effect on oscillation frequency and amplitude. (C) Isolated layer 4 circuit. The oscillation frequency in the control situation was 37 Hz. Middle panel: oscillatory power at the 37 Hz frequency for inactivations of different cell groups: all inhibitory, PV, PVsub (same number of PV cells silenced as the number of SST cells present in the column), VIP and SST cells. Note that switching off VIP cells did not change the power of the oscillations drastically as was the case for PV inactivation. Right panel: oscillatory frequency with the maximum power for the same conditions. When switching PV cells off the oscillation frequency (with the maximum power) changed from 37 Hz to a higher value (41 Hz). The power of the oscillation frequency is shown in Supplementary Figure S14.
Figure 7
Figure 7
Importance of having a specific distribution of synaptic weights for the genesis of oscillations. (A) Left: “naive” column, prior to plasticity. Middle: columnar model after enabling synaptic plasticity, with activity driven by feedforward input (30 pA to half of the layer 4 pyramidal neurons). Right: same as in the middle panel, but with weights randomly shuffled between individual cell pairs. A2: Firing rate traces of excitatory cells in all layers of the three networks. A3: Raster plots for layer 2/3 are shown for all three networks. (B) A naive column (left) may be either subjected to stimulus-driven changes via STDP (bottom right) or to an equivalent mean increase of all its weights with a similar global weight distribution as the STDP-conditioned network (see histograms with probability distribution of weight values) but without STDP-sculpted structural correlations. Firing rate traces show the presence or absence of oscillations in each case.

Similar articles

Cited by

References

    1. Antonoudiou P., Tan Y. L., Kontou G., Upton A. L., Mann E. O. (2020). Parvalbumin and somatostatin interneurons contribute to the generation of hippocampal gamma oscillations. J. Neurosci. 40, 7668–7687. 10.1523/JNEUROSCI.0261-20.2020 - DOI - PMC - PubMed
    1. Bastos A. M., Vezoli J., Bosman C. A., Schoffelen J.-M., Oostenveld R., Dowdall J. R., et al. . (2015). Visual areas exert feedforward and feedback influences through distinct frequency channels. Neuron 85, 390–401. 10.1016/j.neuron.2014.12.018 - DOI - PubMed
    1. Battaglia D., Hansel D. (2011). Synchronous chaos and broad band gamma rhythm in a minimal multi-layer model of primary visual cortex. PLoS Comput. Biol. 7:e1002176. 10.1371/journal.pcbi.1002176 - DOI - PMC - PubMed
    1. Beerendonk L., Mejías J. F., Nuiten S. A., de Gee J. W., Fahrenfort J. J., van Gaal S. (2024). A disinhibitory circuit mechanism explains a general principle of peak performance during mid-level arousal. Proc. Natl. Acad. Sci. U.S.A. 121:e2312898121. 10.1073/pnas.2312898121 - DOI - PMC - PubMed
    1. Bernander O., Douglas R. J., Martin K. A., Koch C. (1991). Synaptic background activity influences spatiotemporal integration in single pyramidal cells. Proc. Natl. Acad. Sci. U.S.A. 88, 11569–11573. 10.1073/pnas.88.24.11569 - DOI - PMC - PubMed

LinkOut - more resources