. 2025 Apr 30:12:1582181.
doi: 10.3389/fmolb.2025.1582181. eCollection 2025.

Unraveling the role of histone acetylation in sepsis biomarker discovery

Affiliations

Unraveling the role of histone acetylation in sepsis biomarker discovery

Feng Cheng et al. Front Mol Biosci. .

Abstract

Introduction: Sepsis is a life-threatening condition caused by a dysregulated immune response to infection. Despite advances in clinical care, effective biomarkers for early diagnosis and prognosis remain lacking. Emerging evidence suggests that histone acetylation plays a crucial role in the pathophysiology of sepsis.

Methods: Transcriptomic and single-cell RNA sequencing data were used to identify histone acetylation-related genes. Differential expression analysis and weighted gene co-expression network analysis (WGCNA) were performed, followed by machine learning algorithms (LASSO, SVM-RFE, and Boruta) to screen for potential biomarkers. Mendelian randomization (MR), RT-qPCR, and functional assays were conducted for validation.

Results: BLOC1S1, NDUFA1, and SFT2D1 were identified as key biomarkers. A predictive nomogram demonstrated strong diagnostic potential. Immune infiltration and single-cell analyses linked the biomarkers to macrophage activity. MR analysis confirmed SFT2D1 as a causal factor in sepsis. Functional assays showed that knockdown of SFT2D1 suppressed CXCL10 and IL-6 expression, indicating its pro-inflammatory role.

Discussion: This study identifies novel biomarkers associated with histone acetylation and immune dysregulation in sepsis. These findings deepen our understanding of sepsis pathogenesis and may facilitate the development of improved diagnostic and therapeutic strategies.

Keywords: Mendelian randomization; biomarkers; histone acetylation; sepsis; single-cell RNA sequencing.


Conflict of interest statement

The authors declare that the research was conducted in the absence of any commercial or financial relationships that could be construed as a potential conflict of interest.

Figures

FIGURE 1
FIGURE 1
Differential expression analysis and weighted gene co-expression network analysis (WGCNA). (A) volcano map of differentially expressed genes (DEGs) between sepsis and control groups in the GSE95233. (B) heatmap of top 20 DEGs between sepsis and control samples. (C) histone acetylation-related genes (HARGs) score difference between sepsis and control groups. ****, P < 0.0001. (D) sample clustering tree. Red is the disease sample, white is the control sample. (E) the network approached the scale-free distribution when the ordinate R2 on the left was close to the threshold of 0.9 and the average connectivity on the right was close to 0. The optimal soft threshold was 10. (F) dynamic clipping tree of the 11 modules. (G) the heatmap showed the correlation of modules with HARGs score. MEgreen, the module with the highest absolute correlation with HARGs score, was selected as the key module, with a total of 763 genes.
FIGURE 2
FIGURE 2
Screening and protein-protein interaction (PPI) network of candidate genes. (A) the intersection of DEGs, key module genes, HARGs resulted in 281 candidate genes. (B) Gene ontology (GO) enrichment analysis of candidate genes. Biological process, BP; cellular component, CC; molecular function, MF. (C) Kyoto Encyclopedia of Genes and Genomes (KEGG) enrichment analysis of candidate genes. (D) PPI network of candidate genes.
FIGURE 3
FIGURE 3
Acquisition of biomarkers. (A) least absolute shrinkage and selection operator (LASSO) regression analysis was performed for 10-fold cross-validation of the screened genes to obtain 10 characterized genes. (B) support vector machine-recursive feature elimination (SVM-RFE) analysis on the features obtained from the LASSO analysis. (C) Boruta agorithm screens for candidate biomarkers from the SVM-RFE analysis. Green represents important feature. (D) receiver operating characteristic (ROC) curves of candidate biomarkers in the training and validation sets. Genes with area under the curve (AUC) values ≥0.7 were screened to obtain BLOC1S1, NDUFA1, and SFT2D1. (E) expression box maps of candidate biomarkers between control and sepsis samples were used in the training dataset (left) and validation dataset (right) to screen for genes with exhibited significant and consistent trends. ***, P < 0.001; ****, P < 0.0001.
FIGURE 4
FIGURE 4
Gene set enrichment analysis (GSEA) and gene set variation analysis (GSVA). (A–C) GSEA of BLOC1S1, NDUFA1, and SFT2D1, respectively. (D) compare with control group, GSVA of sepsis group.
FIGURE 5
FIGURE 5
Construction of a nomogram. (A) construct a nomogram based on the expression of each biomarker. (B) calibration curve of nomogram. (C) ROC curve of nomogram.
FIGURE 6
FIGURE 6
Immune infiltration analysis. (A) stacked bar chart of immune cell score between sepsis and control samples. (B) box plot of immune cell infiltration between sepsis and control samples. ns, no significance; *, P < 0.05; **, P < 0.01; ***, P < 0.001; ****, P < 0.0001. (C) correlation between biomarkers and immune cells. *, P < 0.05; **, P < 0.01; ***, P < 0.001; ****, P < 0.0001.
FIGURE 7
FIGURE 7
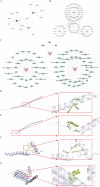
Construction of regulatory network, drug predition, and molecular docking. (A) the network of transcription factors (TFs)-biomarkers. Red is biomarkers, blue is TFs. (B) the network of mRNA-microRNA (miRNA)-long non-coding RNA (lncRNA). Orange is biomarkers, purple is the lncRNA, and green is the miRNA. (C) the identification of drugs targeting biomarkers. Pink is biomarkers, green is drugs. (D,E) molecular docking mode diagram of BLOC1S1 with Palmitic Acid and Sorafenib, respectively. (F) molecular docking mode diagram of NDUFA1 with Palmitic Acid. (G) molecular docking mode diagram of SFT2D1 with Sorafenib.
FIGURE 8
FIGURE 8
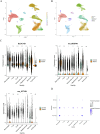
Single-cell RNA sequencing (scRNA-seq) in GSE167363. (A) cellular Uniform Manifold Approximation and Projection (UMAP) clustering map with 14 cell clusters. (B) annotation to seven cell types. (C) box plot of the expression of biomarker in cell types between sepsis and control groups. Ns, no significance; *, P < 0.05; **, P < 0.01; ***, P < 0.001; ****, P < 0.0001. (D) bubble plot of biomarkers expression in various cell types.
FIGURE 9
FIGURE 9
Pseudotime and cell communication analysis of macrophages. (A) time trajectory differentiation of macrophages. (B) macrophage differentiation was divided into seven stages. (C) macrophage cell differentiation locus in sepsis and control groups. (D) expression distribution of biomarkers in a macrophage sample. (E) expression distribution of biomarkers at different differentiation stages in macrophage. (F) cell communication analysis between sepsis and control samples. ns, no significance; *, P < 0.05; **, P < 0.01; ***, P < 0.001; ****, P < 0.0001.
FIGURE 10
FIGURE 10
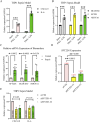
Validation of biomarker expression and functional analysis of SFT2D1 in sepsis. (A,B) Reverse transcription-quantitative polymerase chain reaction (RT-qPCR) confirmation of the THP-1-derived sepsis model. THP-1 monocytes were differentiated into macrophages using PMA (100 nM, 48 h) and then stimulated with LPS (1 μg/mL, 24 h). The relative mRNA expression levels of CXCL10, IL-6, BLOC1S1, NDUFA1, and SFT2D1 were significantly upregulated in LPS-treated cells compared to untreated controls. GAPDH was used as an internal control. (n = 4 independent experiments, mean ± SD, **P < 0.01). (C) RT-qPCR validation of biomarker expression in clinical blood samples. Peripheral blood was collected from sepsis patients and healthy controls. The expression levels of BLOC1S1, NDUFA1, and SFT2D1 were significantly higher in sepsis patients compared to healthy controls (n = 9 for healthy and n = 11 for sepsis group, mean ± SD, **P < 0.01). (D) Knockdown efficiency of SFT2D1 in THP-1-derived macrophages. THP-1 macrophages were transfected with siRNA targeting SFT2D1 or scrambled siRNA as a control. RT-qPCR analysis confirmed a significant reduction in SFT2D1 expression after siRNA transfection (n = 3 independent experiments, **P < 0.05). (E) Effect of SFT2D1 inhibition on inflammatory cytokines. After SFT2D1 knockdown, CXCL10 and IL-6 mRNA levels were measured by RT-qPCR. SFT2D1 suppression significantly reduced the expression of both pro-inflammatory cytokines in LPS-stimulated macrophages, indicating its role in promoting sepsis-related inflammation (n = 3 independent experiments, **P < 0.05). (Statistical significance was determined using multiple t-tests for two-group comparisons and one-way ANOVA followed by Dunnett’s post hoc test for multiple group comparisons; P < 0.05; P < 0.01; P < 0.001. Error bars represent mean ± SD.).

Similar articles

References

    1. Ban S., Cheng W., Wang X., Niu J., Wu Q., Xu Y. (2024). Predicting the final metabolic profile based on the succession-related microbiota during spontaneous fermentation of the starter for Chinese liquor making. mSystems 9 (2), e0058623. 10.1128/msystems.00586-23 - DOI - PMC - PubMed
    1. Bowden J., Davey Smith G., Haycock P. C., Burgess S. (2016). Consistent estimation in mendelian randomization with some invalid instruments using a weighted median estimator. Genet. Epidemiol. 40 (4), 304–314. 10.1002/gepi.21965 - DOI - PMC - PubMed
    1. Burgess S., Thompson S. G. (2017). Interpreting findings from Mendelian randomization using the MR-Egger method. Eur. J. Epidemiol. 32 (5), 377–389. 10.1007/s10654-017-0255-x - DOI - PMC - PubMed
    1. Chen B., Zhou M., Guo L., Huang H., Sun X., Peng Z., et al. (2024b). An integrated machine learning framework identifies prognostic gene pair biomarkers associated with programmed cell death modalities in clear cell renal cell carcinoma. Front. Biosci. (Landmark Ed) 29 (3), 121. 10.31083/j.fbl2903121 - DOI - PubMed
    1. Chen J., Yuan X. L., Zhou X., Xu J., Zhang X., Duan X. (2024a). Mendelian randomization implicates causal association between epigenetic age acceleration and age-related eye diseases or glaucoma endophenotypes. Clin. Epigenetics 16 (1), 106. 10.1186/s13148-024-01723-w - DOI - PMC - PubMed

LinkOut - more resources