. 2025 Mar;15(3):1415-1429.
doi: 10.1016/j.apsb.2025.01.007. Epub 2025 Jan 22.

Effective therapeutic targeting of tumor lineage plasticity in neuroendocrine prostate cancer by BRD4 inhibitors

Affiliations

Effective therapeutic targeting of tumor lineage plasticity in neuroendocrine prostate cancer by BRD4 inhibitors

Xiong Zhang et al. Acta Pharm Sin B. 2025 Mar.

Abstract

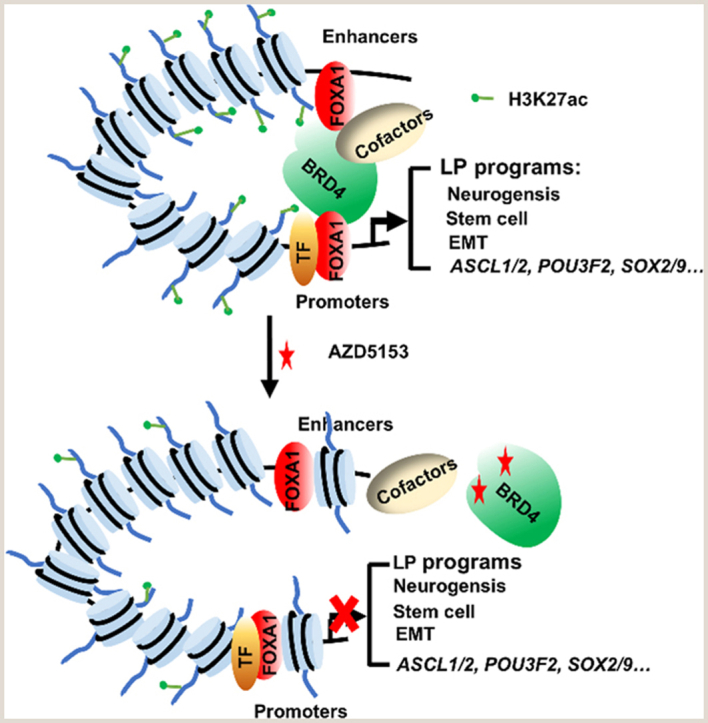
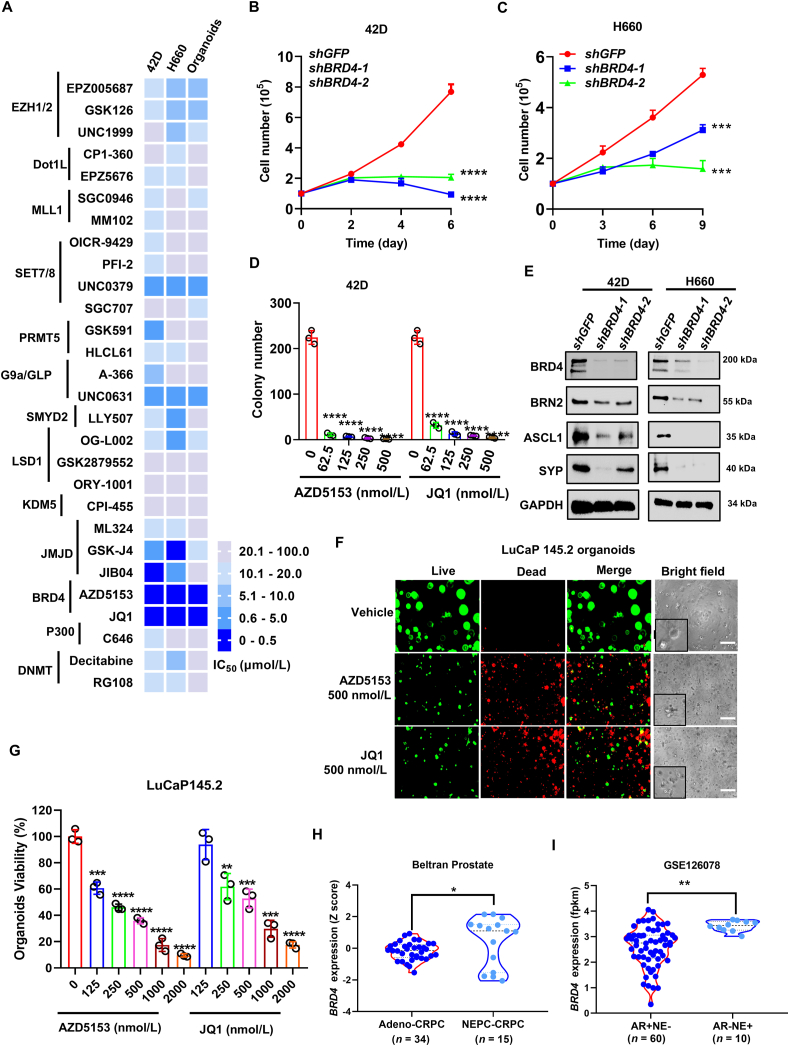
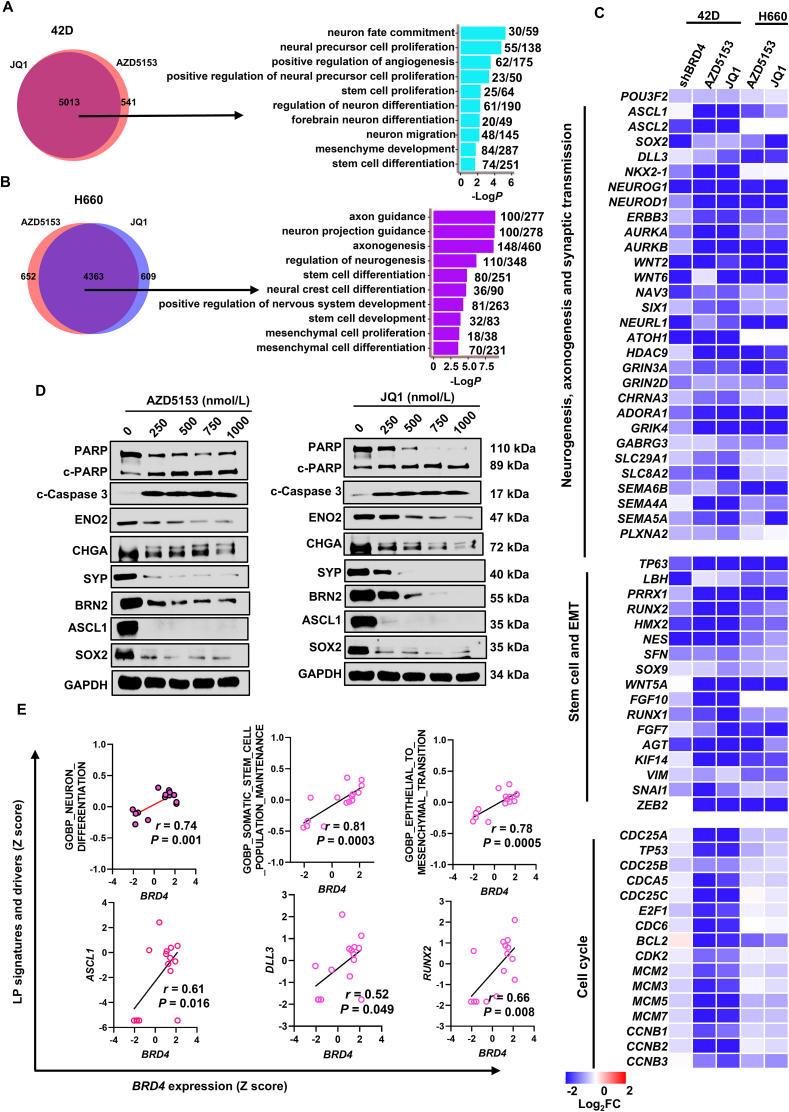
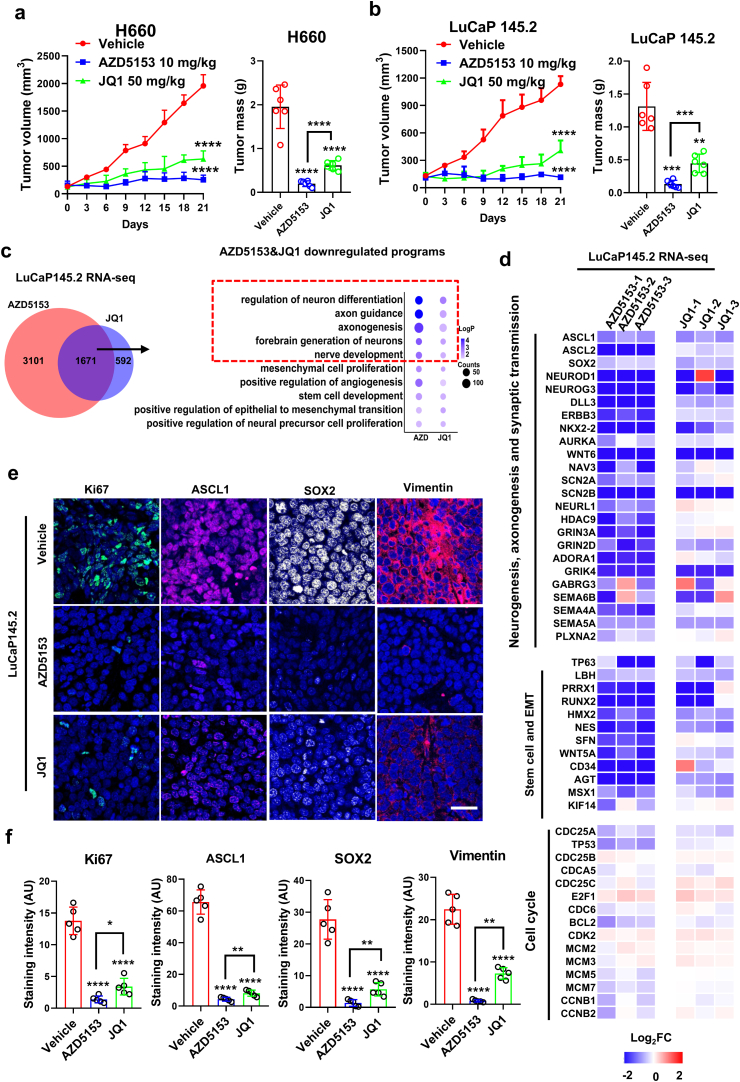
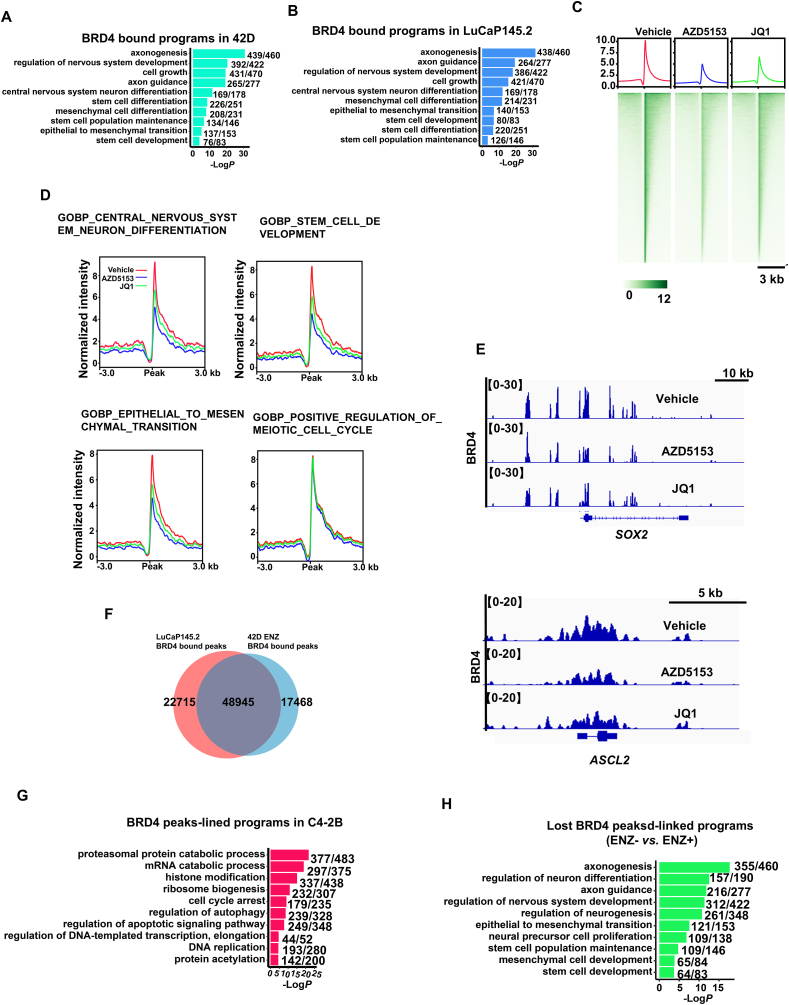
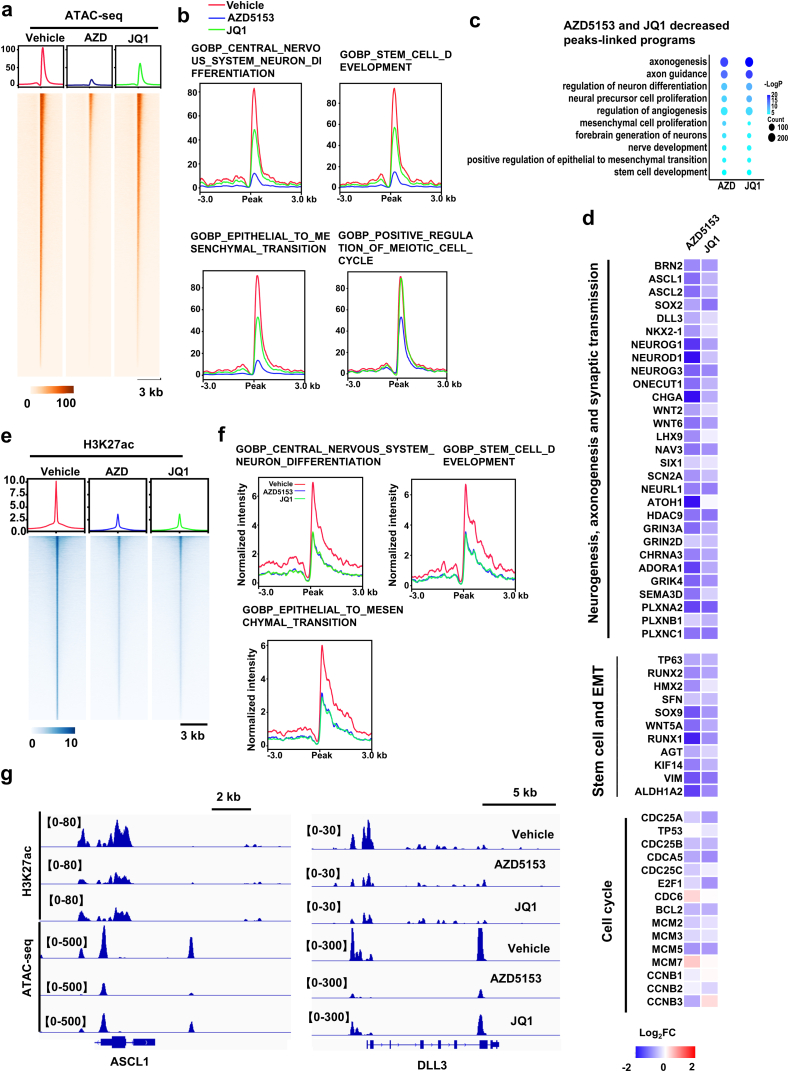
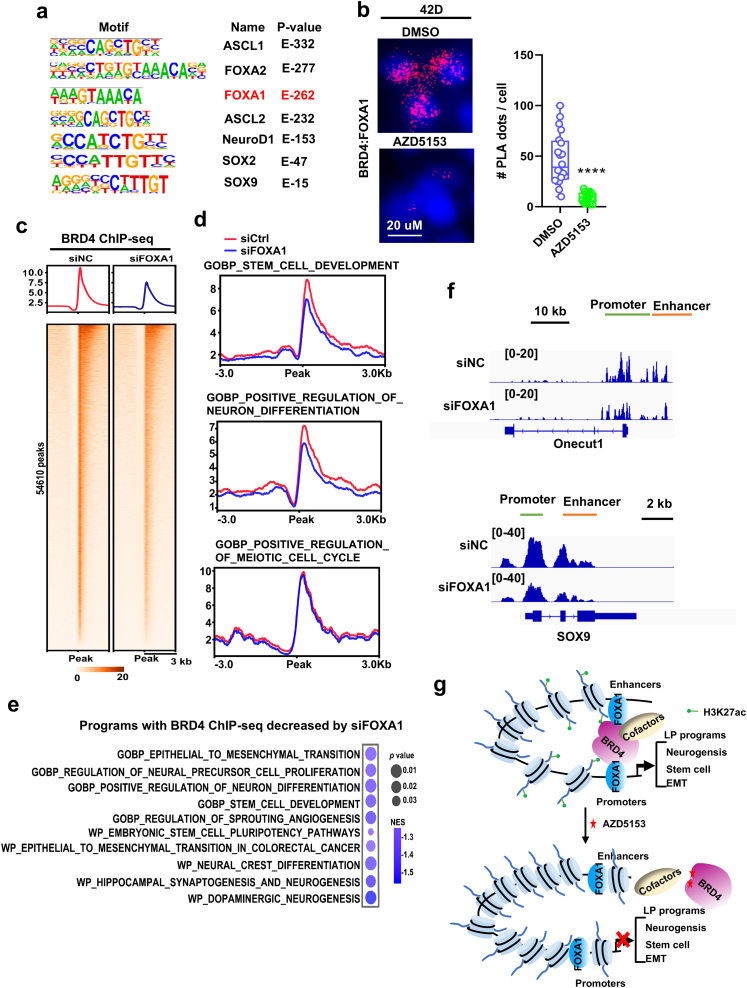
Tumor lineage plasticity (LP) is an emerging hallmark of cancer progression. Through pharmacologically probing the function of epigenetic regulators in prostate cancer cells and organoids, we identified bromodomain protein BRD4 as a crucial player. Integrated ChIP-seq and RNA-seq analysis of tumors revealed, for the first time, that BRD4 directly activates hundreds of genes in the LP programs which include neurogenesis, axonogenesis, EMT and stem cells and key drivers such as POU3F2 (BRN2), ASCL1/2, NeuroD1, SOX2/9, RUNX1/2 and DLL3. Interestingly, BRD4 genome occupancy is reprogrammed by anti-AR drugs from facilitating AR function in CRPC cells to activating the LP programs and is facilitated by pioneer factor FOXA1. Significantly, we demonstrated that BRD4 inhibitor AZD5153, currently at clinical development, possesses potent activities in complete blockade of tumor growth of both de novo neuroendocrine prostate cancer (NEPC) and treatment-induced NEPC PDXs and that suppression of tumor expression of LP programs through reduction of local chromatin accessibility is the primary mechanism of action (MOA) by AZD5153. Together, our study revealed that BRD4 plays a fundamental role in direct activation of tumor LP programs and that its inhibitor AZD5153 is highly promising in effective treatment of the lethal forms of the diseases.

Keywords: AZD5153; BRD4; BRN2; ChIP-seq; FOXA1; Neurogenesis; PDX; Tumor lineage plasticity.


Conflict of interest statement

The authors declare no competing interests.

Figures

Image 1
Graphical abstract
Figure 1
Figure 1
BRD4 is overexpressed in NEPC tumors and required for NEPC cell growth and survival. (A) Heatmap of IC50 in 42D and H660 cells and LuCaP145.2 NEPC PDX tumor derived organoids which were treated with the epigenetic inhibitors for 4 days. Cell viability measured by CellTiter-Glo® 3.0 reagent. (B, C) 42D and H660 cells were infected with lentivirus expressing control shRNA against GFP or two different shRNAs against BRD4 for indicated times. Cell growth curves were plotted. (D) 42D cells were treated with indicated concentrations of BRD4 inhibitors JQ1 and AZD5153 for 14 days. Cell colonies were counted. (E) 42D and H660 cells were infected with lentivirus containing shRNAs targeting BRD4 for 72 h, before the expression of BRD4 and NEPC drivers BRN2, ASCL1 and NEPC marker SYP was detected by immunoblotting. (F, G) LuCaP145.2 PDX-derived organoids were treated with DMSO or indicated concentrations of BRD4 inhibitors. Four days later, representative images were taken under a fluorescence microscope or standard light microscope (F). Scale bar = 200 μm. Organoid viability was measured using CellTiter-Glo (G). (H, I) The expression of BRD4 in adenocarcinoma subtype and NEPC subtype in Beltran cohort and GSE126078 cohort. Data are shown as mean ± SD. n = 3. Student's t test. ∗∗P < 0.01, ∗∗∗P < 0.001, ∗∗∗∗P < 0.0001.
Figure 2
Figure 2
BRD4 controls lineage plasticity (LP) programs in NEPC. (A, B) Left, Venn diagram of the number of protein-coding genes with expression significantly (>1.5-fold) downregulated in t-NEPC 42D and de novo NEPC H660 cells treated with 500 nmol/L JQ1 and 500 nmol/L AZD5153 for 48 h, respectively. Right, Gene ontology (GO) analysis of the commonly down-regulated genes by JQ1 and AZD5153 treatment. Top 10 representative programs were shown. Also shown at right are the number of downregulated genes and the total number of genes in each program. (C) Heatmap shows mRNA expression changes of genes in cell cycle and LP programs including neurogenesis, stem cell and EMT identified by GO analysis in 42D and H660 cells. (D) Immunoblotting of proteins involved in neuronal programs and apoptosis in H660 cells treated with indicated concentrations of BRD4 inhibitors AZD5153 and JQ1 for 2 days. The experiments were repeated three times. (E) Correlation between the expression of BRD4 and LP programs and drivers in NEPC subtype (n = 15) in Beltran cohort. ∗∗P < 0.01, ∗∗∗P < 0.001, ∗∗∗∗P < 0.0001.
Figure 3
Figure 3
BRD4 inhibitors potently inhibited NEPC tumor growth and LP programs in vivo. (A, B) Mice bearing H660 and LuCaP145.2 tumors (n = 6) were treated, i.p., 5 times per week, with vehicle, 50 mg/kg JQ1 and 10 mg/kg AZD5153 for 21 days. Tumor volume was measured every 3 days and tumor growth curves were drawn to show growth of tumors of each group. (C–F) When tumor reached around 300 mm3, mice bearing LuCaP145.2 tumors were treated i.p. with vehicle, 50 mg/kg JQ1 and 10 mg/kg AZD5153 for 7 consecutive days and tumor tissues were preserved in OCT for immunofluorescence or snap frozen for protein and RNA analysis. (C) Venn diagram of the number of protein-coding genes with expression significantly (1.5-fold) downregulated, which is detected by RNA-seq of PDX tumors treated with JQ1 and AZD5153, respectively. Gene ontology (GO) analysis of genes downregulated by JQ1 and AZD5153 treatment. Top 10 representative programs are shown. (D) Heatmap display of relative expression changes (compared to Vehicle) of genes in LP programs including neurogenesis, axonogensis, synaptic transmission, stem cell and EMT and in cell cycle programs. (E, F) Ki67, ASCL1, SOX2 and Vimentin immunofluorescence were performed. Representative images from three independent tumors are shown. Staining intensity of these proteins were measured by image J using at least 5 random images. Data are shown as mean ± SD. Student's t test. ∗∗P < 0.01, ∗∗∗P < 0.001, ∗∗∗∗P < 0.0001.
Figure 4
Figure 4
BRD4 is reprogrammed by ENZ and directly controls LP programs at both promoters and enhancers in NEPC. (A) GO analysis of BRD4 ChIP-seq peaks-linked genes in 42D cells. Top 10 representative LP programs are shown. Also shown are the number of genes with BRD4 ChIP-seq peaks and the total gene number of each program. (B) GO analysis of BRD4 ChIP-seq peaks-linked genes in LuCaP145.2. Top 10 representative LP programs are shown. Also shown are the number of genes with BRD4 ChIP-seq peaks and the total gene number of each program. (C–E) LuCap145.2 tumors were treated with AZD5153 (10 mg/kg, i.p.) or JQ1 (50 mg/kg, i.p.) for 7 days and then tumor was harvested for BRD4 and H3K27ac ChIP-seq analysis. (C) Heatmap representation of ChIP-seq signal of BRD4 at peak center. (D) BRD4 ChIP-seq peak profile within 3-kb windows around the center of BRD4 peaks at genes in LP and cell cycle programs in LuCaP145.2 tumors treated with BRD4 inhibitors. (E) IGV snapshots of BRD4 occupancy at SOX2 and ASCL1 chromatin region at promoters and enhancers. (F) Venn diagrams show the overlap of BRD4 peaks in t-NEPC 42D cells and de novo NEPC LuCaP145.2 tumors. (G) GO analysis of BRD4 peaks-linked genes in C4-2B cells. Top 10 representative LP programs are shown. (H) Differential binding analysis of BRD4 in 42D cells with or without ENZ treatment. The peaks lost without ENZ treatment were subjected to GO analysis and top 10 representative LP programs were shown. Also shown are the number of genes with BRD4 ChIP-seq peaks and the total gene number of each program.
Figure 5
Figure 5
BRD4 stimulates LP programs through increasing chromatin accessibility. (A) Heatmap presentation of genome-wide chromatin accessibility detected by ATAC-seq in LuCaP145.2 tumors. (B) Chromatin accessibility profile within ±3-kb windows around peak center at LP and cell cycle programs. (C) Bubble plots show enrichment of LP-associated, GO gene programs with ATAC-seq peaks decreased by AZD5153 and JQ1. (D) Heatmaps display the log2 fold change of chromatin accessibility at genes in LP programs including neurogenesis, stem cell and EMT. (E) Heatmap presentation of ChIP-seq signal of H3K27ac at peak center. (F) H3K27ac signal within ±3-kb windows around the center of H3K27ac peaks at genes in LP programs including neurogenesis, stem cell and EMT in LuCaP145.2 tumors treated with BRD4 inhibitors. (G) IGV snapshots of chromatin accessibility and H3K27ac signal at locus of LP drivers ASCL1 and DLL3.
Figure 6
Figure 6
Chromatin binding of BRD4 is promoted by reprogrammed FOXA1 in NEPC. (A) Motif enrichment analysis of ATAC-seq differential peaks, listing 7 representative TFs linked to LP. (B) Proximity Ligation Assay (PLA) for protein interactions between BRD4 and FOXA1 in 42D cells. The cells were treated with 500 nmol/L AZD5153 for 24 h, and then Duolink assay between BRD4 and FOXA1 was performed (cells without treatment as positive control). (C) Heatmap presentation of ChIP-seq signal of BRD4 after FOXA1 knockdown for 24 h at peak center in 42D cells. (D) BRD4-bond profile within ±3-kb windows around the center of BRD4 peak regions at genes of LP and cell cycle programs in 42D cells after FOXA1 knockdown. (E) Bubble plots show the decreased chromatin occupancy of BRD4 affected by FOXA1 knockdown at programs involved in LP significantly enriched by GSEA analysis of in 42D cells. (F) IGV snapshots of BRD4 occupancy at chromatin region of LP drivers NR2F2, SOX9, ONECUT1 and ASCL2. (G) Schematics of a potential mechanism of BRD4 function in NEPC and the effect of the BRD4 inhibitor on NEPC tumors.

Similar articles

References

    1. Chan J.M., Zaidi S., Love J.R., Zhao J.L., Setty M., Wadosky K.M., et al. Lineage plasticity in prostate cancer depends on JAK/STAT inflammatory signaling. Science. 2022;377:1180–1191. - PMC - PubMed
    1. Sathyanarayanan A., Ing-Simmons E., Chen R., Jeong H.W., Ozguldez H.O., Fan R., et al. Early developmental plasticity enables the induction of an intermediate extraembryonic cell state. Sci Adv. 2022;8 - PMC - PubMed
    1. Quintanal-Villalonga A., Chan J.M., Yu H.A., Pe’er D., Sawyers C.L., Sen T., et al. Lineage plasticity in cancer: a shared pathway of therapeutic resistance. Nat Rev Clin Oncol. 2020;17:360–371. - PMC - PubMed
    1. Ogawa S. Targeting lineage plasticity overcomes chemoresistance. Cancer Cell. 2022;40:905–907. - PubMed
    1. Watson P.A., Arora V.K., Sawyers C.L. Emerging mechanisms of resistance to androgen receptor inhibitors in prostate cancer. Nat Rev Cancer. 2015;15:701–711. - PMC - PubMed

LinkOut - more resources