. 2025 Mar;15(3):1589-1607.
doi: 10.1016/j.apsb.2024.12.027. Epub 2025 Jan 2.

Parkin inhibits iron overload-induced cardiomyocyte ferroptosis by ubiquitinating ACSL4 and modulating PUFA-phospholipids metabolism

Affiliations

Parkin inhibits iron overload-induced cardiomyocyte ferroptosis by ubiquitinating ACSL4 and modulating PUFA-phospholipids metabolism

Dandan Xiao et al. Acta Pharm Sin B. 2025 Mar.

Abstract

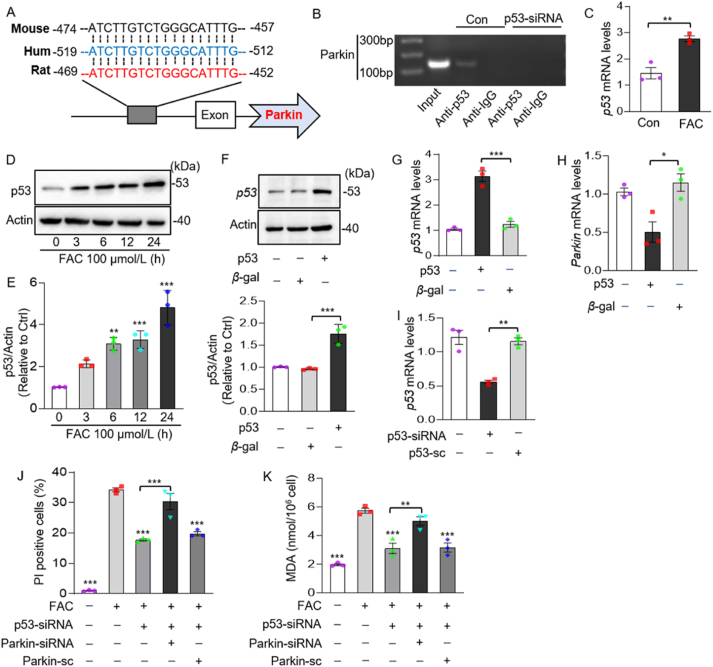
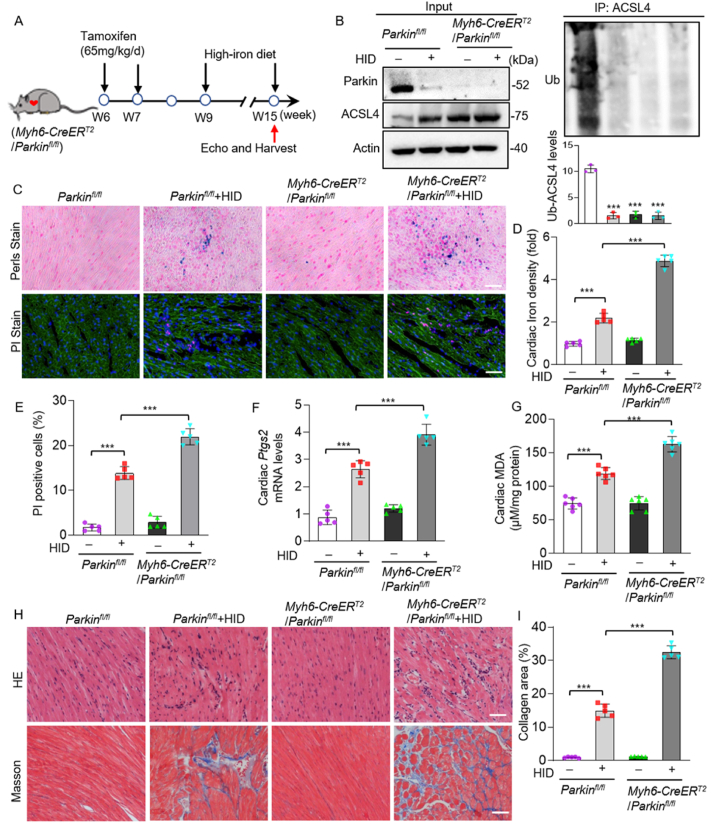
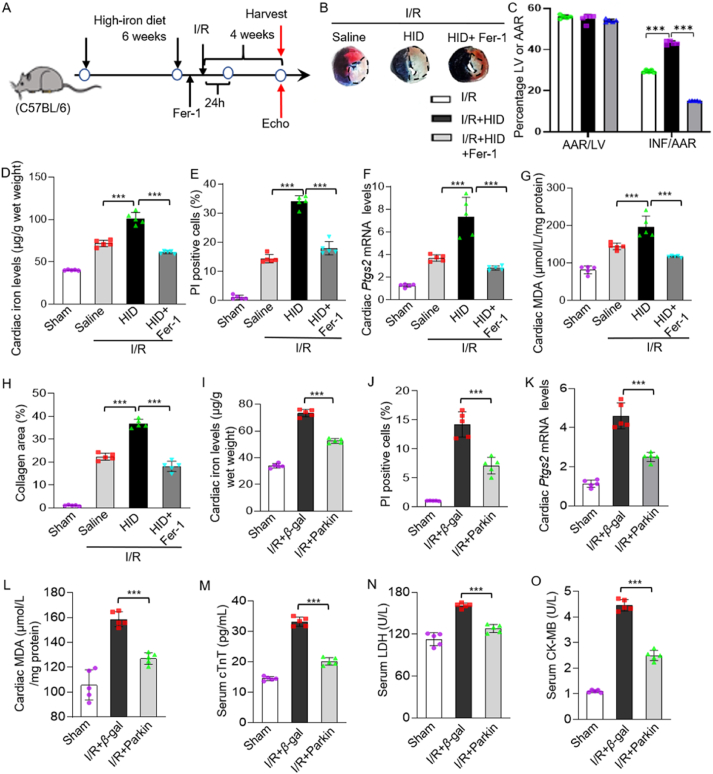
Iron overload is strongly associated with heart disease. Ferroptosis is a new form of regulated cell death indicated in cardiac ischemia-reperfusion (I/R) injury. However, the specific molecular mechanism of myocardial injury caused by iron overload in the heart is still unclear, and the involvement of ferroptosis in iron overload-induced myocardial injury is not fully understood. In this study, we observed that ferroptosis participated in developing of iron overload and I/R-induced cardiomyopathy. Mechanistically, we discovered that Parkin inhibited iron overload-induced ferroptosis in cardiomyocytes by promoting the ubiquitination of long-chain acyl-CoA synthetase 4 (ACSL4), a crucial protein involved in ferroptosis-related lipid metabolism pathways. Additionally, we identified p53 as a transcription factor that transcriptionally suppressed Parkin expression in iron-overloaded cardiomyocytes, thereby regulating iron overload-induced ferroptosis. In animal studies, cardiac-specific Parkin knockout mice (Myh6-CreER T2 /Parkin fl/fl ) fed a high-iron diet presented more severe myocardial damage, and the high iron levels exacerbated myocardial I/R injury. However, the ferroptosis inhibitor Fer-1 significantly suppressed iron overload-induced ferroptosis and myocardial I/R injury. Moreover, Parkin effectively protected against impaired mitochondrial function and prevented iron overload-induced mitochondrial lipid peroxidation. These findings unveil a novel regulatory pathway involving p53-Parkin-ACSL4 in heart disease by inhibiting of ferroptosis.

Keywords: ACSL4; Ferroptosis; Heart diseases; I/R; Iron overload; Mitochondrial; Parkin; p53.


Conflict of interest statement

The authors declare no conflict of interest.

Figures

Image 1
Graphical abstract
Figure 1
Figure 1
Iron overload induced cardiomyocyte ferroptosis and promoted hypoxic-reoxygenation (H/R)-induced cell death. (A–D) Cardiomyocytes H9c2 were treated with ferric ammonium citrate (FAC) at the indicated concentration. (A) Cell death was detected using PI staining assay. Representative images of PI-stained cells indicating cell death are shown on the left, and quantitative analysis of PI-positive cells is shown on the right. PI-positive myocyte nuclei are shown in red, while DAPI-stained nuclei are shown in blue. Scale bar: 100 μm. (B) Iron levels were measured using an iron detection reagent assay. (C) Lipid peroxidation was measured using an MDA reagent assay. (D, E) Ptgs2 mRNA and PTGS2 protein levels were measured using RT-PCR and immunoblot, quantification is shown in the lower panel. (F–H) Cardiomyocytes were treated with the ferroptosis inhibitor Fer-1 (10 μmol/L), necrosis inhibitor Nec-1 (1 μmol/L), and apoptosis inhibitor ZVAD (5 μmol/L) for 6 h, followed by treatment with 100 μmol/L FAC for 24 h. (F) Cell death was detected using PI staining assay. (G) Lipid peroxidation was measured using an MDA reagent assay. (H) Ptgs2 mRNA levels were measured using RT-PCR. (I–K) Iron treatment affected hypoxic–reoxygenation (H/R)-induced cardiomyocyte ferroptosis. Cardiomyocytes were hypoxic for 6 h and reoxygenated for 6 h. (I) Iron levels were measured using an iron detection reagent assay. Cardiomyocytes were treated with Fer-1 (10 μmol/L) for 6 h, and then treated with 25 μmol/L FAC for 24 h, followed by anoxic culture for 6 h and reoxygenation for 6 h. (J) Cell death was detected using PI staining assay. (K) Lipid peroxidation was measured using an MDA reagent assay. Data are presented as mean ± SD, ∗P < 0.05; ∗∗P < 0.01; ∗∗∗P < 0.001 significant, one-way ANOVA, n = 3.
Figure 2
Figure 2
Parkin inhibits ferroptosis induced by iron overload in vitro. (A, B) Cardiomyocytes H9c2 were treated with 100 μmol/L FAC at the indicated time, and the levels of Parkin mRNA (A) and protein (B) were detected using RT-PCR and immunoblot, quantification is shown in the lower panel. (C) C57BL/6 mice were fed with a high iron diet for 8 weeks, while control mice were fed a regular diet. Immunoblot was performed to measure the levels of Parkin protein, quantification is shown in the lower panel. n = 6 mice in each group. (D) The protein levels of Parkin were analyzed using immunoblot in cardiomyocytes that were transfected with a Parkin overexpression plasmid or a control plasmid (PcDNA3.1) for 24 h. (E–G) Cardiomyocytes were treated with 100 μmol/L FAC after transfection of Parkin overexpression plasmid or a control plasmid (PcDNA3.1) for 24 h. (E) Representative images of PI staining for cell death, (F) the quantitative analysis of PI-positive cells. PI-positive myocyte nuclei are shown in red, while DAPI-stained nuclei are shown in blue. Scale bar: 100 μm. (G) Lipid peroxidation was detected using the MDA reagent assay. (H) The levels of TFR1, SLC7A11, ACSL4 and GPX4 protein were detected using immunoblot. (I) The protein levels of Parkin were analyzed using immunoblot in cardiomyocytes that were transfected with a Parkin siRNA or a control SC for 24 h, quantification is shown in the lower panel. (J, K) Knockdown of Parkin through siRNA increased iron overload-induced cell death (J) and lipid peroxidation (K) in cardiomyocytes treated with 50 μmol/L FAC for 24 h. The data are presented as mean ± SD, ∗P < 0.05; ∗∗P < 0.01; ∗∗∗P < 0.001 significant, one-way ANOVA. n = 3.
Figure 3
Figure 3
Parkin regulates PUFA-phospholipids metabolism induced by iron overload. (A, B) Cardiomyocytes H9c2 were treated with 100 μmol/L FAC after transfection of Parkin overexpression plasmid 24 h. (A) Lipid composition and (B) PUFAs content in lipids were detected by lipomic analysis. (C) Cardiomyocytes were treated with C20:4, C22:5, C22:6 and 100 μmol/L FAC for 24 h after transfection of Parkin overexpression plasmid and control plasmid PcDNA3.1 24 h, samples were collected to detect lipid MDA levels. Data are expressed as mean ± SD, ∗P < 0.05; ∗∗P < 0.01; ∗∗∗P < 0.001 significant. n.s., not significant, one-way ANOVA. n = 3.
Figure 4
Figure 4
Parkin regulates ferroptosis sensitivity by shaping cellular lipid composition through ACSL4. (A, B) Cardiomyocytes H9c2 were treated with 100 μmol/L FAC after transfection of ACSL4-siRNA for 24 h. Student's t-test. n = 3. (A) Lipid composition and (B) polyunsaturated fatty acid content in lipids were detected by lipomic analysis. (C) Cardiomyocytes were treated with 100 μmol/L FAC at the indicated time, ACSL4 protein levels were detected by immunoblot, quantification is shown in the lower panel. (D–F) Cardiomyocytes were treated with 100 μmol/L FAC after transfection of ACSL4-siRNA for 24 h. (D) The protein levels of ACSL4 were analyzed by immunoblot, quantification is shown in the lower panel. (E) Cell death was detected by PI staining, (F) lipid peroxidation was detected by MDA reagent, one-way ANOVA. n = 3. (G) Enforced expression of Parkin inhibited ACSL4 protein levels by transfected with a Parkin overexpression plasmid or a control plasmid (PcDNA3.1) for 24 h in cardiomyocytes, quantification is shown in the lower panel. (H) The protein levels of ACSL4 were analyzed using immunoblot in cardiomyocytes that were transfected with ACSL4 overexpression plasmid or a control plasmid (PcDNA3.1) for 24 h, quantification is shown in the lower panel. (I, J) Enforced expression of Parkin inhibited cell death (I) and lipid peroxidation (J) in cardiomyocytes exposed to 100 μmol/L FAC, which was attenuated by overexpression of ACSL4. Data are expressed as mean ± SD, ∗P < 0.05; ∗∗P < 0.01; ∗∗∗P < 0.001 significant, one-way ANOVA. n = 3.
Figure 5
Figure 5
Parkin binds ACSL4 and catalyzes the ubiquitination of ACSL4. (A–C) Immunoprecipitation (IP) was used to detect the interaction between Parkin and ACSL4. (A) HEK 293T cells were transfected with Myc-ACSL4 along with GFP-Parkin or GFP plasmids, Myc-ACSL4 was immunoprecipitated with GFP and GFP-Parkin in HEK293T cells. (B) Cardiomyocytes H9c2 were transfected Parkin overexpressing plasmid or control PcDNA3.1, Parkin was immunoprecipitated with ACSL4 and Parkin in cardiomyocytes. (C) Cardiomyocytes were treated with 100 μmol/L FAC for 6 h, and the endogenous interaction between Parkin and ACSL4 was evaluated by IP. (D) Surface plasmon resonance (SPR) sensorgrams of the binding of an increasing amount of ACSL4 to Parkin ligand captured on a CM5 chip. (E–G) Parkin ubiquitination modified ACSL4. (E) Cardiomyocytes were transfected with HA-ubiquitin along with Parkin overexpression plasmid or control PcDNA3.1, respectively. Ubiquitination of ACSL4 was analyzed by IP in cardiomyocytes. (F) HEK293T cells were transfected with Myc-ACSL4 along with HA-ubiquitin and GFP-Parkin or GFP plasmids. The ubiquitination level of ACSL4 was analyzed by IP. (G) Parkin catalyzed polyubiquitination of the K48 linkage of ACSL4. HEK293T cells were transfected with Myc-ACSL4 along with HA-ubiquitin and GFP-Parkin or K48 ubiquitin or K63 ubiquitin. Ubiquitination of ACSL4 was analyzed by IP. n = 3 experiments per group.
Figure 6
Figure 6
p53 targets Parkin regulating iron overload-induced ferroptosis. (A, B) p53 binds to and transactivates the p53 responsive element in rat Parkin gene. (A) The putative binding site in mouse, human and rat Parkin gene predicted by the transcription factor website. Numbers indicate the nucleotide position relative to the ATG site. (B) ChIP analysis of interactions between p53 in rat Parkin gene in cardiomyocytes. Cardiomyocytes were transfected with p53-siRNA for 24 h, cells were harvested for the ChIP analysis. Chromatin-bound DNA was immunoprecipitated with the anti-p53 antibody. Anti-igG antibody was used as a negative control. (C–E) Cardiomyocytes H9c2 were treated with 100 μmol/L FAC for 24 h, p53 mRNA (C) and protein (D, E) levels were detected by RT-PCR and immunoblot. (E) The quantitative analysis of immunoblot. (F–H) p53 protein levels (F), quantification is shown on the right, p53 mRNA (G), and Parkin mRNA levels (H) were detected by immunoblot and RT-PCR after transfection of p53 overexpression virus and control β-gal 24 h. (F) p53 mRNA levels were detected after transfection of p53-siRNA and control p53-sc 24 h. (I–K) Knockdown of p53 by its siRNA inhibits iron overload-induced cell death (J) and lipid peroxidation (K) in cardiomyocytes exposed to 100 μmol/L FAC, which was attenuated by knockdown of Parkin. Data are expressed as mean ± SD, ∗P < 0.05; ∗∗P < 0.01; ∗∗∗P < 0.001 significant, one-way ANOVA. n = 3.
Figure 7
Figure 7
Iron-overloaded Myh6-CreERT2/Parkinfl/fl mice exhibit elevated levels of tissue ferroptosis and myocardial injury. (A) Schematic diagram showing the mouse model of Myh6-CreERT2/Parkinfl/fl high-iron diet. (A–I) Parkinfl/fl and Myh6-CreERT2/Parkinfl/fl mice were fed a high iron diet for 6 weeks, and control mice were fed a normal diet, (B) Immunoblot was performed to detect Parkin, ACSL4 protein levels, immunoprecipitation (IP) was used to detect the Parkin ubiquitination modified ACSL4, quantification is shown in the lower panel. (C) Perls staining to measure iron levels (Top), iron-positive are shown in blue, (D) quantification is shown on the right. Scale bar: 100 μm. (C, E) PI staining to measure cell death (Bottom). PI was injected into the mice to label positive cells 1 h before the execution. (C) Representative image of myocardial tissue section, (E) the quantitative analysis of PI-positive cells. PI-positive myocyte nuclei (red), 4′,6-diaminyl-2-phenylindole stained nuclei (blue), cardiomyocytes were labeled by α-actinin (green). Scale bar: 100 μm. (F) The Ptgs2 mRNA levels were detected by RT-PCR and (G) lipid peroxidation was detected by MDA reagent assay. (H) Cardiac tissue sections were prepared from the mice and stained with HE (Top) or Masson's trichrome staining (Bottom). Representative photomicrographs show collagen areas by Masson's trichrome staining (H). Collagen area was quantitatively analyzed (I). Scale bar: 100 μm. Data are expressed as mean ± SD, ∗P < 0.05; ∗∗P < 0.01; ∗∗∗P < 0.001 significant, one-way ANOVA. n = 5.
Figure 8
Figure 8
Fer-1 and Parkin attenuates I/R-induced myocardial injury. (A) Schematic diagram showing the mouse model of I/R injury. Representative images (B) and quantitative data (C) for infarct size (INF) and relative area at risk (AAR) in heart sections obtained from mice subjected to 30 min/24 h I/R injury and treated with saline (control) or Fer-1. Red, Danger Zone (AAR); White, infarct area (INF); Blue, non-hazardous area. (D) Cardiac iron levels, (E) cell death, (F) Ptgs2 mRNA levels, (G) MDA levels measured in mice subjected to sham surgery or 30 min/24 h I/R injury and treated with saline and Fer-1. (H) Masson's trichrome staining of heart sections obtained from mice subjected to sham surgery or 30 min/4 weeks I/R injury and treated with saline and Fer-1. (I–M) Mice were injected with Parkin overexpressing adenovirus or control β-gal via intravenous injection into the tail, after 3 weeks, the mice were subjected to sham or I/R surgery. Blood and heart samples were collected for measure (I) cardiac iron levels, (J) cell death, (K) Ptgs2 mRNA levels, (L) MDA levels, (M) cTnT levels, (N) LDH levels and (O) CK-MB levels. Data are expressed as mean ± SD, ∗P < 0.05; ∗∗P < 0.01; ∗∗∗P < 0.001 significant, one-way ANOVA. n = 5.

Similar articles

References

    1. Zhang C. Essential functions of iron-requiring proteins in DNA replication, repair and cell cycle control. Protein Cell. 2014;5:750–760. - PMC - PubMed
    1. Fernández Real J.M., López Bermejo A., Ricart W. Cross-talk between iron metabolism and diabetes. Diabetes. 2002;51:2348–2354. - PubMed
    1. Morales M., Xue X. Targeting iron metabolism in cancer therapy. Theranostics. 2021;11:8412–8429. - PMC - PubMed
    1. Zhang J., Song Y., Li Y., Lin H.B., Fang X. Iron homeostasis in the heart: molecular mechanisms and pharmacological implications. J Mol Cell Cardiol. 2023;174:15–24. - PubMed
    1. Ito J., Omiya S., Rusu M.C., Ueda H., Murakawa T., Tanada Y., et al. Iron derived from autophagy-mediated ferritin degradation induces cardiomyocyte death and heart failure in mice. Elife. 2021;10 - PMC - PubMed

LinkOut - more resources