. 2025 Mar;15(3):1608-1625.
doi: 10.1016/j.apsb.2024.12.019. Epub 2024 Dec 25.

CDK5-triggered G6PD phosphorylation at threonine 91 facilitating redox homeostasis reveals a vulnerability in breast cancer

Affiliations

CDK5-triggered G6PD phosphorylation at threonine 91 facilitating redox homeostasis reveals a vulnerability in breast cancer

Yuncheng Bei et al. Acta Pharm Sin B. 2025 Mar.

Abstract

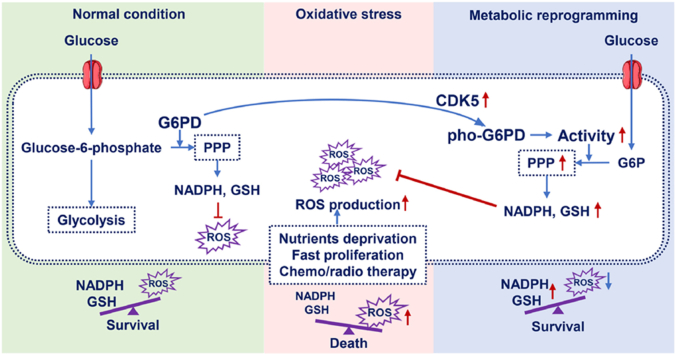
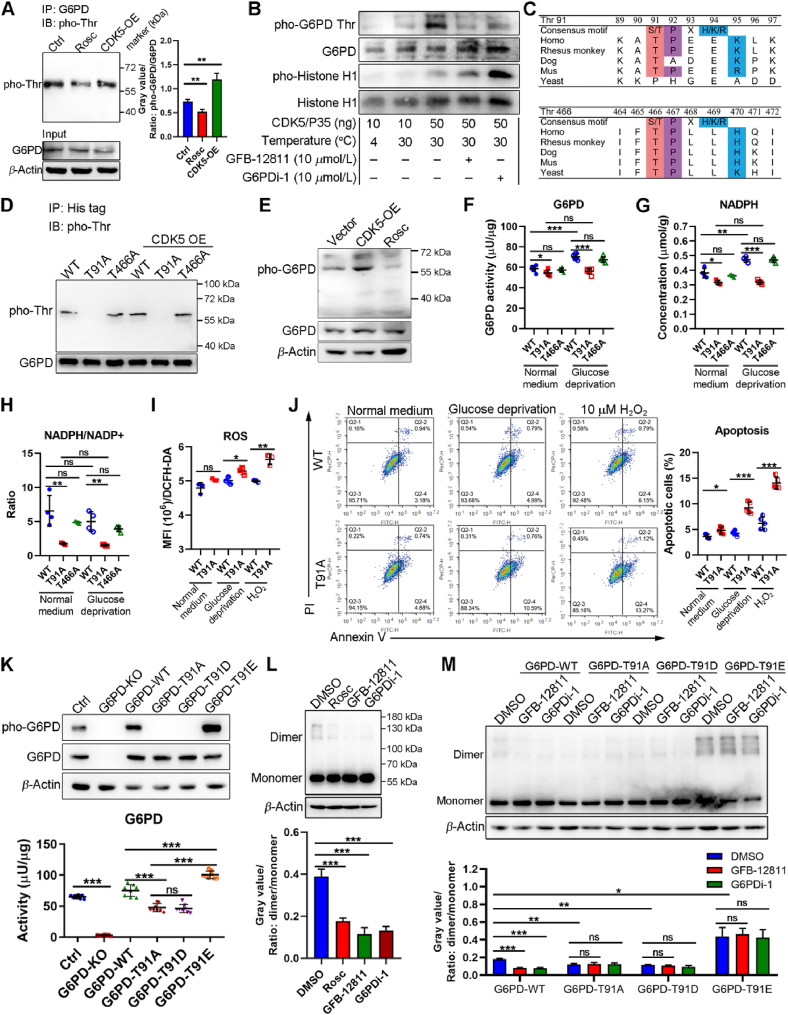
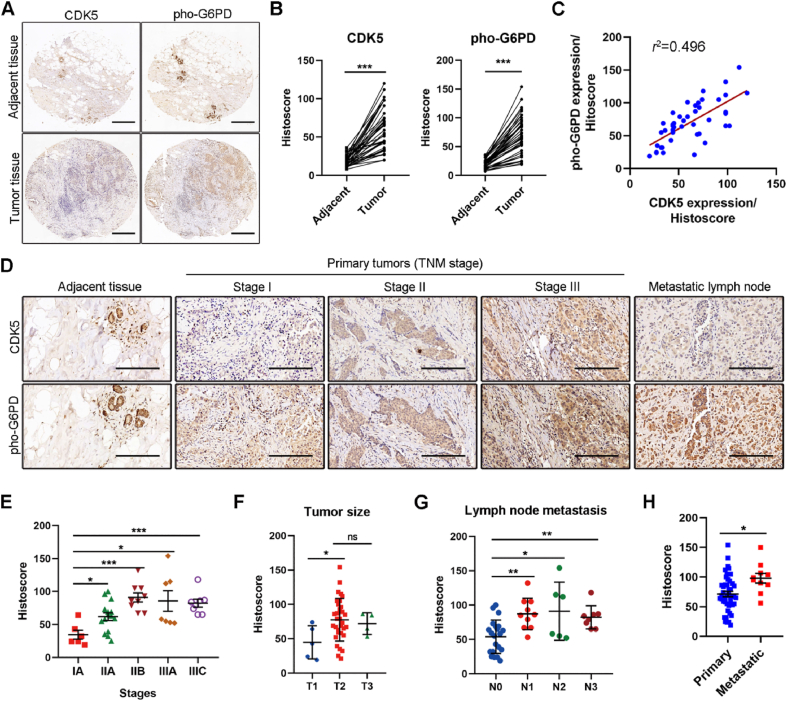
Glucose-6-phosphate dehydrogenase (G6PD), the first rate-limiting enzyme of the pentose phosphate pathway (PPP), is aberrantly activated in multiple types of human cancers, governing the progression of tumor cells as well as the efficacy of anticancer therapy. Here, we discovered that cyclin-dependent kinase 5 (CDK5) rewired glucose metabolism from glycolysis to PPP in breast cancer (BC) cells by activating G6PD to keep intracellular redox homeostasis under oxidative stress. Mechanistically, CDK5-phosphorylated G6PD at Thr-91 facilitated the assembly of inactive monomers of G6PD into active dimers. More importantly, CDK5-induced pho-G6PD was explicitly observed specifically in tumor tissues in human BC specimens. Pharmacological inhibition of CDK5 remarkably abrogated G6PD phosphorylation, attenuated tumor growth and metastasis, and synergistically sensitized BC cells to poly-ADP-ribose polymerase (PARP) inhibitor Olaparib, in xenograft mouse models. Collectively, our results establish the crucial role of CDK5-mediated phosphorylation of G6PD in BC growth and metastasis and provide a therapeutic regimen for BC treatment.

Keywords: Breast cancer; CDK5; Drug resistance; Glucose-6-phosphoate dehydrogenase; Intracellular redox homeostasis; Isotopomer spectral analysis; Olaparib; Pentose phosphate pathway.


Conflict of interest statement

The authors declare no conflicts of interest.

Figures

Image 1
Graphical abstract
Figure 1
Figure 1
CDK5 induces augmentation of PPP flux in BC cells. (A, B) Glucose consumption and lactate production of MDA-MB-231 cells after incubation with CDK5 inhibitor, Roscovitine (10 mg/mL), and GFB-12811 (10 mg/mL) (n = 6) for 24 h (A). MDA-MB-231 cells were transfected with a CDK5-expression vector. Glucose consumption and lactate production were analyzed (n = 6) (B). Total protein was used for normalization. DMSO treatment and transfection of the backbone vector were used as controls. (C–G) Isotopomer spectral analysis in MDA-MB-231 cells by using LC/MS to trace 13C labels from 1,2-13C2 glucose. Schematic image of atom mapping for 1,2-13C2 glucose tracing glycolysis, oxidative PPP, and non-oxidative PPP (C). White balls are 12C atoms. Shaded balls are 13C atoms, in which 13C atoms first entering oxidative PPP are red, and those first entering glycolysis are blue. Heatmap of metabolite levels from MDA-MB-231 cells with the indicated treatments (Ctrl, transfected by vector and treated with DMSO; Rosc, transfected by vector and treated with 10 mg/mL Rosc; CDK5-OE, overexpressed CDK5 and treated with DMSO; GFB-12811, transfected by vector and treated with 10 mg/mL GFB-12811) (D). Boxplots of the fractional contributions of G6P (E), F6P (F), and Ru5P (G) within the [M+0], [M+1] and [M+2] isotopologues derived from 1,2-13C2 glucose extracted from MDA-MB-231 cells with indicated treatment, (n = 5). Data are presented as mean ± SEM. Statistical significance was calculated using the one-way ANOVA (A), the student's t-test (B), and the two-way ANOVA (E–G). ns, not significant, ∗P < 0.05; ∗∗P < 0.01; ∗∗∗P < 0.001.
Figure 2
Figure 2
CDK5 consolidates intracellular redox homeostasis by enhancing G6PD activity. (A–C) MDA-MB-231 cells were treated with Rosc (10 μmol/L), GFB-12811 (10 μmol/L), and G6PDi-1 (10 μmol/L) for 24 h G6PD enzymatic activity (A), intracellular NADPH and NADP + production, the NADPH/NADP + ratio (B), the GSH level, and the GSH/GSSG ratio (n = 6–8) (C) were examined via indicated kits. Total protein was used for normalization. (D–E) Flow cytometric analysis of ROS level in cells from (A). A representative image is shown (D). Intracellular ROS levels in tumor cells incubated with indicated treatment, plus different concentrations of H2O2, were tested via flow cytometry and semi-quantified according to MFI (E) (n = 4). (F, G) Apoptosis in cells from (E) was analyzed via flow cytometry (n = 3). Representative images (F) and quantification data (G) are shown. (H, I) H2O2 dose-response curve of tumor cells exposed to the indicated treatment. MDA-MB-231 cells (105 cells/well) were pretreated with CDK5 inhibitor (Rosc, 10 μmol/L; GFB-12811, 10 μmol/L; G6PDi-1, 10 μmol/L) for 12 h, and subsequently added with indicated concentration of H2O2 for 24 h. Cell viability was determined via CCK-8 assay. The IC50 was calculated. (J) Immunoblot analysis of apoptosis-related protein, pro-/cleaved-PARP, and active caspase-3 expression in BC cells exposed to the indicated treatment described in (H, I). β-Actin was used as a loading control. (K) MDA-MB-231 cells (105 cells/well) were transfected with G6PD-expression vector and subsequently incubated with Rosc (10 μmol/L), GFB-12811 (10 μmol/L), G6PDi-1 (10 μmol/L), plus 10 μmol/L H2O2 for 24 h, with or without NAC (5 μmol/L). Cell viability was examined via CCK-8. Data are presented as mean ± SEM. Statistical significance was calculated using the One-way ANOVA (A–C, G, and K) and the two-way ANOVA (E, H, I). ns, not significant, ∗P < 0.05; ∗∗P < 0.01; ∗∗∗P < 0.001.
Figure 3
Figure 3
CDK5 protects BC cells against glucose deprivation. (A) Bright-field images of MDA-MB-231 cells cultured in glucose deprivation medium containing Rosc (10 μmol/L), GFB-12811 (10 μmol/L), or G6PDi-1 (10 μmol/L) for 24 h. Scale bar = 20 μm. (B, C) Cells from (A) were subjected to flow cytometric analysis. Representative flow cytometric images (B) and quantification data (C) are shown (n = 3). (D–G) Intracellular ROS levels (D), G6PD activity (E), ratio of NADP+/NADPH (E), and ratio of GSH/GSSG (G) in cells from (A) were examined (n = 6). (H) MDA-MB-231 cells were transfected with G6PD or the vector control and then pretreated with Rosc (10 μmol/L), GFB-12811 (10 μmol/L), or G6PDi-1 (10 μmol/L) for 24 h, subsequently cultured with the glucose-free medium. Different concentrations of glucose were supplemented. Cell viability was examined via CCK-8 assay. (I) Immunoblot analysis of apoptotic marker (pro/cleaved-PARP, active caspase-3), CDK5, CDK5R1, and G6PD expression in cells from (A). β-Actin was used as a loading control. (J, K) MDA-MB-231 cells were transfected with CDK5 and the vector control and then were cultured with a normal medium or glucose-free medium for glucose deprivation for 24 h. Cells were harvested and subjected to immunoblot to analyze CDK5 and G6PD expression (J, top). Cell viability of the indicated cells cultured in glucose deprivation was determined by CCK-8 assay (H, bottom). Flow cytometry analyzed the apoptosis of cells from (J). Representative images and quantification data are shown (K). Data are presented as mean ± SEM. Statistical significance was calculated using the two-way ANOVA (C–H, J, K). ns, not significant, ∗P < 0.05; ∗∗P < 0.01; ∗∗∗P < 0.001.
Figure 4
Figure 4
CDK5-induced phosphorylation of G6PD at Thr-91 facilitates G6PD activation and promotes tolerance to oxidative stress. (A) Immunoblot analysis of threonine phosphorylation of G6PD. MDA-MB-231 cells were transfected with CDK5-OE vector or incubated with Rosc (10 μmol/L) for 24 h. Total G6PD protein was immunoprecipitated and subsequently detected by P-Thr-Pro-101 mAb. Input G6PD was detected by anti-G6PD antibody. β-Actin was analyzed as a loading control. G6PD phosphorylation was semi-quantified (pho-G6PD/total G6PD) via ImageJ (n = 3). (B) In vitro kinase assay determined that CDK5 directly phosphorylated G6PD as described in the method. (C) G6PD threonine 91 and 466 are conserved and match with the CDK5 consensus motif. (D) MDA-MB-231 cells were transfected with His-tag-labelled G6PD-WT, G6PD-T91A, or G6PD-T466A, with or without CDK5 overexpression. The exogenous WT and mutated G6PD protein were purified via BeyoGold His-tag Purification Resin and examined via immunoblotting as described in (A). Input G6PD was detected by an anti-G6PD antibody. (E) Immunoblotting analysis of G6PD phosphorylation at Thr-91 using mouse polyclonal antibody prepared in this study. G6PD was detected by an anti-G6PD antibody. β-Actin was used as a loading control. (F–J) MDA-MB-231 cells were transfected with G6PD-WT, G6PD-T91A, or G6PD-T466A and then were incubated using the normal medium and glucose-free medium, with or without H2O2 administration. G6PD (F), NADPH (G), ratio of NADPH/NADP+ (H), ROS (I), and apoptosis (J) were determined. (K) Transgenic MDA-MB-231 cells with G6PD T91 site mutation were prepared for immunoblotting analysis of G6PD, pho-G6PD at the T91 site in prepared transgenic cells (top). G6PD activity in each cell line was examined (bottom) (n = 6). (L, M) MDA-MB-231 cells were pretreated as indicated and then incubated with 1 μmol/L disuccinimidyl suberate (DSS). The total protein was subsequently extracted and subjected to a Western blot to analyze dimeric and monomeric G6PD. The ratio (dimer/monomer) was calculated via ImageJ according to gray value. Data are presented as mean ± SEM. Statistical significance was calculated using the one-way ANOVA (A, K–M), and two-way ANOVA (F–J). ns, not significant, ∗P < 0.05; ∗∗P < 0.01; ∗∗∗P < 0.001.
Figure 5
Figure 5
G6PD phosphorylation promotes tumor growth and lung metastasis of BC in vivo. (A) Schematic image of a xenograft mouse model established via implantation of MDA-MB-231 cells (5 × 106 cells/mouse) those overexpressing G6PD-WT (WT-OE), or G6PD-T91A (T91A-OE) respectively (n = 6). (B) Representative bioluminescence images of xenograft mice on Days 7 and 21 after tumor implantation (left). Mean tumor volume was recorded at the indicated times (right). (C) Representative photographs of tumor tissues isolated at the time of termination of the experiment (left; Scale bar = 1 cm). Tumor weight is presented (right). (D, E) WT-OE, T91A-OE cells from (A) were used for the establishment of a lung metastasis model via tail vein injection (2 × 106 cells/mouse) (n = 6). Metastatic progression was shown by bioluminescence imaging (D). Representative pictures of hematoxylin and eosin-stained (HE) sections of lung tissues (E, left). Quantification of pulmonary metastatic nodules (E, right). Scale bar = 500 μm. Data are presented as mean ± SEM. (F, G) Transgenic MDA-MB-231 cells with G6PD site mutation were used for the generation of a xenograft mouse model and lung metastasis model as described in (A) and (D) (n = 6). Representative photographs of tumor tissues isolated at the time of termination of the experiment (left; Scale bar = 1 cm) (F, left). Mean tumor volume was recorded at the indicated times (F, right). Representative bioluminescence images of xenograft mice on Days 7 and 21 after tumor implantation (G, left). Quantification of pulmonary metastatic nodules (G, right). Data are presented as mean ± SEM. Statistical significance was calculated using the student's t-test (C and E), one-way ANOVA (G), and two-way ANOVA (B, F). ns, not significant, ∗P < 0.05; ∗∗P < 0.01; ∗∗∗P < 0.001.
Figure 6
Figure 6
G6PD phosphorylation is implicated in human BC development. (A) Immunohistochemistry detection of G6PD phosphorylation at Thr-91 site, as well as CDK5, in tissue microarrays. Representative IHC images of G6PD phosphorylation, and CDK5 expression in human BC tumor tissues and paired adjacent normal tissues (n = 45). Scale bar = 500 μm. (B) Histoscores for G6PD phosphorylation, and CDK5 expression are summarized. (C) Correlation of CDK5 expression and G6PD phosphorylation (Pearson's correlation coefficient R was shown). (D, E) Representative IHC images of CDK5 expression, and G6PD phosphorylation at Thr-91 site in tumor tissues within different stages (D). Histoscores for each specimen are summarized according to TNM stages (E) (IA, n = 6; IIA, n = 15; IIB, n = 9; IIIA, n = 7; IIIC, n = 8). Scale bar = 100 μm. (F–H) The level of G6PD phosphorylation at Thr-91 site in tumor tissues with different tumor sizes (T1, n = 7; T2, n = 34; T3, n = 4) (F) or different percentages of lymph node metastasis (N0, n = 21; N1, n = 10; N2, n = 6; N3, n = 8) (G) were semi-quantitated by Histoscore. G6PD phosphorylation level was also detected in primary tumors and metastatic tumors (n = 10) (H). Data are present as mean ± SEM. Statistical significance was calculated using the student's t-test (A) and one-way ANOVA (C, D). ns, not significant, ∗P < 0.05; ∗∗P < 0.01; ∗∗∗P < 0.001.
Figure 7
Figure 7
Pharmacological inhibition of G6PD phosphorylation synergistically enhances conventional anticancer therapeutic efficacy in BC. (A) MDA-MB-231 cells were treated with conventional anticancer agents as indicated. Flow cytometric analysis of intracellular ROS levels (Top) and MFI was summarized (bottom). (B) Transgenic MDA-MB-231 cells with G6PD T91 site mutation were treated with different concentrations of Berberine (top) and Olaparib (bottom) for 24 h. Cell viability was determined by using CCK-8 assay. (C) MDA-MB-231 cells were incubated with CDK5 inhibitor (CDK5, or GFB-12811) and Berb (or Olaparib), individually or in combination at the indicated concentration for 24 h. Cell viability was examined by CCK-8. (D) Cells from (C) were harvested and subjected to immunoblotting for analysis of the expression of phosphorylated G6PD at Thr-91 site, G6PD, CDK5, apoptosis-related pro-/cleaved-PARP, active caspase-3, as well as γH2AX. (E, F) In vivo analysis of the therapeutic effects of CDK5 inhibitor (Rosc, or GFB-12811) with/without Olaparib in the xenograft mouse model (n = 6). Representative bioluminescence images of xenograft mice on Days 7 and 28 after tumor implantation (E). Representative photographs of tumor tissues isolated at the end of the experiment. Scale bar = 1 cm. (F, top). Mean tumor volume was recorded at the indicated times (F, bottom). (G) Representative IHC images for detection of Ki-67, G6PD phosphorylation, and γH2AX in tumor tissues isolated from mice (E). Apoptosis was detected by IHC analysis of active caspase-3 and TUNEL assay. Scale bar = 50 μm. Data are presented as mean ± SEM. Statistical significance was calculated using the two-way ANOVA (B–E), and one-way ANOVA (F). ns, not significant, ∗P < 0.05; ∗∗P < 0.01; ∗∗∗P < 0.001.

Similar articles

References

    1. Hanahan D., Weinberg Robert A. Hallmarks of cancer: the next generation. Cell. 2011;144:646–674. - PubMed
    1. de Mas I.M., Aguilar E., Jayaraman A., Polat I.H., Martin-Bernabe A., Bharat R., et al. Cancer cell metabolism as new targets for novel designed therapies. Future Med Chem. 2014;6:1791–1810. - PubMed
    1. Patra K.C., Hay N. The pentose phosphate pathway and cancer. Trends Biochem Sci. 2014;39:347–354. - PMC - PubMed
    1. Zhang L., Ye B., Chen Z., Chen Z.S. Progress in the studies on the molecular mechanisms associated with multidrug resistance in cancers. Acta Pharm Sin B. 2023;13:982–997. - PMC - PubMed
    1. Cho E.S., Cha Y.H., Kim H.S., Kim N.H., Yook J.I. The pentose phosphate pathway as a potential target for cancer therapy. Biomol Ther. 2018;26:29–38. - PMC - PubMed

LinkOut - more resources