

Life expectancy and survival analysis for companion dogs and cats in Seoul, South Korea
- PMID: 40370825
- PMCID: PMC12075304
- DOI: 10.3389/fvets.2025.1532422
Life expectancy and survival analysis for companion dogs and cats in Seoul, South Korea
Abstract
Background: Investigating life expectancy and mortality is crucial for the development of evidence-based health strategies for companion animals. However, relevant studies are lacking in South Korea, possibly because of challenges in collecting mortality data. In this regard, preliminary analyses were conducted to obtain life tables for companion animals in South Korea.
Methods: The electronic records of six veterinary hospitals in Seoul, South Korea were examined. The data collected included breed, sex, spay/neuter status, date of birth, and date of death for all dogs and cats with a verifiable date of death since November 1, 2004 until December 31, 2022. After data preprocessing, descriptive statistical analysis was performed to summarize the demographics, and life tables and survival curves were created for dogs and cats. Cox proportional hazards regression was used to analyze the effects of demographic factors on survival.
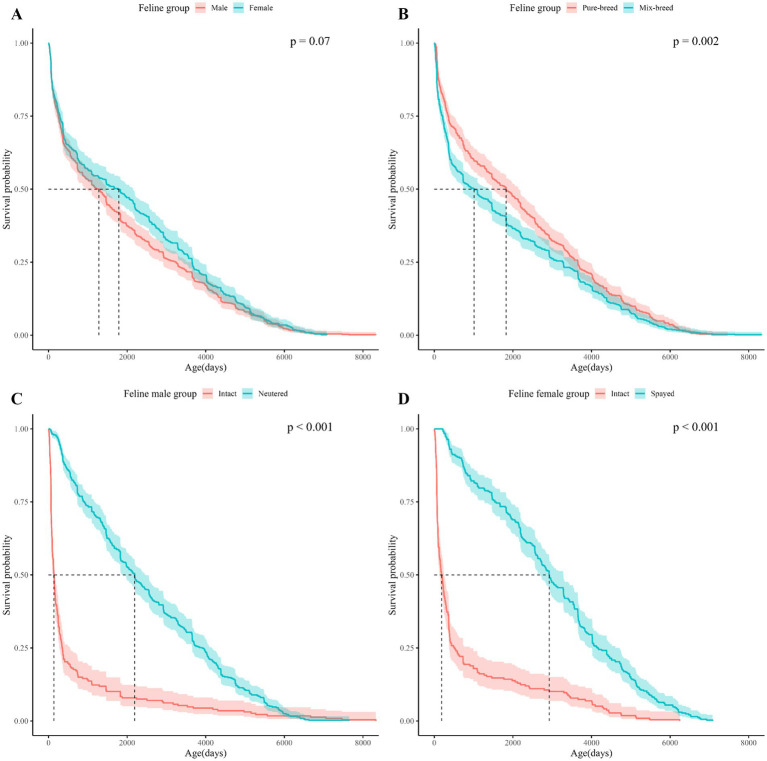
Results: The mean age of dogs at death was 3427.49 days. Spayed or neutered dogs had a significantly higher life expectancy than intact dogs. Mixed-breed dogs had a higher life expectancy than purebred dogs. For cats, the mean age at death was 1965.49 days, with spayed or neutered cats living significantly longer than intact cats. Purebred cats had a higher median survival than Mixed-breed cats. Spaying or neutering and breed significantly affected survival probabilities in both species.
Conclusion: Our study provides insights into the longevity of companion animals in South Korea, and reveals that neutering and breed significantly influence life expectancy.
Keywords: companion cats; companion dogs; life expectancy; life tables; survival analysis.
Copyright © 2025 Yang, Yoo and Min.
Conflict of interest statement
The authors declare that the research was conducted in the absence of any commercial or financial relationships that could be construed as a potential conflict of interest.
Figures


Similar articles
-
Life expectancy of cats in Britain: moggies and mollies live longer.PeerJ. 2025 Jan 30;13:e18869. doi: 10.7717/peerj.18869. eCollection 2025. PeerJ. 2025. PMID: 39897493 Free PMC article.
-
Life tables of annual life expectancy and risk factors for mortality in cats in the UK.J Feline Med Surg. 2024 May;26(5):1098612X241234556. doi: 10.1177/1098612X241234556. J Feline Med Surg. 2024. PMID: 38714312 Free PMC article.
-
Demographics of dogs, cats, and rabbits attending veterinary practices in Great Britain as recorded in their electronic health records.BMC Vet Res. 2017 Jul 11;13(1):218. doi: 10.1186/s12917-017-1138-9. BMC Vet Res. 2017. PMID: 28693574 Free PMC article.
-
Decision-Making on Recommended Age of Spay/Neuter for a Specific Dog: General Principles and Cultural Complexities.Vet Clin North Am Small Anim Pract. 2023 Sep;53(5):1209-1221. doi: 10.1016/j.cvsm.2023.05.005. Epub 2023 Jun 15. Vet Clin North Am Small Anim Pract. 2023. PMID: 37330274 Review.
-
Spay/neuter laws as a debated approach to stabilizing the populations of dogs and cats: An overview of the European legal framework and remarks.J Appl Anim Welf Sci. 2024 Apr-Jun;27(2):281-293. doi: 10.1080/10888705.2022.2081807. Epub 2022 May 31. J Appl Anim Welf Sci. 2024. PMID: 35642302 Review.
References
LinkOut - more resources
Full Text Sources
Miscellaneous