. 2024 Nov 19;12(2):uhae315.
doi: 10.1093/hr/uhae315. eCollection 2025 Feb.

Loss-of-function mutations in the fruit softening gene POLYGALACTURONASE1 doubled fruit firmness in strawberry

Affiliations

Loss-of-function mutations in the fruit softening gene POLYGALACTURONASE1 doubled fruit firmness in strawberry

Nicolás P Jiménez et al. Hortic Res. .

Abstract

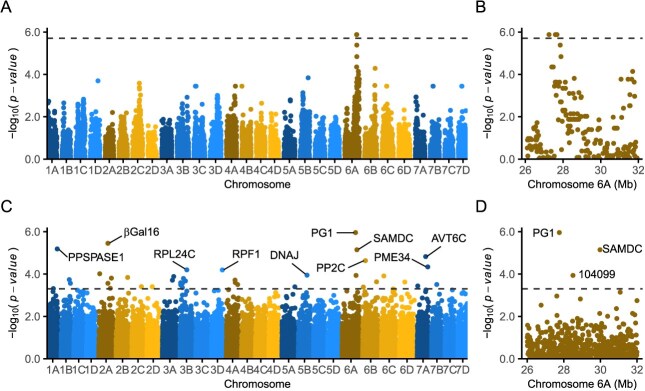
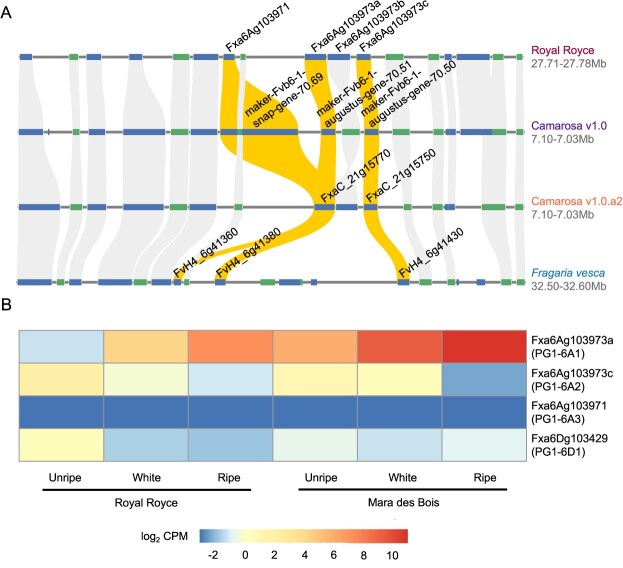
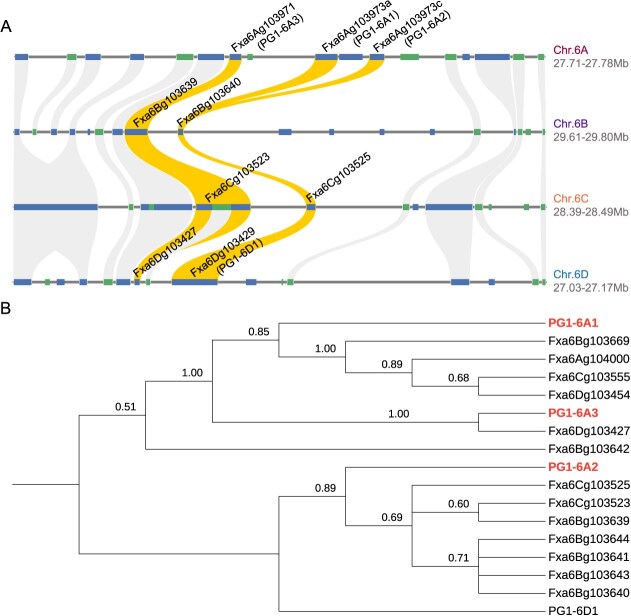
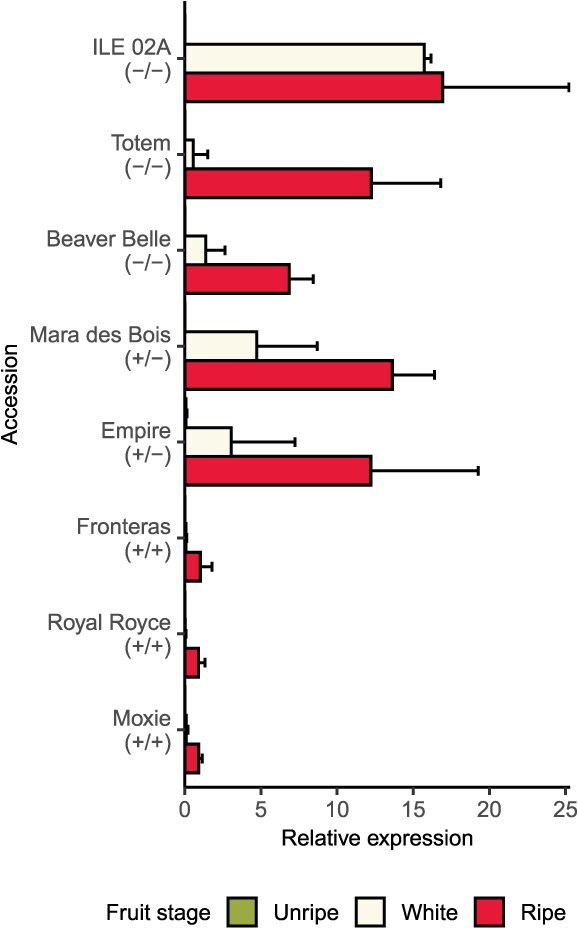
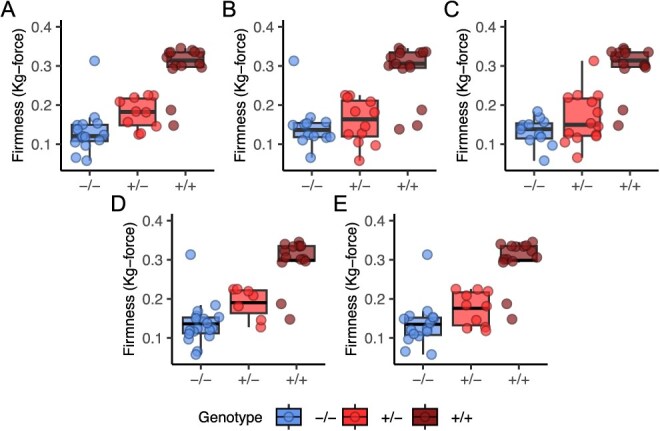
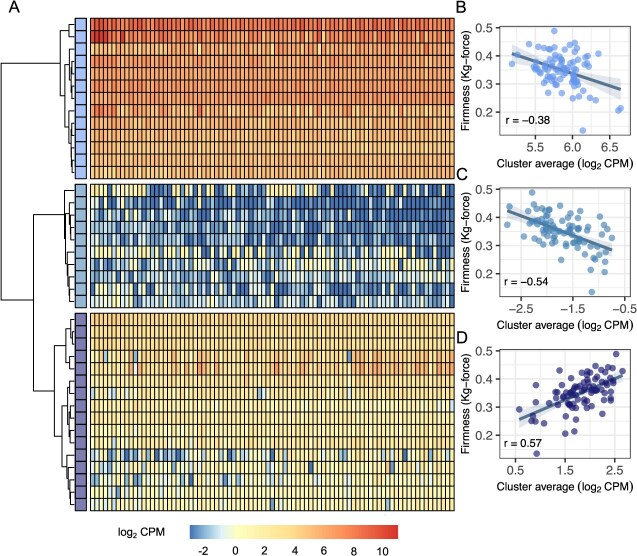
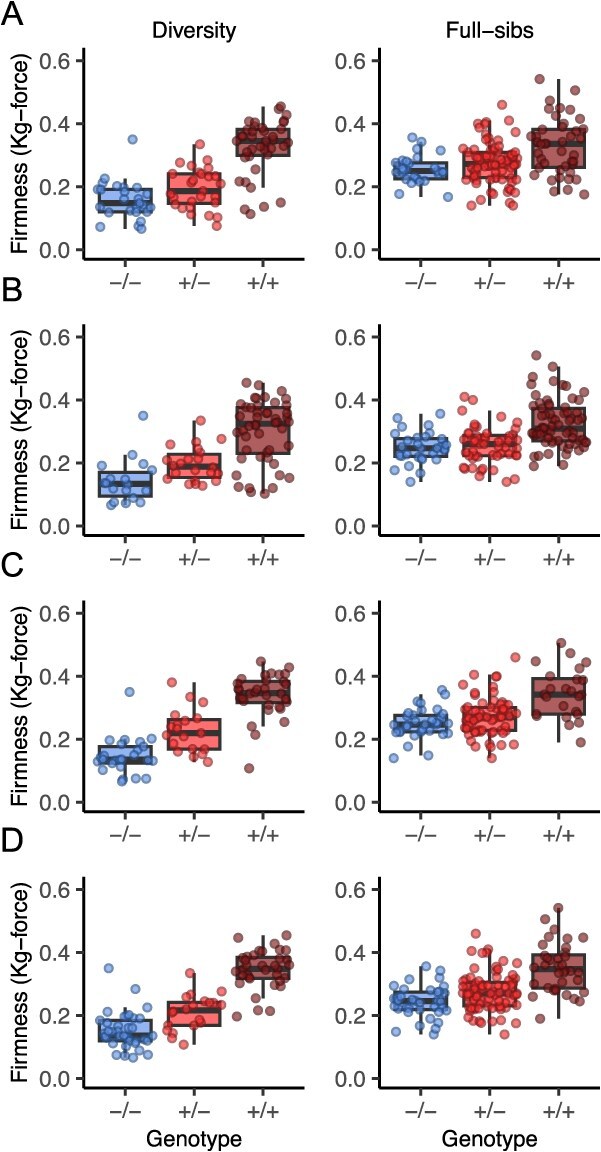
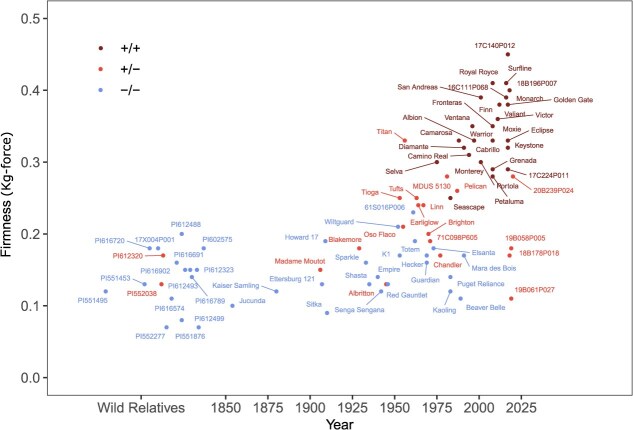
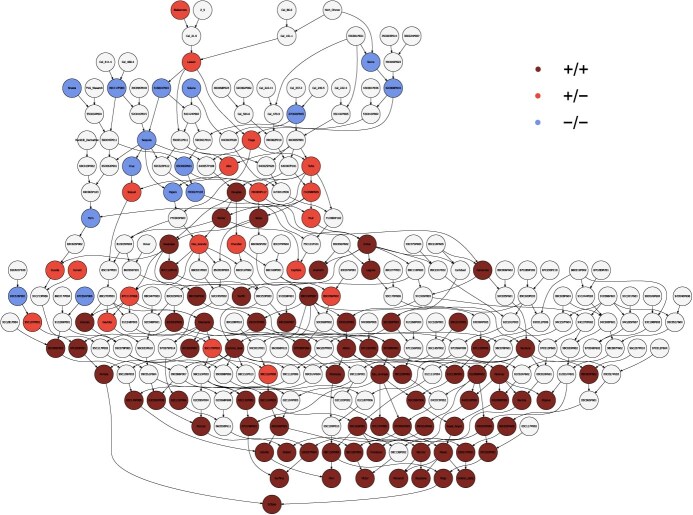
Wildtype fruit of cultivated strawberry (Fragaria [Formula: see text] ananassa) are typically soft and highly perishable when fully ripe. The development of firm-fruited cultivars by phenotypic selection has greatly increased shelf-life, decreased postharvest perishability, and driven the expansion of strawberry production worldwide. Hypotheses for the firm-fruited phenotype include mutations affecting the expression of genes encoding polygalacturonases (PGs) that soften fruit by degrading cell wall pectins. Here we show that loss-of-function mutations in the fruit softening gene POLYGALACTURONASE1 (FaPG1; PG1-6A1) double fruit firmness in strawberry. PG1-6A1 was one of three tandemly duplicated PG genes found to be in linkage disequilibrium (LD) with a quantitative trait locus (QTL) affecting fruit firmness on chromosome 6A. PG1-6A1 was strongly expressed in soft-fruited (wildtype) homozygotes and weakly expressed in firm-fruited (mutant) homozygotes. Genome-wide association, quantitative trait transcript, DNA sequence, and expression-QTL analyses identified genetic variants in LD with PG1-6A1 that were positively correlated with fruit firmness and negatively correlated with PG1-6A1 expression. An Enhancer/Suppressor-mutator (En/Spm) transposable element insertion was discovered upstream of PG1-6A1 in mutant homozygotes that we hypothesize transcriptionally downegulates the expression of PG1-6A1. The PG1-6A1 locus was incompletely dominant and explained 26-76% of the genetic variance for fruit firmness among phenotypically diverse individuals. Additional loci are hypothesized to underlie the missing heritability. Highly accurate codominant genotyping assays were developed for modifying fruit firmness by marker-assisted selection of the En/Spm insertion and single nucleotide polymorphisms associated with the PG1-6A1 locus.


Conflict of interest statement

The authors declare no conflicts of interest.

Figures

Figure 1
Figure 1
GWAS and QTT analyses identify genetic variants associated with phenotypic variation for fruit firmness and transcripts associated with differentially expressed genes among soft- and firm-fruited individuals (formula image). Study population individuals were genotyped for 49 330 SNPs physically anchored to the FaRR1 reference genome. (A) The GWAS Manhattan plot illustrates SNPs associated with fruit firmness across the strawberry genome (physical positions of array-genotyped SNP on the x-axis are shown in the FaRR1 reference genome). GWAS was applied to phenotypic means estimated from 24 observations/individual using a Bonferroni-corrected significance threshold of 5.7 (depicted by the horizontal dashed line). (B) The physical positions of SNPs associated with phenotypic variation for fruit firmness are shown for Mb 26–32 on chromosome 6A. (C) The QTT Manhattan plot was constructed from analyses of 59 126 transcripts mapped in the FaRR1 reference genome using mRNAs isolated from ripe fruit of soft- or firm-fruited individuals in the study population (formula image). QTT was applied to transcript counts estimated from short-read mRNA sequences using a Bonferroni-corrected significance threshold of 3.3 (depicted by the horizontal dashed line). The differentially expressed genes labeled in the QTT Manhattan plot are pyrophosphate-specific phosphatase1, formula image-galactosidase 16 (formula imageGal16), ribosomal protein L24C, RNA processing factor 1, chaperone DnaJ-domain, PG1, SAMDC, protein phosphatase 2c, pectin methylesterase 34, and amino acid transporter avt6c. (D) The physical positions of differentially expressed genes are shown for Mb 26–32 on chromosome 6A. Fxa6Ag104099 (abbreviated 104 099) is a gene of unknown function.
Figure 2
Figure 2
Annotations and physical positions of PG genes in LD with a fruit firmness QTL on chromosome 6A in octoploid strawberry. (A) Organization and synteny of three tandemly duplicated PG-encoding genes on chromosome 6A in the ‘Royal Royce’ and ‘Camarosa’ genomes and chromosome 6 in the ‘Hawaii 4’ F. vesca genome. (B) Transcript CPM for four PG-encoding genes observed in the soft-fruited cultivar ‘Mara des Bois’ and firm-fruited cultivar ‘Royal Royce’. CPMs were estimated from short-read RNA sequences normalized for sequencing depth.
Figure 3
Figure 3
Local synteny and phylogenetic tree. A) Synteny analysis of homoeologous PG1 genes across strawberry subgenomes using the ‘Royal Royce’ reference genome. Syntenic relationships among PG1 genes in the four subgenomes are indicated by connecting lines. B) Evolutionary relationships among homoeologous PG1 genes. The tandemly duplicated PG1 genes found on chromosome 6A are shown in red. The tree was constructed using amino acid sequences of homoeologous PG1 genes identified in the ‘Royal Royce’ genome. The numbers shown at nodes are bootstrap support for branches estimated from 1000 bootstrap samples.
Figure 4
Figure 4
Quantitative RT-PCR analyses of PG1-6A1 transcripts observed in unripe to ripe fruit of strawberry cultivars with different PG1-6A1 genotypes and fruit firmness phenotypes. The PG1-6A1 genotypes shown for each cultivar were predicted by genotypes of the En/Spm INDEL upstream of PG1-6A1 and by phenotypic means for fruit firmness, where −/− are unfavorable allele homozygotes, +/− are heterozygotes, and +/+ are favorable allele homozygotes. The relative expression (RE) of PG1-6A1 was estimated from analyses of three technical replicates/biological replicate formula image three biological replicates/stage/cultivar using a DNA-binding protein as a reference control. The bar depicts the mean, whereas the needle depicts one standard deviation from the mean. The bars and needles are barely perceptible in the unripe-green fruit stage for every PG1-6A1 genotype and in the unripe-white fruit stage for mutant homozygotes (PG1-6A1+/PG1-6A1+) because the expression of PG1-6A1 was exceptionally weak in those samples.
Figure 5
Figure 5
Fruit firmness variation among 43 soft- to firm-fruited individuals genotyped for an En/Spm INDEL and SNPs associated with the PG1-6A1 locus on chromosome 6A. Genetic variants were genotyped using GBS. The points display phenotypic means (EMMs) estimated from five biological replicates (clones)/individual, five harvests, and three subsamples/replicate/harvest among greenhouse grown plants of the DNA sequenced individuals (11 observations/individual). The box displays the genotypic median and interquartile range within each genotypic class, where −/− are unfavorable allele homozygotes, +/− are heterozygotes, and +/+ are favorable allele homozygotes. (A) SNP interrogated by AX-184953741, one of four Axiom 50 K array SNP markers identified by GWAS found upstream of PG1-6A1 and in complete LD with one another. (B) SNP interrogated by AX-184210676, one of four Axiom 50 K array SNP markers identified by GWAS found upstream of PG1-6A1 and in complete LD with one another. (C) A 4948-bp En/Spm INDEL 3926 bp upstream of PG1-6A1. (D) A G/T SNP in the 5′-UTR of PG1-6A1. (E) SNP interrogated by AX-184242253, an Axiom 50 K array SNP marker identified by expression-QTL analysis found downstream of PG1-6A1.
Figure 6
Figure 6
Co-expression network analysis of transcripts in ripe fruit of 85 discovery population individuals. (A) Transcript abundance heat map for genes in the PG1-6A1 PG co-expression network (upper panel) and two other networks identified by co-expression analysis (middle and lower panels) using hierarchical cluster analysis. (B) The correlation between transcript abundance and fruit firmness for genes in the co-expression network is shown in the upper panel of A. (C) The correlation between transcript abundance and fruit firmness for genes (nodes) in the co-expression network is shown in the middle panel of A. (D) The correlation between transcript abundance and fruit firmness for genes (nodes) in the co-expression network is shown in the lower panel of A.
Figure 7
Figure 7
Fruit firmness variation among 92 soft- to firm-fruited individuals (the diversity population; left column) and 152 full-sib progeny (the full-sib population; right column) genotyped with KASP markers developed for an En/Spm INDEL and SNPs associated with the PG1-6A1) locus. The points display phenotypic means (EMMs) for 92 individuals in the diversity population (four observations/individual) and 152 individuals in the full-sib population (six observations/individual). The box displays the genotypic median and interquartile range within each genotypic class for each KASP marker, where −/− are unfavorable allele homozygotes, +/− are heterozygotes, and +/+ are favorable allele homozygotes. Genotypes and phenotypes are shown for four KASP markers associated with the PG1-6A1 locus: (A) K-676 (bp 27 676 285), K-SPM (bp 27 743 085), K-732 (bp 27 751 732), and K-253 (bp 27 888 596).
Figure 8
Figure 8
Fruit firmness phenotypes of wild relatives, cultivars, and other genetic resources of cultivated strawberry originating 1850 to present. The birth years of F.  formula image  ananassa cultivars are plotted on the x-axis. The phenotypes of several Fragaria chiloensis and F. virginiana ecotypes are shown in random order to the left of 1850 on the x-axis. Genotypes of the AX-184242253 SNP were used to predict to PG1-6A1 unfavorable allele homozygotes (−/−; blue points), heterozygotes (+/−; red points), and favorable allele homozygotes (+/+; brown points), where the favorable (mutant) allele (PG1-6A2formula image) increases fruit firmness. See Supplemental Fig. S6 for a version of this figure showing additional cultivars.
Figure 9
Figure 9
Tracing the ancestry of the favorable (mutant) PG1-6A1 allele found in firm-fruited UC cultivars. The family tree illustrates a small fraction of the thousands of descendants of ‘Tioga’ and ‘Tufts’ in the pedigree records of firm-fruited progeny developed at UC, including every UC cultivar developed since 1970. Genotypes of the AX-184242253 SNP were used to predict PG1-6A1 unfavorable allele homozygotes (−/−; blue points), heterozygotes (+/−; red points), and favorable allele homozygotes (+/+; brown points), where the favorable (mutant) allele (PG1-6A2formula image) increases fruit firmness. Gray nodes identify individuals that were not genotyped or phenotyped, many of which are extinct.

Similar articles

References

    1. Fletcher SW. Strawberry-Growing. New York: The Macmillan Company; 1917
    1. Darrow GM. The Strawberry: History, Breeding, and Physiology. New York: Holt, Rinehart, and Winston; 1966
    1. Lawrence F, Galletta G, Scott D. Strawberry breeding work of the US Department of Agriculture. HortScience. 1990;25:895–6
    1. Shaw DV, Larson KD. Performance of early-generation and modern strawberry cultivars from the University of California breeding programme in growing systems simulating traditional and modern horticulture. J Hortic Sci Biotechnol. 2008;83:648–52
    1. Feldmann MJ, Pincot DDA, Cole GS. et al. Genetic gains underpinning a little-known strawberry green revolution. Nat Commun. 2024a;15:2468. - PMC - PubMed