

Identification immune-related hub genes in diagnosing atherosclerosis with ischemic stroke through comprehensive bioinformatics analysis and machine learning
- PMID: 40371070
- PMCID: PMC12074939
- DOI: 10.3389/fneur.2025.1507855
Identification immune-related hub genes in diagnosing atherosclerosis with ischemic stroke through comprehensive bioinformatics analysis and machine learning
Abstract
Background: Atheroma plaques are major etiological factors in the pathogenesis of ischemic stroke (IS). Emerging evidence highlights the critical involvement of the immune microenvironment and dysregulated inflammatory responses throughout IS progression. Consequently, therapeutic strategies targeting specific immune-related markers or signaling pathways within this microenvironment hold significant promise for IS management.
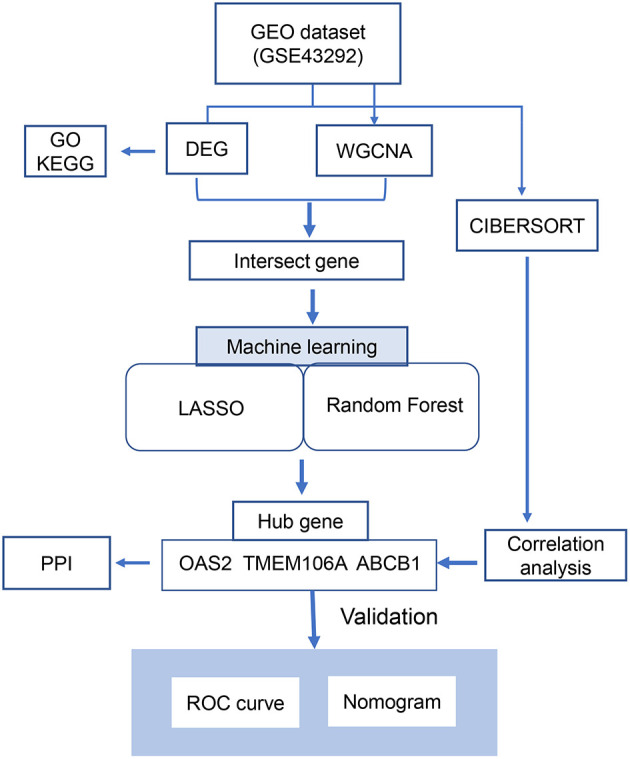
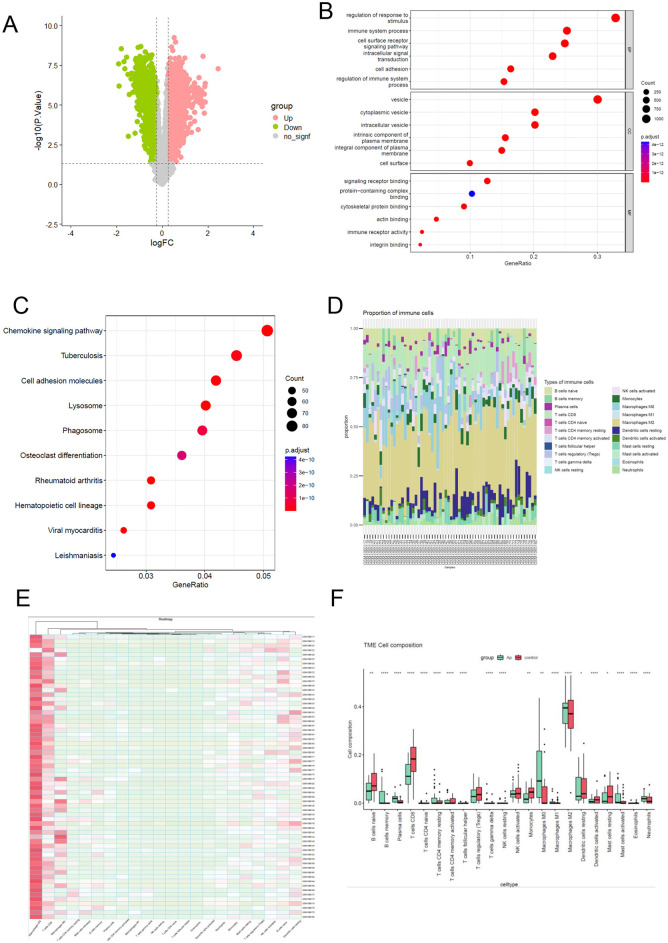
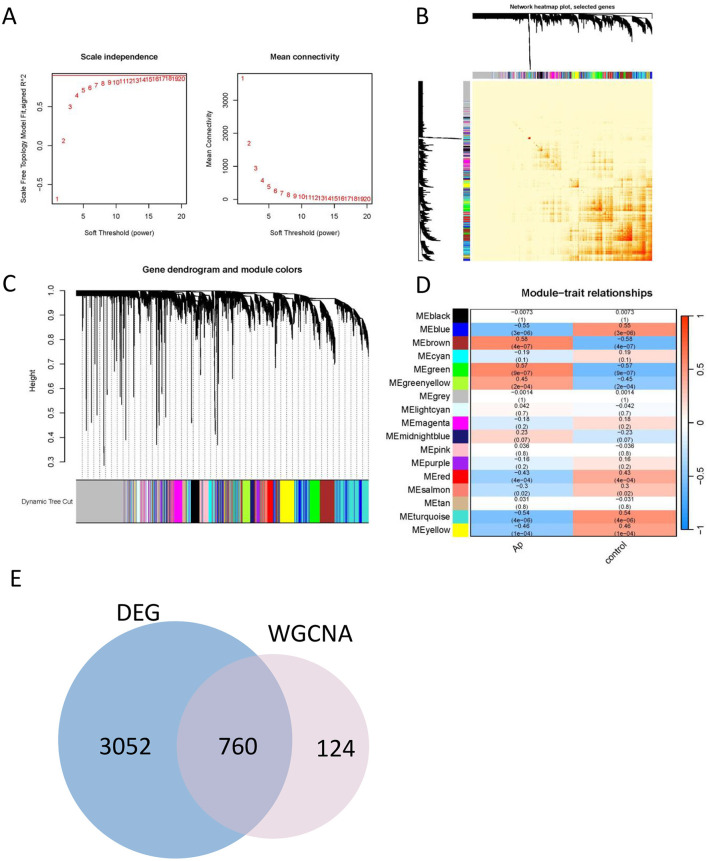
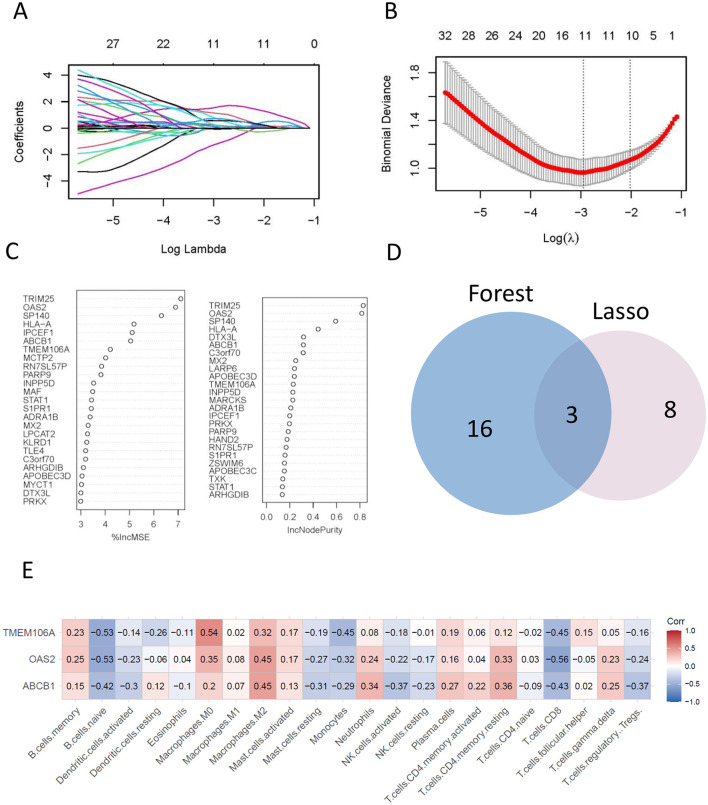
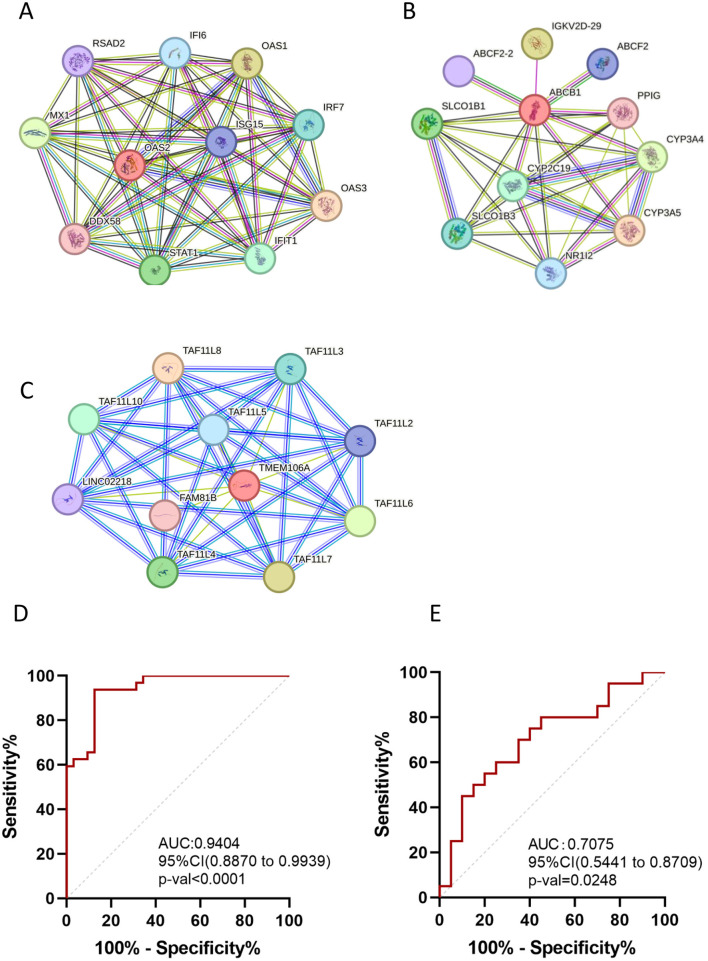
Methods: We integrated Weighted Gene Co-expression Network Analysis (WGCNA), CIBERSORT, and machine learning (LASSO/Random Forest) to identify disease-associated modules and hub genes. Immune infiltration analysis evaluated hub gene-immune cell correlations, while protein-protein interaction (PPI) and ROC curve analyses assessed diagnostic performance.
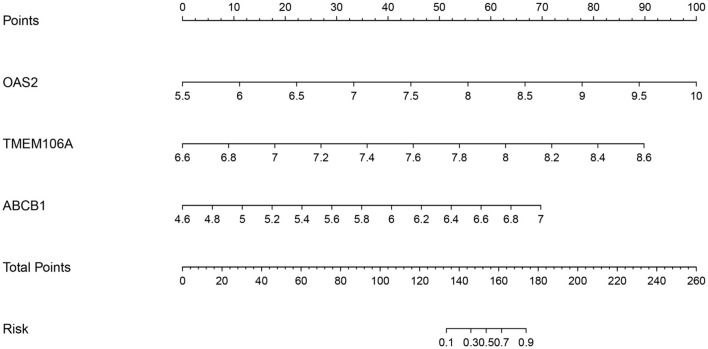
Results: Comprehensive bioinformatics analysis identified three hub genes-OAS2, TMEM106A, and ABCB1-with high prognostic value for ischemic stroke. Immune infiltration profiling revealed significant correlations between these genes and distinct immune cell populations, underscoring their roles in modulating the immune microenvironment. The diagnostic performance of the gene panel was robust, achieving an area under the curve (AUC) was calculated as 0.9404 (p < 0.0001; 95% CI: 0.887-0.9939) for atherosclerotic plaques, demonstrating superior accuracy compared to conventional biomarkers.
Conclusion: By integrating machine learning with multi-omics bioinformatics, we established a novel three-gene signature (OAS2, TMEM106A, ABCB1) for precise diagnosis of atherosclerosis and ischemic stroke. These genes exhibit dual diagnostic utility and may influence disease progression through immune cell modulation. Our findings provide a foundation for developing targeted therapies and biomarker-driven clinical tools.
Keywords: WGCNA; atherosclerosis; bioinformatics; immune cell infiltration; ischemic stroke; machine learning.
Copyright © 2025 Zhang, Tang and Long.
Conflict of interest statement
The authors declare that the research was conducted in the absence of any commercial or financial relationships that could be construed as potential conflicts of interest.
Figures
Similar articles
-
Immune-associated biomarkers identification for diagnosing carotid plaque progression with uremia through systematical bioinformatics and machine learning analysis.Eur J Med Res. 2023 Feb 23;28(1):92. doi: 10.1186/s40001-023-01043-4. Eur J Med Res. 2023. PMID: 36823662 Free PMC article.
-
Identification of novel biomarkers and immune infiltration characteristics of ischemic stroke based on comprehensive bioinformatic analysis and machine learning.Biochem Biophys Rep. 2023 Dec 7;37:101595. doi: 10.1016/j.bbrep.2023.101595. eCollection 2024 Mar. Biochem Biophys Rep. 2023. PMID: 38371524 Free PMC article.
-
Identification and experimental validation of KMO as a critical immune-associated mitochondrial gene in unstable atherosclerotic plaque.J Transl Med. 2024 Jul 18;22(1):668. doi: 10.1186/s12967-024-05464-5. J Transl Med. 2024. PMID: 39026250 Free PMC article.
-
Identification of immune cell infiltration and diagnostic biomarkers in unstable atherosclerotic plaques by integrated bioinformatics analysis and machine learning.Front Immunol. 2022 Sep 23;13:956078. doi: 10.3389/fimmu.2022.956078. eCollection 2022. Front Immunol. 2022. PMID: 36211422 Free PMC article.
-
Identification of crucial genes for predicting the risk of atherosclerosis with system lupus erythematosus based on comprehensive bioinformatics analysis and machine learning.Comput Biol Med. 2023 Jan;152:106388. doi: 10.1016/j.compbiomed.2022.106388. Epub 2022 Nov 30. Comput Biol Med. 2023. PMID: 36470144
References
LinkOut - more resources
Full Text Sources