Transcriptome analysis of calcium hydroxide tolerance in Enterococcus faecalis
- PMID: 40371114
- PMCID: PMC12075564
- DOI: 10.3389/fmicb.2025.1551824
Transcriptome analysis of calcium hydroxide tolerance in Enterococcus faecalis
Abstract
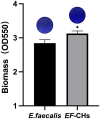
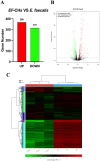
Calcium hydroxide (Ca(OH)2) is commonly used as a root canal disinfectant, but its effectiveness against Enterococcus faecalis is limited, likely due to the bacterium's ability to tolerate it. This study aimed to investigate the underlying mechanism of E. faecalis tolerance to repeated exposure to Ca(OH)2. Initially, E. faecalis was exposed to Ca(OH)2 for 10 successive passages. The survival rate of the bacteria increased progressively, suggesting the development of tolerance to Ca(OH)2. Crystal violet staining revealed that calcium hydroxide-tolerant strains formed more robust biofilms compared to standard strains. To delve into the mechanisms of Ca(OH)2 tolerance in E. faecalis, RNA sequencing was employed for a preliminary investigation. Transcriptome sequencing identified 683 differentially expressed genes (DEGs) in the calcium hydroxide-tolerant strain, with 368 genes upregulated and 315 downregulated compared to the standard strain. Bioinformatics analysis revealed that the upregulated genes were associated with carbohydrate transport and metabolism, starch and sucrose metabolism, quorum sensing, aminoacyl-tRNA biosynthesis, and two-component systems signaling pathways. In contrast, the downregulated genes were primarily linked to lipoic acid metabolism, degradation of valine, leucine, and isoleucine, and the citric acid cycle (tricarboxylic acid cycle) signaling pathways. The findings suggest that prolonged exposure to Ca(OH)2 induces tolerance in E. faecalis. RNA sequencing further revealed that this tolerance involves multiple interconnected signaling pathways, providing a critical foundation for future research into therapeutic strategies for E. faecalis infections.
Keywords: Enterococcus faecalis; calcium hydroxide; persistent apical periodontitis; tolerance; transcriptomics.
Copyright © 2025 Xu, Ma, Jiang, Baima, Zhen, Yang and Meng.
Conflict of interest statement
The authors declare that the research was conducted in the absence of any commercial or financial relationships that could be construed as a potential conflict of interest.
Figures


Similar articles
-
Synergistic antibacterial effect of ginsenoside Rh2 and calcium hydroxide on Enterococcus faecalis.Odontology. 2025 Jan;113(1):111-125. doi: 10.1007/s10266-024-00951-z. Epub 2024 May 19. Odontology. 2025. PMID: 38762821
-
Efficacy of chitosan paste as intracanal medication against Enterococcus faecalis and Candida albicans biofilm compared with calcium hydroxide in an in vitro root canal infection model.BMC Oral Health. 2022 Aug 16;22(1):354. doi: 10.1186/s12903-022-02385-x. BMC Oral Health. 2022. PMID: 35974361 Free PMC article.
-
Antibacterial biofilm efficacy of calcium hydroxide loaded on Gum Arabic nanocarrier: an in-vitro study.BMC Oral Health. 2024 Feb 10;24(1):215. doi: 10.1186/s12903-024-03941-3. BMC Oral Health. 2024. PMID: 38341565 Free PMC article.
-
Effect of calcium hydroxide on morphology and physicochemical properties of Enterococcus faecalis biofilm.Sci Rep. 2022 May 9;12(1):7595. doi: 10.1038/s41598-022-11780-x. Sci Rep. 2022. PMID: 35534609 Free PMC article.
-
Antimicrobial Effects of Formulations of Various Nanoparticles and Calcium Hydroxide as Intra-canal Medications Against Enterococcus faecalis: A Systematic Review.Cureus. 2024 Sep 28;16(9):e70382. doi: 10.7759/cureus.70382. eCollection 2024 Sep. Cureus. 2024. PMID: 39469360 Free PMC article. Review.
References
-
- Anija R., Kalita C., Bhuyan A. C., Hussain M. D. I., Saikia A., Das L. (2021). Comparative evaluation of the concentration-dependent effect of proton-pump inhibitor in association with calcium hydroxide and chlorhexidine on Enterococcus faecalis: an in vitro study. J. Oral Maxillofac. Pathol. 25:198. doi: 10.4103/jomfp.JOMFP_303_20, PMID: - DOI - PMC - PubMed
-
- Benjamini Y., Hochberg Y. (1995). Controlling the false discovery rate: a practical and powerful approach to multiple testing. J. R. Stat. Soc. B 57, 289–300. doi: 10.1111/j.2517-6161.1995.tb02031.x - DOI
LinkOut - more resources
Full Text Sources

