

Prognostic value of albumin-to-alkaline phosphatase ratio and CONUT score in rectal cancer patients undergoing XELOX-based chemotherapy: development of a nomogram-based predictive model
- PMID: 40371163
- PMCID: PMC12070095
- DOI: 10.62347/HSDE2538
Prognostic value of albumin-to-alkaline phosphatase ratio and CONUT score in rectal cancer patients undergoing XELOX-based chemotherapy: development of a nomogram-based predictive model
Abstract
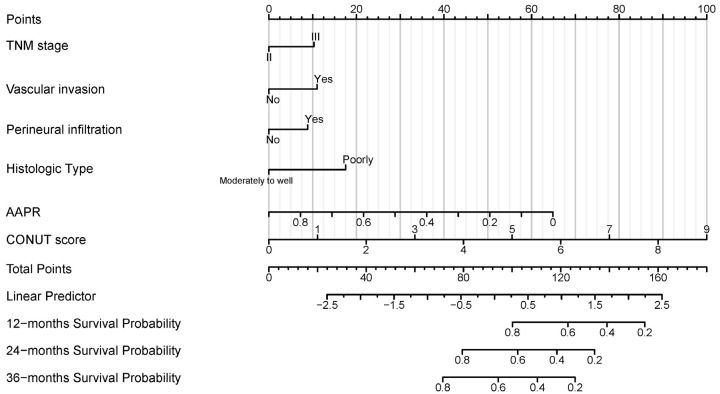
Objective: To evaluate the prognostic significance of the albumin-to-alkaline phosphatase ratio (AAPR) and the Controlling Nutritional Status (CONUT) score in rectal cancer (RC) patients receiving XELOX-based chemotherapy, and to develop a nomogram for predicting recurrence risk.
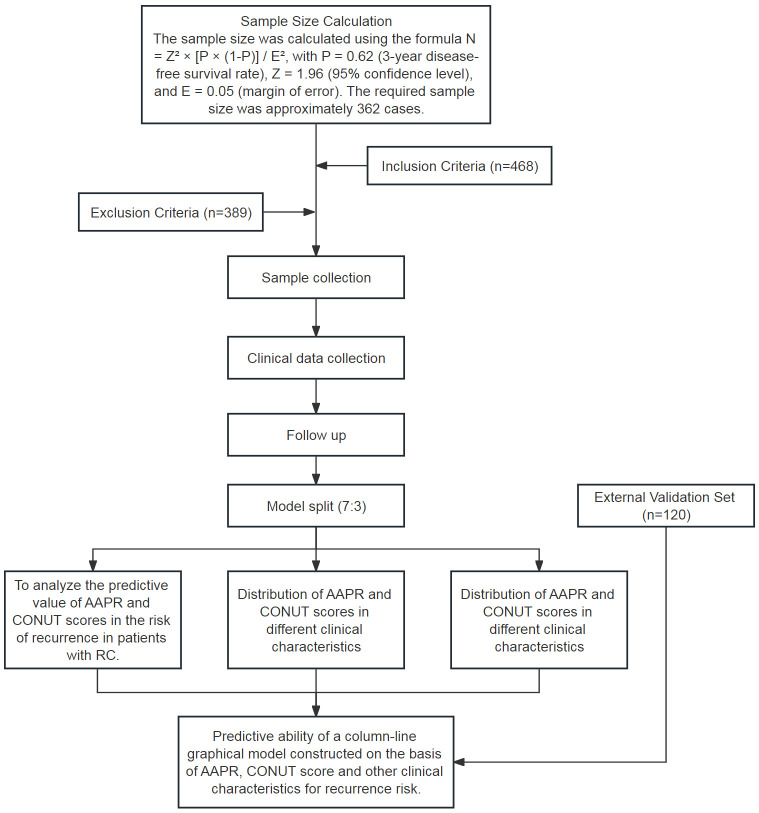
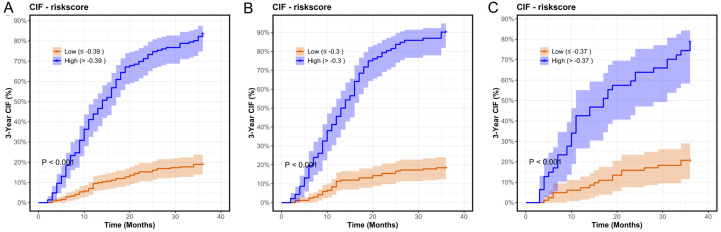
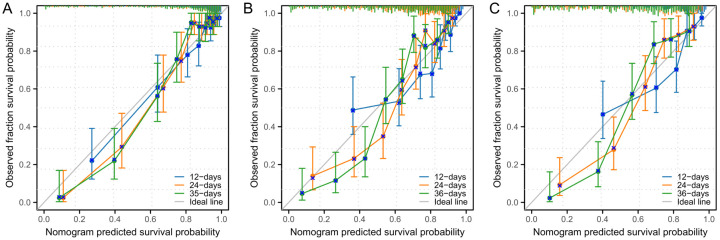
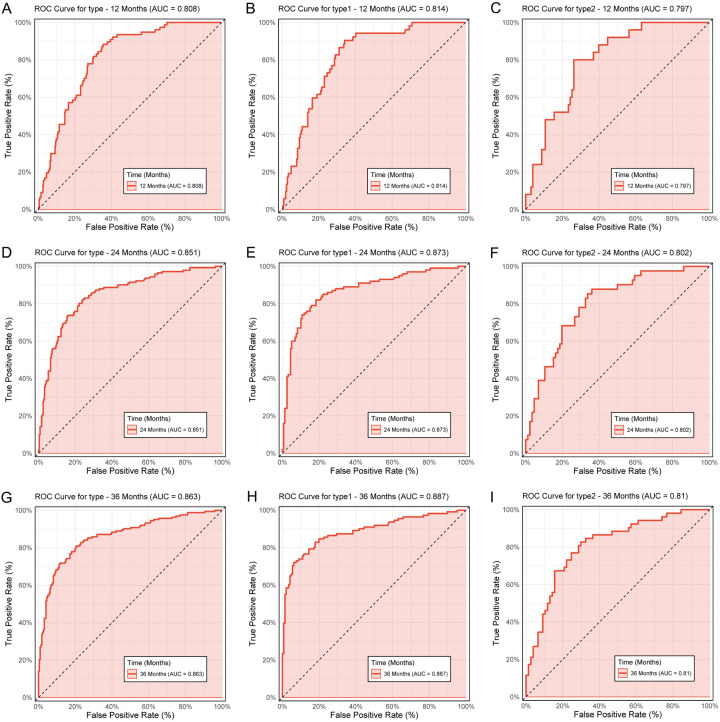
Methods: This retrospective study included 389 RC patients treated at the First Affiliated Hospital of Chongqing Medical University, along with an independent validation cohort of 120 patients. Clinical variables, including AAPR and CONUT were analyzed using Cox regression and cumulative incidence function curves. A nomogram was constructed and validated using calibration plots and time-dependent receiver operating characteristic (ROC) curves.
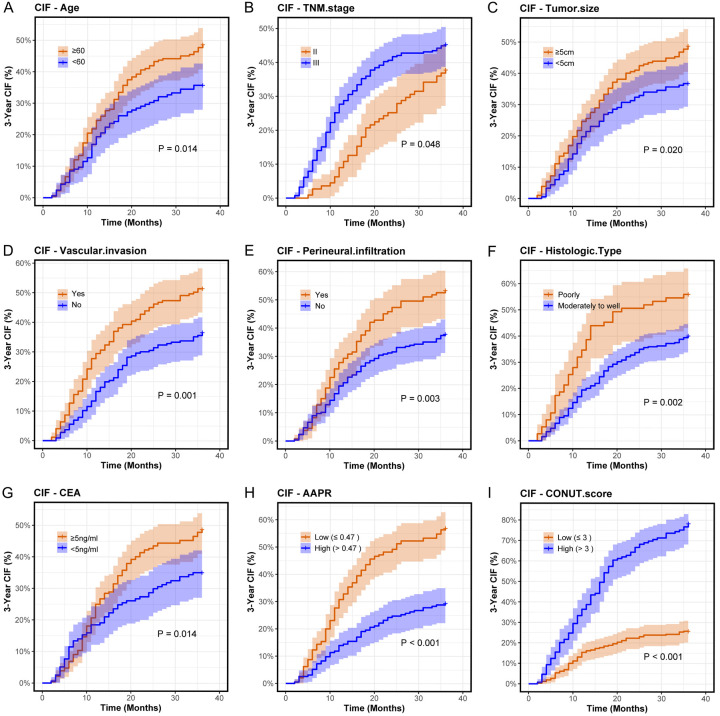
Results: Both AAPR (HR = 0.073, P<0.001) and CONUT score (HR = 1.497, P<0.001) were identified as independent predictors of recurrence. Additional factors significantly associated with increased recurrence risk included TNM stage III, tumor size ≥5 cm, vascular invasion, and carcinoembryonic antigen (CEA) level ≥5 ng/ml. The nomogram demonstrated strong predictive performance with a C-index of 0.860 in the training cohort, and 0.835 in the validation cohort. Calibration plots showed excellent agreement between predicted and observed recurrence probabilities.
Conclusions: AAPR and CONUT score are independent prognostic indicators for recurrence in RC patients treated with XELOX-based chemotherapy. The proposed nomogram, incorporating these variables, provides a reliable tool for individualized risk prediction and may support personalized treatment decision-making.
Keywords: Albumin-to-alkaline phosphatase ratio; CONUT score; XELOX-based chemotherapy; nomogram; prognostic model; rectal cancer.
AJCR Copyright © 2025.
Conflict of interest statement
None.
Figures
Similar articles
-
Preoperative Albumin to Alkaline Phosphatase Ratio and Inflammatory Burden Index for Rectal Cancer Prognostic Nomogram-Construction: Based on Multiple Machine Learning.J Inflamm Res. 2024 Dec 17;17:11161-11174. doi: 10.2147/JIR.S500900. eCollection 2024. J Inflamm Res. 2024. PMID: 39713712 Free PMC article.
-
Construction and Validation of a Serum Albumin-to-Alkaline Phosphatase Ratio-Based Nomogram for Predicting Pathological Complete Response in Breast Cancer.Front Oncol. 2021 Oct 8;11:681905. doi: 10.3389/fonc.2021.681905. eCollection 2021. Front Oncol. 2021. PMID: 34692474 Free PMC article.
-
Development and validation of a nomogram prediction model based on albumin-to-alkaline phosphatase ratio for predicting the prognosis of gallbladder carcinoma.Pathol Oncol Res. 2023 Jan 4;28:1610818. doi: 10.3389/pore.2022.1610818. eCollection 2022. Pathol Oncol Res. 2023. PMID: 36685104 Free PMC article.
-
Using a nomogram based on the controlling nutritional status score to predict prognosis after surgery in patients with resectable gastric cancer.BMC Gastroenterol. 2025 Mar 17;25(1):180. doi: 10.1186/s12876-025-03766-6. BMC Gastroenterol. 2025. PMID: 40097940 Free PMC article.
-
Development of a New Recurrence-Free Survival Prediction Nomogram for Patients with Primary Non-Muscle-Invasive Bladder Cancer Based on Preoperative Controlling Nutritional Status Score.Cancer Manag Res. 2021 Aug 16;13:6473-6487. doi: 10.2147/CMAR.S323844. eCollection 2021. Cancer Manag Res. 2021. PMID: 34429654 Free PMC article.
References
-
- Zhou J, Li T, Xiao Y, Lin J, Chen X, Peng S, Huang M, Shi X, Cai L, Huang P, Huang M. Development and external validation of prognostic nomograms for liver disease-free and overall survival in locally advanced rectal cancer with neoadjuvant therapy: a post cohort study based on the FOWARC trial. Ann Transl Med. 2022;10:694. - PMC - PubMed
-
- Bray F, Ferlay J, Soerjomataram I, Siegel RL, Torre LA, Jemal A. Global cancer statistics 2018: GLOBOCAN estimates of incidence and mortality worldwide for 36 cancers in 185 countries. CA Cancer J Clin. 2018;68:394–424. - PubMed
-
- Kotsiliti E. Preoperative FOLFOX treatment in rectal cancer. Nat Rev Gastroenterol Hepatol. 2023;20:483. - PubMed
LinkOut - more resources
Full Text Sources