. 2025 May 14;4(5):e70048.
doi: 10.1002/jex2.70048. eCollection 2025 May.

Control of Physical and Biochemical Parameters Influencing Exogeneous Cargo Protein Association to Extracellular Vesicles Using Lipid Anchors Enables High Loading and Effective Intracellular Delivery

Affiliations

Control of Physical and Biochemical Parameters Influencing Exogeneous Cargo Protein Association to Extracellular Vesicles Using Lipid Anchors Enables High Loading and Effective Intracellular Delivery

Antonin Marquant et al. J Extracell Biol. .

Abstract

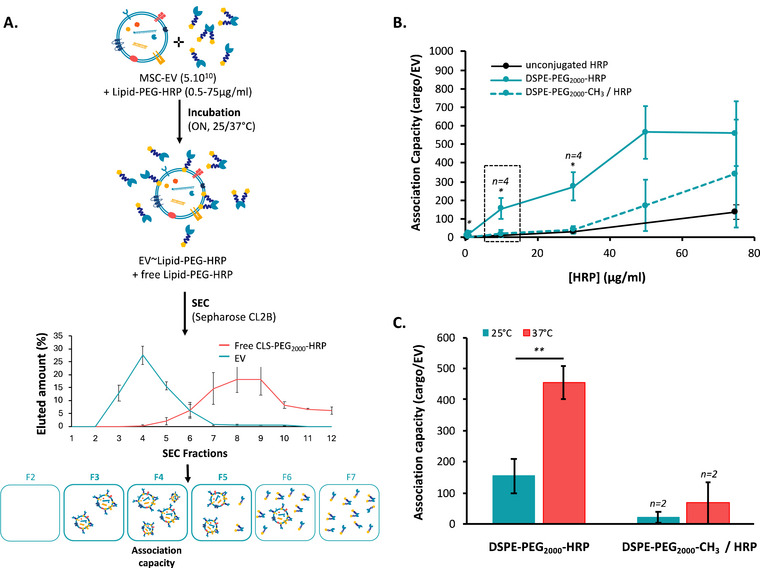
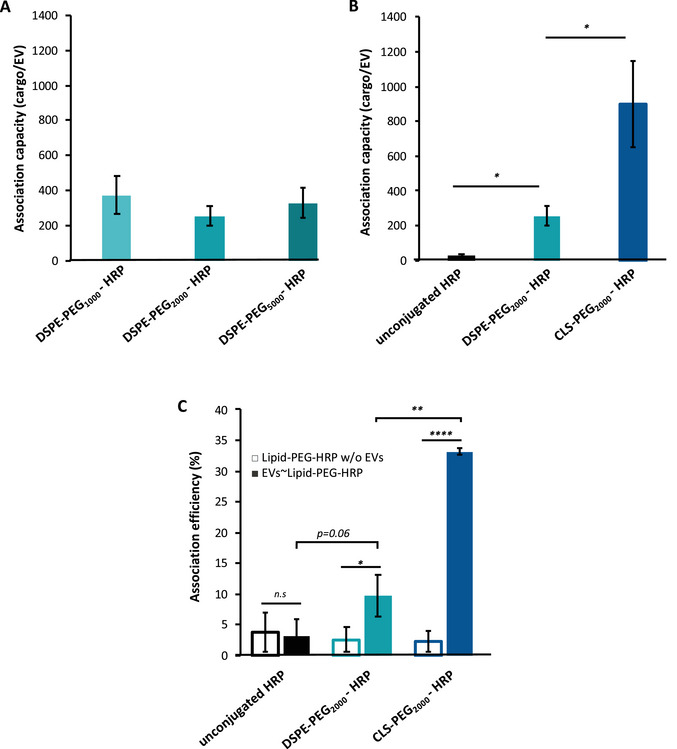
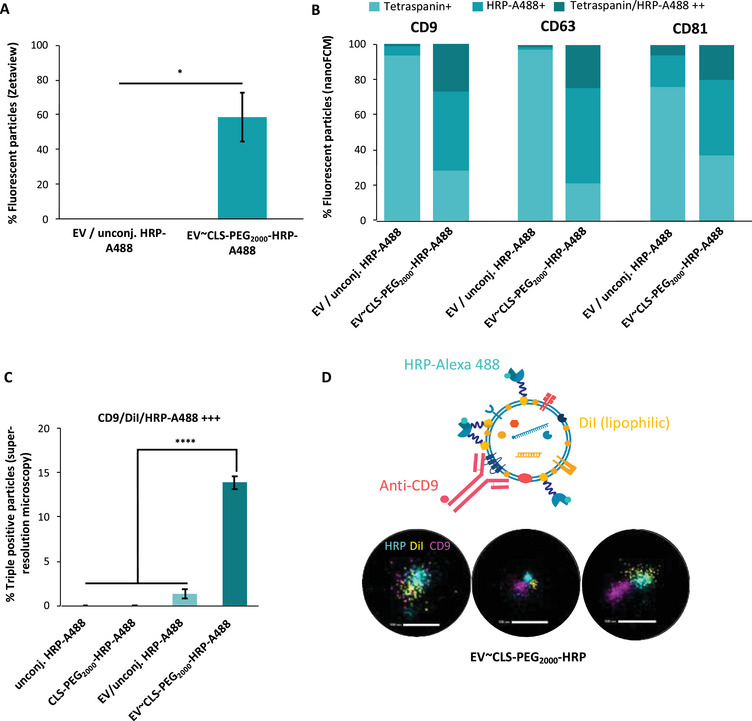
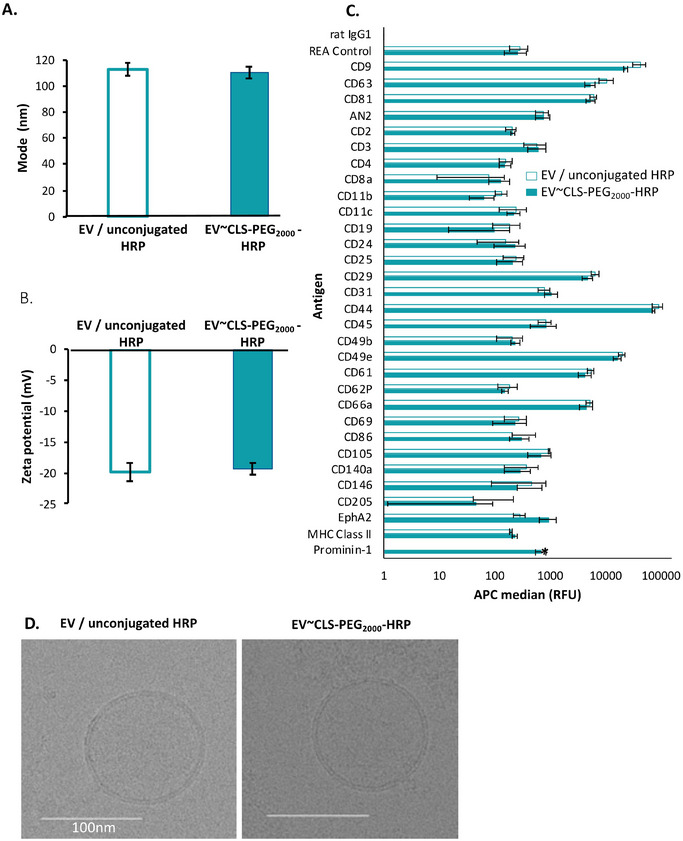
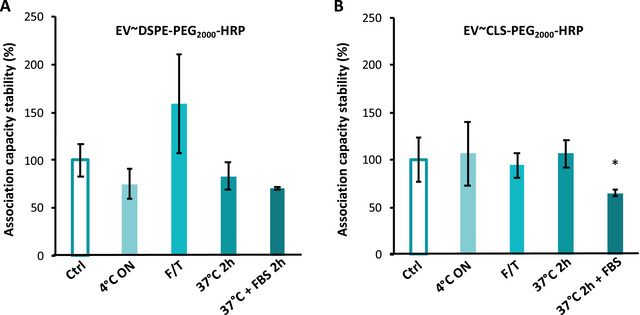
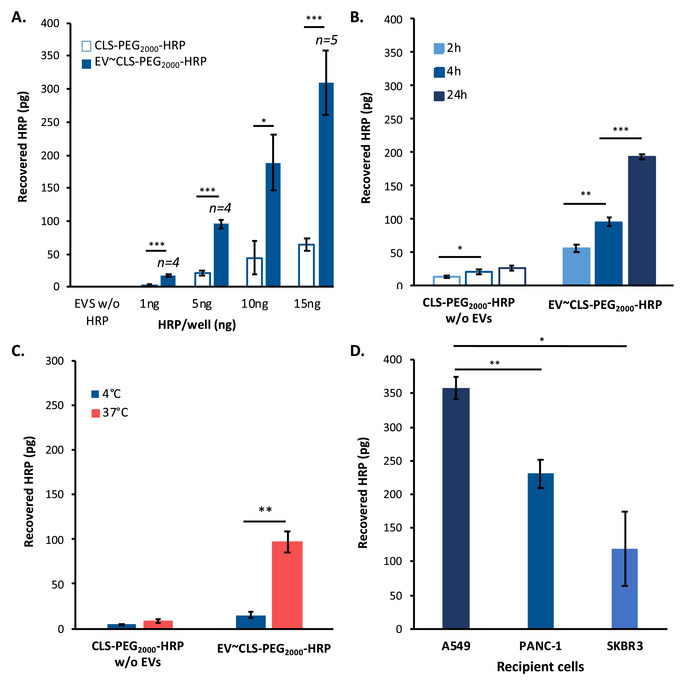
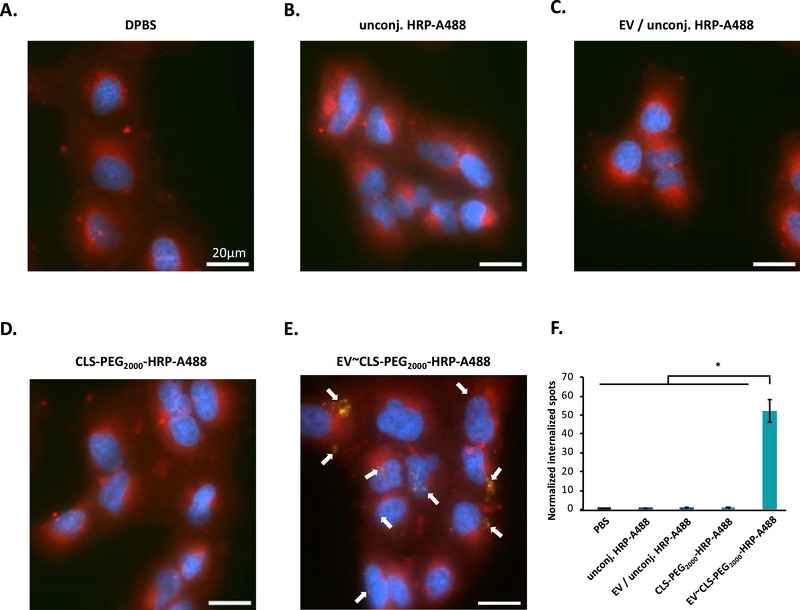
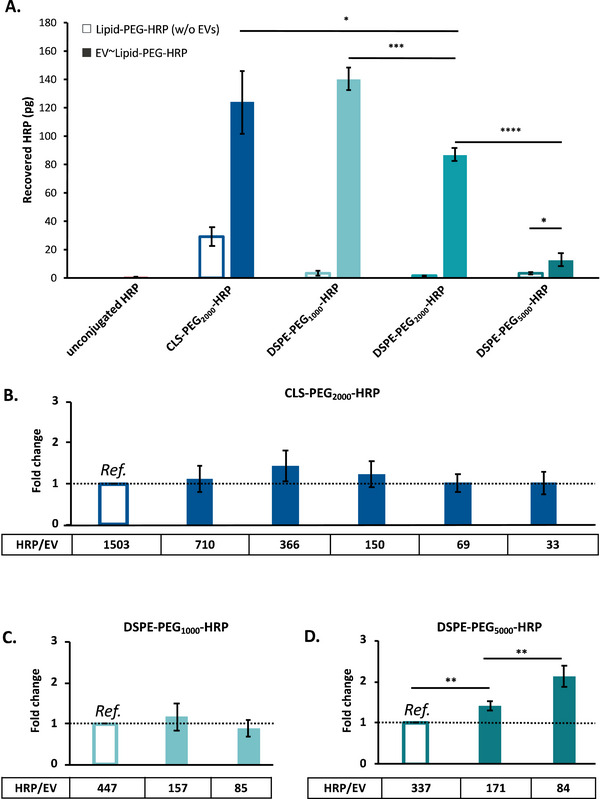
Despite biomolecule delivery is a natural function of extracellular vesicles (EVs), low loading of exogenous macromolecules such as proteins into EVs limits their interest as convincing protein delivery systems for health applications. In this context, lipid-anchorage of exogenous cargo into EV membrane recently emerged as a promising option to enable their vectorisation into cells. Nevertheless, this option was not explored for protein intracellular delivery, and further characterisation of critical parameters governing the association of a lipid-anchored cargo protein to EVs is still needed to confirm the relevance of this anchorage strategy. Therefore, we sought to identify these parameters in a precise and quantitative manner, using bulk and single nanoparticle analysis methods to identify protein loading capacity and subsequent intracellular delivery. We identified incubation temperature, cargo concentration, lipid anchor (LA) structure (lipid nature, linker) and EV origin as critical factors influencing maximal EV loading capacity. Precise control of these parameters enabled to load cargo protein close to EV saturation without hindering cellular delivery. The structural properties of LA influenced not only cargo protein/EV association but also intracellular delivery into different carcinoma cell lines. By thoroughly characterising Lipid-PEG-protein anchorage, this study evidences the interest of this tunable and controllable approach for efficient EV protein delivery.

Keywords: EV exogenous engineering; cell delivery; exosomes; lipid‐PEG anchorage; process optimisation; protein association.


Conflict of interest statement

The authors declare no conflicts of interest.

Figures

FIGURE 1
FIGURE 1
Influence of Lipid‐PEG‐cargo concentration and temperature on the association with EVs. (A) Schematic representation of EV/Lipid‐PEG‐HRP association workflow (association, separation), not to scale. The fourth fraction of SEC was selected to calculate association capacity. (B) Number of biologically active Lipid‐PEG‐HRP per EV versus HRP concentration after incubation of 5.1010 EV/mL with unconjugated HRP, unconjugated DSPE‐PEG2000‐CH3/HRP, and DSPE‐PEG2000‐HRP at 25°C overnight. n = 3 if unspecified. (C) Number of biologically active HRP conjugated per EV versus temperature during incubation of 5.1010 EV/mL with 10 µg/mL of DSPE‐PEG2000‐CH3/HRP or conjugated DSPE‐PEG2000‐HRP at 25°C or 37°C overnight. p values were calculated using a two‐tailed Welch test.
FIGURE 2
FIGURE 2
Influence of PEG linker MW, lipid anchor nature and EV type on the association between EVs and Lipid‐PEG‐HRP. Association efficiency according to (A) the PEG MW of DSPE‐PEG anchor or (B) the lipid nature of Lipid‐PEG2000 anchor after incubation of 5.1010 EV/mL with 10 µg/mL of HRP incubated overnight at 37°C. Fourth SEC fraction was considered to calculate this association capacity (n = 3). (C) Loading efficiency is defined as percentage of HRP Lipid‐PEG‐HRP retained with EVs (all EV SEC fractions were considered) after incubation of 10 µg/mL of unconjugated HRP, conjugated DSPE‐PEG2000‐HRP and conjugated CLS‐PEG2000‐HRP with (n = 3) 5.1010 EV/mL or without (n = 4) EV incubated overnight at 37°C. p values were calculated using a two‐tailed Welch test. n.s > 0.05, *<0.05, **<0.01, ***<0.001, ****<0.0001.
FIGURE 3
FIGURE 3
Heterogeneity in CLS‐PEG2000‐HRP‐A488 loading. (A) Proportion of fluorescent detected particles using Zetaview (n = 3). (B) NanoFCM analysis after incubation with anti‐CD9, anti‐CD63, or anti‐CD81 antibodies coupled with AlexaFluor647 (n = 1). Only fluorescent particles have been considered. (C) Proportion of triple positive clusters using STORM. Samples were incubated with DiI dye and anti‐CD9 antibody, whilst HRP was labelled with Alexa‐Fluor 488 (n = 3). (D) Representative images of triple positive clusters observed using STORM. p values were calculated using a two‐tailed Welch test. n.s > 0.05, *<0.05, **<0.01, ***<0.001, ****<0.0001.
FIGURE 4
FIGURE 4
Characteristics of mMSC‐EV associated or not with Lipid‐PEG‐HRP. (A) Size (mode, NTA, NS300, n = 5) and (B) Zeta potential (NTA, Zetaview Twin, n = 3) after incubation of EVs with unconjugated HRP or CLS‐PEG2000‐HRP and SEC separation. (C) MACSPlex Assay analysis as APC median after subtraction of buffer background signal. p values were calculated using a two‐tailed Welch test and only Prominin‐1 was significant (*p < 0.05). (D) CryoTEM images of EVs after incubation with unconjugated HRP or CLS‐PEG2000‐HRP. No SEC separation was processed on these samples (n = 3).
FIGURE 5
FIGURE 5
Stability of the EV/Lipid‐PEG2000‐HRP association. Association capacity of (A) DSPE‐PEG2000‐HRP and (B) CLS‐PEG2000‐HRP in percentage of control samples. Samples were diluted at 1:11 in DPBS (or DPBS supplemented with 1:50 FBS if indicated) and incubated before SEC separation. 4°C ON samples were incubated at 4°C ON, F/T were frozen at −80°C before thawing and 37°C 2 h (+FBS) were incubated at 37°C during 2 h either with DPBS or DPBS + 1:50 FBS. n = 3 except for CLS‐PEG2000‐HRP 4°C ON (n = 2). p values were calculated using a two‐tailed Welch test and samples were compared with Ctrl. n.s >0.05, *<0.05.
FIGURE 6
FIGURE 6
Quantification of the absolute amount of internalised HRP depending on quantity, temperature and incubation time on cell internalisation of EV∼CLS‐PEG2000‐HRP. Recovered CLS‐PEG2000‐HRP vectorised or not by EVs in PANC‐1 lysate after incubation with 1.105 PANC‐1 following these conditions: (A) 4 h, 37°C, 1, 5, 10, or 15 ng of HRP/well. (B) 2, 4, or 24 h of incubation, 37°C, 5 ng/well of HRP. (C) 2 h, 4°C or 37°C, 10 ng/well of HRP. (D) 4 h, 37°C, 10 ng with 1.105 A549, PANC‐1, or SKBR3 cells. For each experiment, p values were calculated using a two‐tailed Welch test. n.s > 0.05, *<0.05, **<0.01, ***<0.001. n = 3 if unspecified.
FIGURE 7
FIGURE 7
Epifluorescence and confocal microscopy observation and quantification of HRP‐A488 cell internalisation. A549 cells were incubated 4 h with HRP‐A488, conjugated with CLS‐PEG2000 or not and associated with EVs or not. Panel images have been acquired using full‐field epifluorescence microscopy. Blue, Red and green fluorescence are DAPI, Cell Mask lipophilic dye and Alexa‐fluor 488 from labelled HRP, respectively. (A) A549 cells control incubated with DPBS. (B and C) A549 cells incubated with unconjugated HRP‐A488 alone and mixed with EVs, respectively. (D and E) A549 cells incubated with CLS‐PEG2000‐HRP‐A488 alone and associated with EVs, respectively. Identical HRP mass was deposited between EV conditions and their respective controls. Identical number of EVs was deposited between EV conditions. Bar scale is 20 µm. White arrows highlight some HRP‐A488 spots. (F) Quantitative analysis on confocal 3D image stacks obtained using spinning‐disk confocal microscopy. Number of fluorescent spots in cells was normalised per total number of voxels corresponding to intracellular space. n = 2 images except for EV/unconj. HRP‐A488 (n = 3). For each experiment, p values were calculated using a two‐tailed Welch test. n.s > 0.05, *<0.05.
FIGURE 8
FIGURE 8
Impact of lipid anchor nature, PEG linker MW and HRP/EV ratio on cell internalisation. (A) Recovered Lipid‐PEG‐HRP in PANC‐1 lysate after incubation of 10 µg of Lipid‐PEG‐HRP associated or not to EVs, for 4 h at 37°C with 1.105 PANC‐1 cells (n = 4). (B, C and D) Fold change in recovered Lipid‐PEG‐HRP in PANC‐1 lysate after incubation of 1500 EV∼Lipid‐PEG‐HRP per cell for 4 h at 37°C with 1.105 PANC‐1 cells. Decreasing HRP/EV ratio have been tested with CLS‐PEG2000‐HRP, DSPE‐PEG1000‐HRP and DSPE‐PEG5000‐HRP for (B), (C) and (D), respectively. The proportion of Lipid‐PEG‐HRP recovered in lysate was normalised with the highest ratio of the experiment (indicated in the figure as Ref.). Significances are compared to 1 (null hypothesis = no changes whatever the HRP/EV ratio) (n = 3). For each experiment, p values were calculated using a two‐tailed Welch test. n.s > 0.05, *<0.05, **<0.01, ***<0.001, ****<0.0001.

Similar articles

Cited by

References

    1. Alwarawrah, M. , Dai J., and Huang J.. 2010. “A Molecular View of the Cholesterol Condensing Effect in DOPC Lipid Bilayers.” Journal of Physical Chemistry B 114: 7516–7523. - PMC - PubMed
    1. Andrews, M. D. , Dack K. N., de Groot M. J., et al. 2022. “Discovery of an Oral, Rule of 5 Compliant, Interleukin 17A Protein–Protein Interaction Modulator for the Potential Treatment of Psoriasis and Other Inflammatory Diseases.” Journal of Medicinal Chemistry 65: 8828–8842. - PubMed
    1. Biscans, A. , Haraszti R. A., Echeverria D., et al. 2018. “Hydrophobicity of Lipid‐Conjugated siRNAs Predicts Productive Loading to Small Extracellular Vesicles.” Molecular Therapy 26: 1520–1528. - PMC - PubMed
    1. Chen, C. , Sun M., Wang J., Su L., Lin J., and Yan X.. 2021. “Active Cargo Loading Into Extracellular Vesicles: Highlights the Heterogeneous Encapsulation Behaviour.” Journal of Extracellular Vesicles 10: e12163. - PMC - PubMed
    1. Choi, E. S. , Song J., Kang Y. Y., and Mok H.. 2019. “Mannose‐Modified Serum Exosomes for the Elevated Uptake to Murine Dendritic Cells and Lymphatic Accumulation.” Macromolecular Bioscience 19: 1900042. - PubMed

LinkOut - more resources