. 2025 Apr 30:16:1573032.
doi: 10.3389/fphar.2025.1573032. eCollection 2025.

Canagliflozin alleviates progestin resistance by suppressing RARβ/CRABP2 signaling in THRB knockout endometrial cancer cells

Affiliations

Canagliflozin alleviates progestin resistance by suppressing RARβ/CRABP2 signaling in THRB knockout endometrial cancer cells

Ye Yang et al. Front Pharmacol. .

Abstract

Introduction: Progestin resistance has emerged as a significant barrier to the conservative management of endometrial cancer (EC). The mechanisms underlying progestin resistance in endocrine therapy remain incompletely understood. Previous studies have suggested that silencing thyroid hormone receptor B (THRB) is associated with progestin resistance in EC cells.

Methods: THRB-knockout RL95-2 (THRB(-/-)/RL95-2) cells were constructed to investigate progestin resistance mechanisms. Cell proliferation and apoptosis were assessed in RL95-2 and THRB(-/-)/RL95-2 cells treated with canagliflozin (CANA), medroxyprogesterone acetate (MPA), and their combination using CCK-8, EdU, and flow cytometry assays. In vivo, nude mouse xenograft models were used to evaluate the efficacy of CANA and MPA. Transcriptomic and proteomic analyses were performed to identify pathways associated with progestin resistance. Molecular dynamics simulations, along with western blotting and immunohistochemistry were utilized to validate the targets of CANA. Electrophoretic mobility shift assays and dual luciferase reporter assays were employed to investigate the interactions between TRβ, RARβ, and CRABP2.

Results: THRB(-/-)/RL95-2 cells were successfully constructed. CANA demonstrated a strong binding affinity for TRβ. Both MPA and CANA suppressed proliferation in RL95-2 cells, but MPA was ineffective in THRB(-/-)/RL95-2 cells, indicating that THRB deficiency induced progestin resistance. CANA significantly inhibited proliferation and promoted apoptosis in THRB(-/-)/RL95-2 cells. In vivo, CANA, either alone or in combination with MPA, significantly reduced tumor growth in xenograft models derived from both wild-type and THRB-knockout RL95-2 cells. Transcriptomic and proteomic analyses revealed that progestin resistance in EC was linked to the retinoic acid signaling pathways. Western blotting confirmed that the expressions of RARβ, RXRA and CRABP2 were significantly elevated in THRB(-/-)/RL95-2 cells. Treatment with CANA, alone or in combination with MPA, effectively reduced the expression of these proteins. Immunohistochemical analysis demonstrated that RARβ expression was significantly increased in uterine tissues from patients with progestin-insensitive EC or endometrial atypical hyperplasia. Electrophoretic mobility shift assays and dual luciferase reporter assays demonstrated that TRβ negatively modulated RARβ expression by binding to its promoter, while RARβ positively regulated CRABP2 expression.

Conclusion: THRB knockout activated retinoic acid pathway, leading to progestin resistance. CANA targeted RARβ and RXRA, downregulated CRABP2, restored BAX levels, and counteracted progestin resistance. The combination of CANA and MPA presented a novel strategy for alleviating progestin resistance and enhancing clinical efficacy.

Keywords: canagliflozin; endometrial cancer; medroxyprogesterone acetate; progestin resistance; retinoic acid receptor β; thyroid hormone receptor β.


Conflict of interest statement

The authors declare that the research was conducted in the absence of any commercial or financial relationships that could be construed as a potential conflict of interest.

Figures
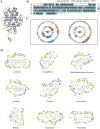
FIGURE 1
FIGURE 1
Virtual screening of selective candidates interacted with TRβ. (A) The 3D protein structures of TRα (green) and TRβ (blue). The green stick indicated the co-crystalline ligand of TRα, and the blue stick represented the co-crystalline ligand of TRβ. (B) One-dimensional amino sequence alignment of TRα and TRβ proteins. Identical residues were shown as dark blue, while similar residues were represented in light blue. (C) Asteroid plots generated by the Protein Contact Atlas. It visually demonstrated the relationship between protein and co-crystalline ligand. The innermost layer illustrated the critical amino acid residues and ions in direct contact with the co-crystallized molecule, while the outermost layer showed amino acid residues with indirect interactions. The circumference of each circle was proportional to the significance of the residue’s role, and coloring indicates the secondary structure of the residue. (D) Virtual screening candidate interaction with TRβ. The cartoons illustrated the top nine compounds achieved the best Docking score with TRβ. Pink arrows indicated hydrogen bonding interactions and green straight lines indicated π-π interactions. The number and strength of hydrogen and π-π interaction bonds help stabilize the complexes formed by proteins and ligands.
FIGURE 2
FIGURE 2
Inhibitory effect of MPA, CANA, atorvastatin and acarbose on RL95-2、AN3CA and KLE cells. (A) Inhibitory effect of MPA, CANA, atorvastatin and acarbose on RL95-2, AN3CA and KLE cells. (B) Inhibitory effect of CANA, atorvastatin and acarbose in combination with 10 or 30 μM MPA on RL95-2, AN3CA and KLE cells. Data were calculated from triplicate wells in three independent assays.
FIGURE 3
FIGURE 3
Changes in morphology and sensitivity to MPA in THRB(−/−)/RL95-2 cells. (A) Morphology of RL95-2, THRB(−/−)/RL95-2 and THRB + THRB(−/−)/RL95-2 cells under optical microscopy (OM) and transmission electron microscopy (TEM). (B,C) THRB(−/−)/RL95-2 cells knockout efficiency and THRB + THRB(−/−)/RL95-2 cells backfill efficiency. (D) Effects of MPA on viability of RL95-2, THRB(−/−)/RL95-2 and THRB + THRB(−/−)/RL95-2 cells. The results were presented as the mean ± SEM from three independent experiments with triplet repeat of each data. *p < 0.05, **p < 0.01,***p < 0.001, ****p < 0.0001 compared with RL95-2 cells.
FIGURE 4
FIGURE 4
The effect of MPA, CANA and their combination on the viability and inhibition rates of RL95-2 and THRB(−/−)/RL95-2 cells. (A,B) Effects of MPA, CANA, and their combination on the viability and inhibition rates of RL95-2 cells after treatment for 48 h. (C,D) Antiproliferation activity of MPA, CANA, 10 μM MPA combined CANA and 30 μM MPA combined CANA on THRB(−/−)/RL95-2 cells after treatment for 48 h, as presented as IC50 (95% confidence interval) values (μM). The results were presented as IC50 (inhibits cell proliferation by 50%) and its 95% CI (confidence interval). IC50 was defined as the drug concentration required to reduce the number of living cells by 50% after incubation with 1–100 μM of the compounds. Data were calculated from triplicate wells in three independent assays and presented as IC50 (95% confidence interval) values (μM)./meant that the corresponding IC50 value was greater than 800 μM or could not be calculated because the viability of cells did not reach 50% of the maximum.
FIGURE 5
FIGURE 5
Changes of proliferation, apoptosis and migration ability in RL95-2 and THRB(−/−)/RL95-2 cells before and after 30 μM CANA and 30 μM MPA treatment for 48 h. (A–C) The changes of cell proliferation and EdU-positive cells ratio. All cell nuclei showed blue fluorescence indicative of Hoechst 33,342 staining. EdU-labeled cells suggested new DNA synthesis. (D–F) The changes of cell apoptosis capacity and percentage of apoptotic cells. The results were presented as the mean ± SEM from three independent experiments with triplet repeat of each data. *p < 0.05, **p < 0.01, ***p < 0.001, ****p < 0.0001 compared with the control group.
FIGURE 6
FIGURE 6
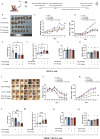
Effects of MPA, CANA and their combination on the growth of transplanted tumors in nude mice, respectively after 28 days of administering 100 mg/kg MPA and 15 kg/kg CANA and their combination (n = 7). (A) Experimental protocols for establishing xenograft tumor in nude mice and treatment. (B) Tumor shape of the xenograft tumors induced by RL95-2 cells. (C) The changes of body weights in the nude mice with xenograft tumors induced by RL95-2 cells. (D) Tumor sizes of the nude mice with xenograft tumors induced by RL95-2 cells. (E,F) Xenograft tumor weights and tumor weight suppression rates in the nude mice inoculated with RL95-2 cells. (G,H) Liver and kidney coefficient of the nude mice with xenograft tumor induced by RL95-2 cells. (I) Tumor shape of the xenograft tumors induced by THRB(−/−)/RL95-2 cells. (J) The changes of body weights of the nude mice with xenograft tumors induced by THRB(−/−)/RL95-2 cells. (K) Tumor volume of the nude mice with xenograft tumor induced by THRB(−/−)/RL95-2 cells. (L,M) Xenograft tumor weights and tumor weight suppression rates in the nude mice inoculated with THRB(−/−)/RL95-2 cells. (N,O) Liver and kidney coefficient of the nude mice with xenograft tumors induced by THRB(−/−)/RL95-2 cells. *p < 0.05, **p < 0.01, ***p < 0.001, ****p < 0.0001 compared with the control group.
FIGURE 7
FIGURE 7
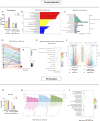
Screening key DEGs and DEPs in the progestin-resistant THRB(−/−)/RL95-2 EC cells via transcriptomic and proteomic assay. (A) Column chart showing the numbers of DEGs up and downregulated in THRB(−/−)/RL95-2 cells versus RL95-2 cells via transcriptomics. (B) GO enrichment analysis of DEGs of THRB(−/−)/RL95-2 versus RL95-2 cells in transcriptomics. (C) KEGG enrichment analysis of DEGs of THRB(−/−)/RL95-2 versus RL95-2 cells in transcriptomics. (D) KEGG enrichment of tumor-related signaling pathways in transcriptomics of THRB(−/−)/RL95-2 versus RL95-2 cells. (E) Disease enrichment analysis of THRB(−/−)/RL95-2 cells in transcriptomics before and after MPA administration. (F) DEGs within THRB(−/−)/RL95-2 versus RL95-2 and CANA 30 μM treatment THRB(−/−)/RL95-2 cells versus the control cells, shown as double volcano plots. The transcriptomic results were represented as mean ± SEM of three independent experiments. (G) Differentially expressed protein of THRB(−/−)/RL95-2 versus RL95-2 cells in proteomics. (H) GO enrichment analysis of THRB(−/−)/RL95-2 versus RL95-2 cells in proteomics before and after DMSO treatment. (I) KEGG enrichment analysis of THRB(−/−)/RL95-2 versus RL95-2 cells in proteomics before and after DMSO administration.
FIGURE 8
FIGURE 8
Molecular dynamics simulation of CANA/RARβ complex. (A,B) Simulation mode of molecular interactions of RARβ/CANA and RXRA/CANA assayed by molecular docking. In the figure, RARβ was depicted as a pink cartoon, RXRA as a blue cartoon, and CANA as a green stick representation. (C) RMSD curves of RARβ protein backbone atoms throughout the 200 ns molecular dynamics simulation. (D) The spectrum of binding free energies of RARβ/CANA complex determined by MM-GBSA calculation throughout the 200 ns simulation. (E) The binding free energy mean values of RARβ/CANA complex determined by MM-GBSA calculation throughout the 200 ns molecular dynamics simulation. (F) Molecular interactions of RARβ with CANA assayed by molecular dynamics simulation. (G) Statistical diagram of protein–ligand contacts between RARβ and CANA and CANA’s five properties obtained from molecular dynamics simulation over the entire 200 ns for complexes. Each CANA rotary key was represented by a different color, and the radar chart of the corresponding color indicated the rotation angle of each rotary key. (H) Ligand Torsion Profile obtained from molecular dynamics simulation over the entire 200 ns for complex.
FIGURE 9
FIGURE 9
The expression of retinoic acid relevant proteins in THRB(−/−)/RL95-2 cells, validated by Western blot or immunohistochemical analysis. (A–E) The protein expression of RARβ, CRABP2, RXRA and BAX in RL95-2 and THRB(−/−)/RL95-2 cells treatment with MPA, CANA, and their combination. (F,G) RARβ immunohistochemical analysis and differential protein expression statistics of RARβ in progestin sensitive (n = 13) or insensitive uterine tissues (n = 7) (**P < 0.01). The results were presented as the mean ± SEM from three independent experiments with triplet repeats of each data. *p < 0.05, **p < 0.01, ***p < 0.001, ****p < 0.0001, comparation conducted between any two groups.
FIGURE 10
FIGURE 10
Interaction and regulation of TRβ, RARβ and CRABP2. (A) The interaction between TRβ and the RARβ promoter assayed by EMSA. The “bound band” was a key indicator. It represented the complex where TRβ attaches to the RARβ promoter DNA, migrating sluggishly in the gel due to the increased molecular mass from this union. In contrast, the “free band” meant the unbound RARβ promoter DNA, i.e., a smaller size protein migrated more rapidly through the gel, providing a baseline to confirm the specific binding event. (B,C) Relative fluorescence intensity between TRβ and RARβ promoter binding assayed by dual luciferase reporter gene. The value of Luc/RLuc was the relative fluorescence intensity. EV represented empty vector. The stronger fluorescence intensity indicated the stronger binding ability of TRβ to the RARB promoter. (D,E) Inhibitory effects of LE135, the RARβ inhibitor, on the expression of CRABP2 in a concentration-dependent manner. (F) Effects of RARβ regulated the CRABP2 promoter via EMSA assay. The results were presented as the mean ± SEM from three independent experiments with triplet repeat of each data. **p < 0.01, ****p < 0.0001 compared with control group.
FIGURE 11
FIGURE 11
CANA alleviated progestin resistance and induced cell apoptosis by impeding the RA signaling pathway in THRB(−/−)/RL95-2 cells.

Similar articles

References

    1. Abdelmaksoud N. M., El-Mahdy H. A., Ismail A., Elsakka E. G. E., El-Husseiny A. A., Khidr E. G., et al. (2023). The role of miRNAs in the pathogenesis and therapeutic resistance of endometrial cancer: a spotlight on the convergence of signaling pathways. Pathol. Res. Pract. 244, 154411. 10.1016/j.prp.2023.154411 - DOI - PubMed
    1. Baker-Rand H., Kitson S. J. (2024). Recent advances in endometrial cancer prevention, early diagnosis and treatment. Cancers 16, 1028. 10.3390/cancers16051028 - DOI - PMC - PubMed
    1. Bohnsack B. L., Kahana A. (2013). Thyroid hormone and retinoic acid interact to regulate zebrafish craniofacial neural crest development. Dev. Biol. 373, 300–309. 10.1016/j.ydbio.2012.11.005 - DOI - PMC - PubMed
    1. Bolf E. L., Gillis N. E., Davidson C. D., Cozzens L. M., Kogut S., Tomczak J. A., et al. (2021). Common tumor‐suppressive signaling of thyroid hormone receptor beta in breast and thyroid cancer cells. Mol. Carcinog. 60, 874–885. 10.1002/mc.23352 - DOI - PMC - PubMed
    1. Cao C., Zhou J., Xie S., Guo X., Li G., Gong Y., et al. (2019). Metformin enhances nomegestrol acetate suppressing growth of endometrial cancer cells and may correlate to downregulating mTOR activity in vitro and in vivo . IJMS 20, 3308. 10.3390/ijms20133308 - DOI - PMC - PubMed

LinkOut - more resources