. 2025 Apr 30:13:1541953.
doi: 10.3389/fcell.2025.1541953. eCollection 2025.

Solid stress compression enhances breast cancer cell migration through the upregulation of Interleukin-6

Affiliations

Solid stress compression enhances breast cancer cell migration through the upregulation of Interleukin-6

Farouq Azizan et al. Front Cell Dev Biol. .

Abstract

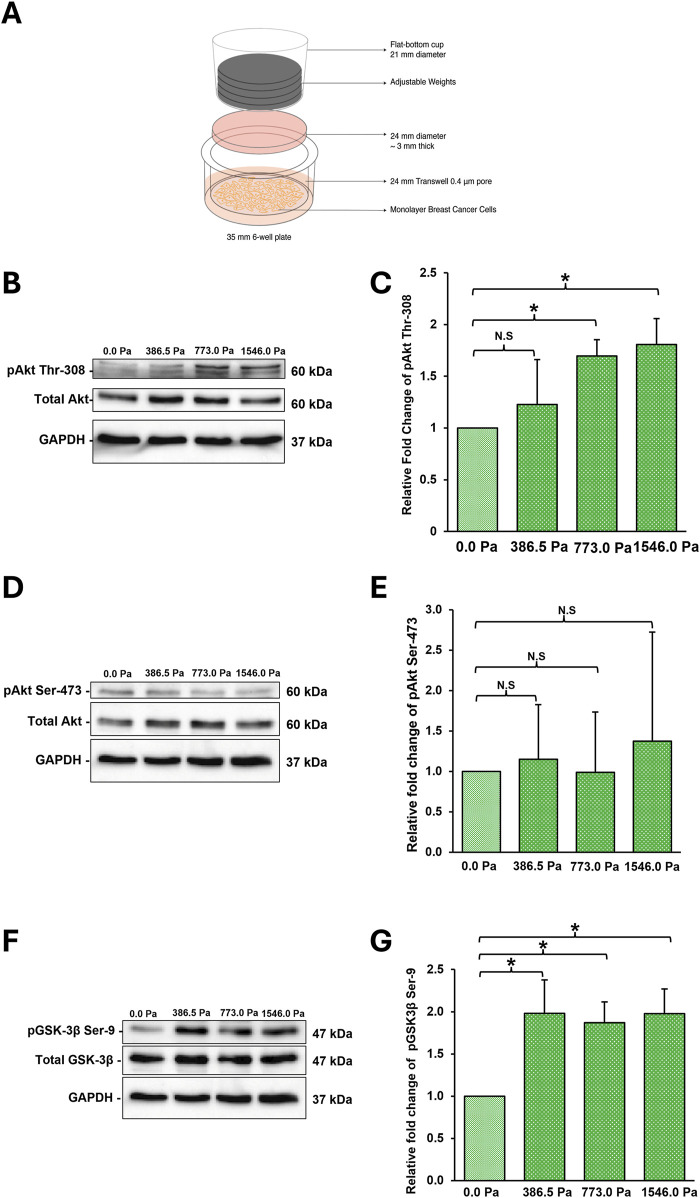
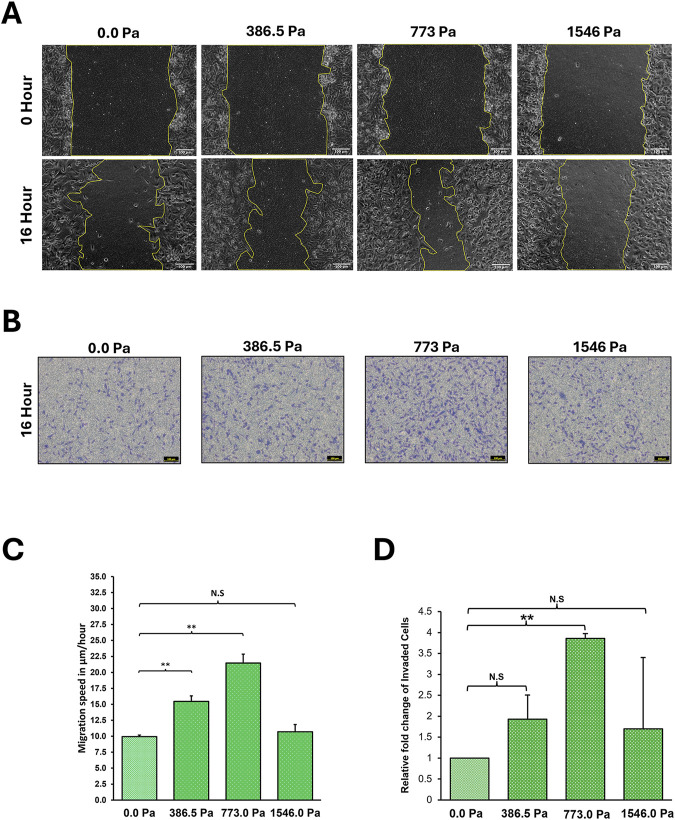
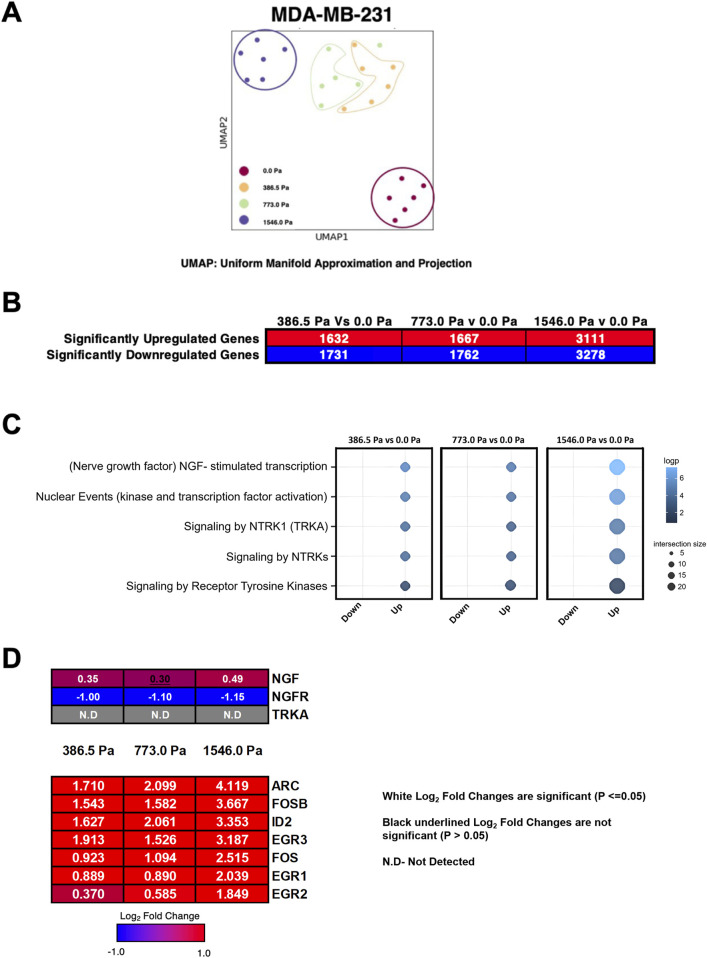
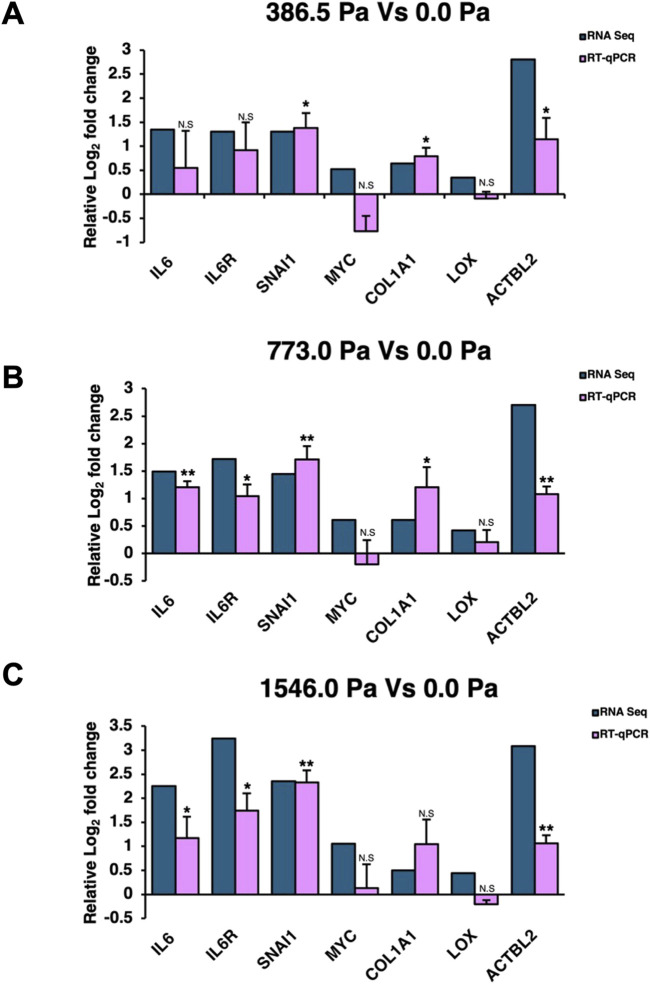
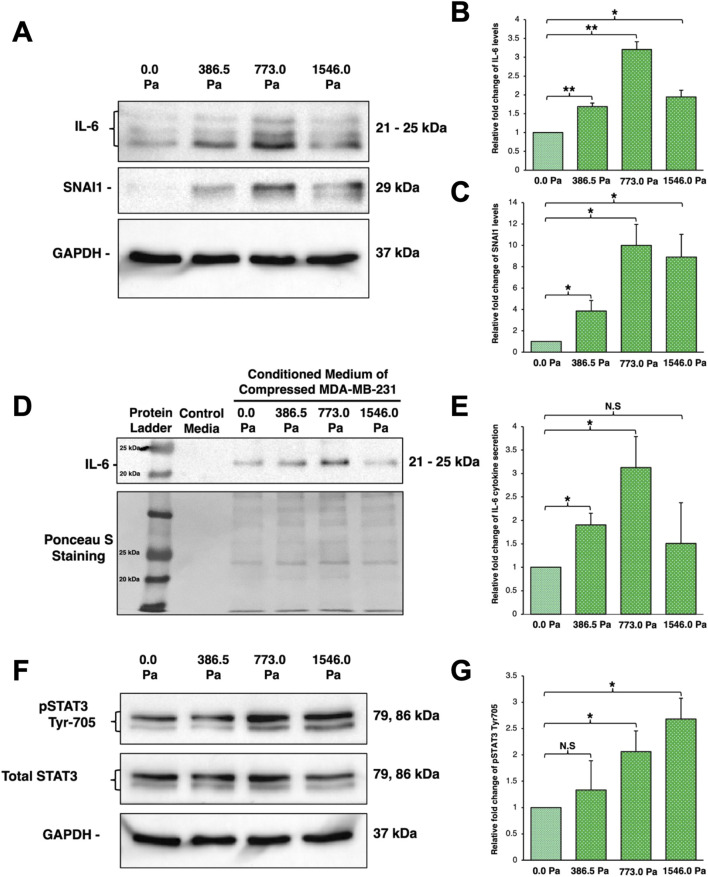
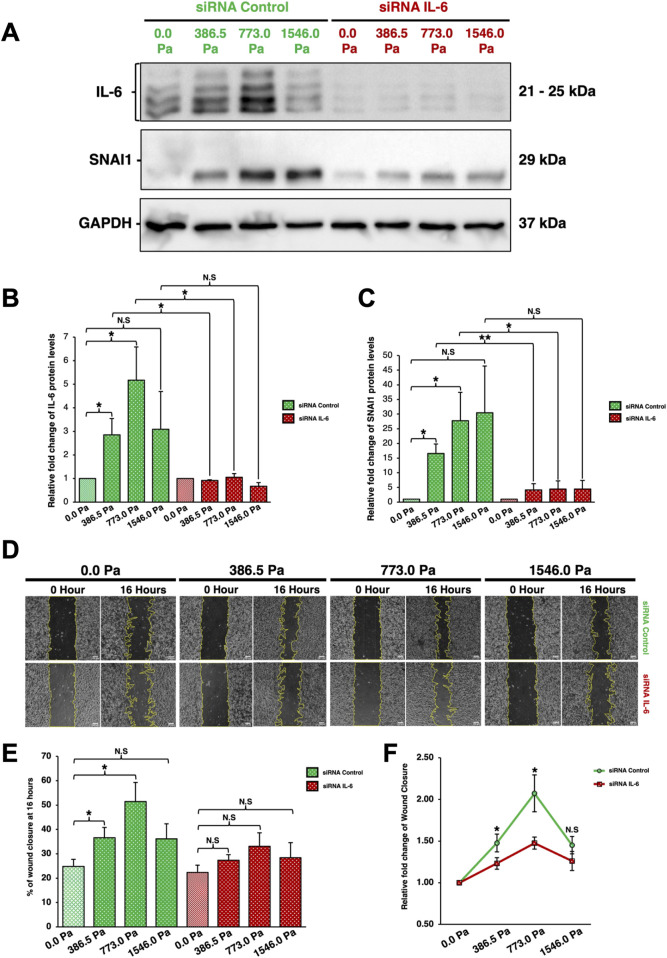
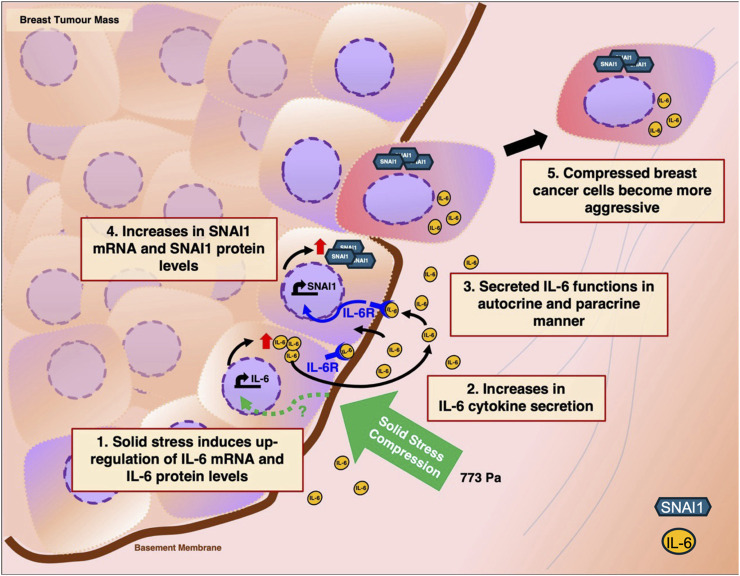
Apart from biochemical signals, tumour cells respond to biophysical and mechanical cues from their environment. The mechanical forces from the tumour microenvironment could be in the form of shear stress, tension, or solid stress compression. In this study, we explore the effects of solid stress compression on tumour cells. Solid stress compression, a prevalent biomechanical stimulus accumulated during tumour growth, has been shown to enhance invasive and metastatic phenotypes in cancer cells. However, the underlying molecular mechanism that elicits this aggressive metastatic phenotype, especially in breast cancer, is not extensively studied. Using an established 2D in vitro setup to apply incremental solid stress compression, we found that migratory and invasive capacities of aggressive breast cancer cells were enhanced in a biphasic manner. We also found that the transcript and protein levels of Interleukin-6 (IL-6) and SNAI1 were upregulated in response to solid stress. The resultant increased secretion of IL-6 could in turn lead to autocrine activation of downstream signalling pathways and impact on cancer cell migration and invasion.

Keywords: Interleukin-6; cell migration; mechanosensitive genes; solid stress compression; transcriptome.


Conflict of interest statement

The authors declare that the research was conducted in the absence of any commercial or financial relationships that could be construed as a potential conflict of interest.

Figures

FIGURE 1
FIGURE 1
MDA-MB-231 breast cancer cells respond to incremental solid stress compression (A) Illustration of 2D in vitro compression setup. Briefly, cells are seeded onto the transwell membrane. An agarose disk (2%, ∼3 mm think) is overlayed on top of the cells. Adjustable weights are then placed on the agarose disk. (B) Representative western blots highlighting significant changes in phosphorylation of Akt at Thr-308 in MDA-MB-231 cells under 16 h compression at incremental solid stress levels (C) Densitometry quantification was done using Image Lab for pAkt Thr-308. Bar graph represents the mean relative fold change as compared to uncompressed across three independent experiments (n = 3). Error bar represents standard deviation. Statistical analysis was performed using 2-tailed student T-test (*) p ≤ 0.05, (**) p ≤ 0.01 and (N.S) Not Significant. (D) Representative western blots monitoring phosphorylation of Akt at Ser-473 in MDA-MB-231 cells under 16 h compression at incremental solid stress levels (E) Densitometry quantification was done using Image Lab for pAkt Ser-473. Bar graph represents the mean relative fold change as compared to uncompressed across three independent experiments (n = 3). Error bar represents standard deviation. Statistical analysis was performed using 2-tailed student T-test as in 1(C). (F) Representative western blots highlighting significant changes in phosphorylation of GSK-3β at Ser-9 in MDA-MB-231 cells under 16 h compression at incremental solid stress levels (G) Densitometry quantification was done using Image Lab for pGSK-3β at Ser-9. Bar graph represents the mean relative fold change as compared to uncompressed across three independent experiments (n = 3). Error bar represents standard deviation. Statistical analysis was performed using 2-tailed student T-test as in 1(C).
FIGURE 2
FIGURE 2
Incremental solid stress compression impacts on MDA-MB-231 cell migration and invasion in a biphasic manner. (A) Representative Scratch-Wound Assay images highlighting the changes in MDA-MB-231 cell migration under 16 h compression at various solid stress levels – 386.5 Pa, 773.0 Pa and 1546.0 Pa. Uncompressed cells, 0.0 Pa, were covered with an agarose disk only. Scale bar: 100 μm. (B) Representative Invasion Assay images under 16 h compression at various solid stress levels – 386.5 Pa, 773.0 Pa and 1546.0 Pa. Uncompressed cells, 0.0 Pa, were covered with an agarose disk only. Scale bar: 100 μm. (C) Analysed by Image Lab, bar graph represents mean speed of wound closure from three independent experiments (n = 3). Error bars represent standard deviation. Statistical analysis was done using 2-tailed student T-test. (*) p ≤ 0.05, (**) p ≤ 0.01 and (N.S) Not Significant. (D) Fold changes of number of invaded cells under compression as compared to uncompressed cells. Bar graph represents the mean relative fold change of invaded cells from three independent experiments (n = 3). Error bars represent standard deviation. Statistical analysis was done using 2-tailed student T-test. (*) p ≤ 0.05, (**) p ≤ 0.01 and (N.S) Not Significant.
FIGURE 3
FIGURE 3
Incremental solid stress compression alters transcriptomes in MDA-MB-231 cells. (A) Uniform Manifold Approximation and Projection for Dimension Reduction (UMAP) of six replicates for all four experimental conditions in MDA-MB-231 cells (0.0 Pa, 386.5 Pa, 773.0 Pa and 1546.0 Pa). (B) Number of significantly up- and downregulated genes in MDA-MB-231 cells under respective solid stress pressures compared to uncompressed. (C) Reactome pathway analysis highlighting five highest ranked pathways. (D) Heatmap and Log2 fold changes of potential genes involved in the NGF-stimulated transcription pathway. Top panel: NGF (nerve growth factor), NGFR (nerve growth factor receptor), TRKA (tropomyosin receptor kinase A). Bottom panel: ARC (activity-regulated cytoskeleton-associated protein), FOSB (FosB Proto-Oncogene, AP-1 Transcription Factor Subunit), ID2 (Inhibitor of DNA Binding 2), EGR3 (early growth response 3), FOS (Fos Proto-Oncogene, AP-1 Transcription Factor Subunit), EGR1 (Early Growth Response 1), EGR2 (Early Growth Response 2). Log2 Fold changes in white fonts are significant (p ≤ 0.05) and Log2 fold changes in black underlined fonts are not significant (p > 0.05).
FIGURE 4
FIGURE 4
Solid stress compression implicates the activation of Interleukin-6 (IL-6) signalling pathway. (A) Representative volcano plot highlighting the top ∼40 upregulated (in red) and ∼40 downregulated (in blue) genes in MDA-MB-231 cells under 773.0 Pa in comparison to uncompressed cells (0.0 Pa). Arrows indicate the upregulation of IL-6, IL-6 Receptor and its potential downstream gene target, SNAI1. Respective volcano plots and table listing the top 40 upregulated and downregulated genes for all three incremental solid stress pressures are in Supplementary Figures 3–5. (B) Normalised Enrichment Score (NES) of IL-6 mediated signalling pathway in MDA-MB-231 cells under incremental solid stress pressures. (C) Heatmap and Log2 fold changes of potential genes involved in IL-6 signalling pathway. Top panel: IL6 (interleukin 6), IL6R (interleukin 6 receptor), IL6ST (interleukin 6 signal transducer or Glycoprotein 130). Bottom panel: SNAI1: snail family transcription repressor 1; FOXC1: forkhead box protein C1; JUNB: JunB proto-oncogene; HMGA2: high-mobility group AT-hook 3; ZEB2: zinc finger E-box binding homeobox 2. Log2 Fold changes in white fonts are significant (p ≤ 0.05).
FIGURE 5
FIGURE 5
Validation of RNA-Seq gene targets. Relative Log2 fold changes of selected gene targets from RNA-Seq and reverse transcription quantitative polymerase chain reaction (RT-qPCR) in (A) 386.5 Pa Vs 0.0 Pa data set, (B) 773.0 Pa Vs 0.0 Pa data set., and (C) 1546.0 Pa Vs 0.0 Pa data set. RT-qPCR data are from three independent repeats (n = 3) with error bars denoting standard deviation. Blue bars represent Log2 fold change of RNA-Seq and pink bars represent RT-qPCR Log2 fold changes.
FIGURE 6
FIGURE 6
Incremental solid stress compression upregulates protein levels of IL-6 and SNAI1 as well as secretion of IL-6 in a biphasic manner (A) Representative western blots of cell lysates harvested from MDA-MB-231 cells under 16 h of incremental solid stress compression using IL-6 and SNAI1 antibodies. GAPDH was used as loading control (B) Densitometry quantification of IL-6 protein levels using Image Lab. Bar graph represents the mean relative fold changes compared to uncompressed across three independent experiments (n = 3). Error bars represent standard deviation. Statistical analysis was performed using 2-tailed student T-test (*) p ≤ 0.05, (**) p ≤ 0.01 (C) Densitometry quantification of SNAI1 protein level using Image Lab. Bar graph represents the mean relative fold changes compared to uncompressed across three independent experiments (n = 3). Error bars represent standard deviation. Statistical analysis was performed using 2-tailed student T-test, (*) p ≤ 0.05, (**) p ≤ 0.01. (D) (Top) Representative Western blot of conditioned media harvested after 16 h of incremental solid stress compression and probed with anti-IL-6 antibody. (Bottom) Representative Ponceau S Staining highlighting equal protein loading of the conditioned media. (E) Densitometry quantification of IL-6 cytokine secretion using Image Lab. Bar graph represents the mean relative fold changes compared to uncompressed across three independent experiments (n = 3). Error bars represent standard deviation. Statistical analysis was performed using 2-tailed student T-test, (*) p ≤ 0.05 and (N.S) Not Significant. (F) Representative Western blot image using anti-phospho-STAT3 (pSTAT3) at Tyr-705 antibody for MDA-MB-231 cells under 16 h of incremental solid stress compression. (G) Densitometry quantification of pSTAT3 using Image Lab. Bar graph represents the mean relative fold changes compared to uncompressed across three independent experiments (n = 3). Error bars represent standard deviation. Statistical analysis was performed using 2-tailed student T-test, (*) p ≤ 0.05 and (N.S) Not Significant.
FIGURE 7
FIGURE 7
Interleukin-6 knockdown through siRNA-IL-6 downregulates SNAI1 protein and attenuates solid stress-induced cancer cell migration (A) Cells were transfected with control and IL-6 siRNAs. Different compressive stress was then applied. After 16 h of compression, cell lysates were harvested and analysed by Western blotting using the antibodies indicated. Representative western blots of cells under 16 h of incremental solid stress compression are shown here. (B) Densitometry quantification of IL-6 using Image Lab. Bar graph represents the mean relative fold changes compared to uncompressed across three independent experiments (n = 3). Error bars represent standard deviation. Statistical analysis was performed using 2-tailed student T-test, (*) p ≤ 0.05, (**) p ≤ 0.01 and (N.S) Not Significant. (C) Densitometry quantification of SNAI1 using Image Lab. Bar graph represents the mean relative fold changes compared to uncompressed across three independent experiments (n = 3). Error bars represent standard deviation. Statistical analysis was performed using 2-tailed student T-test, (*) p ≤ 0.05, (**) p ≤ 0.01 and (N.S) Not Significant. (D) Representative Scratch-Wound Assay images highlighting cell migration alterations between cells transfected with siRNA-Control or siRNA-IL-6 under 16 h compression at various solid stress levels – 386.5 Pa, 773.0 Pa and 1546.0 Pa. Uncompressed cells, 0.0 Pa, were covered with an agarose disk only. Scale bar: 100 μm. (E) Analysis was done using Image Lab. Bar graph represents mean percentages of wound closure from three independent experiments (n = 3). Error bars represent standard deviation. Statistical analysis was performed using 2-tailed student T-test. (*) p ≤ 0.05, and (N.S) Not Significant. (F) Relative fold change of wound closure comparison between cells transfected with either siRNA-Control or siRNA-IL-6. Error bars represent standard deviation. Statistical analysis was performed using 2-tailed student T-test. (*) p ≤ 0.05, and (N.S) Not Significant.
FIGURE 8
FIGURE 8
Proposed working model on how solid stress compression enhances the metastatic phenotype of breast cancer cells through the upregulation of Interleukin-6. 1. Rapid expansion of tumour mass results in the exertion of solid stress compression on breast cancer cells, in particular the peripheral layer of cells. Consequently, mechanotransduction of solid stress compression results in the upregulation of IL-6 mRNA and IL-6 protein levels through a pathway still not known (green dotted arrow). 2. The compressed breast cancer cells secrete more IL-6 cytokines into the tumour microenvironment. 3. Secreted IL-6 cytokines then function in autocrine and paracrine manners. 4. Increased IL-6 secretion results in the activation of IL-6 receptors which in turn leads to upregulation of SNAI1 mRNA and protein levels. 5. Compressed breast cancer cells with elevated IL-6 and SNAI1 proteins gain a more aggressive phenotype, migrate away from primary tumour site and invade neighbouring tissues.

Similar articles

References

    1. Abaurrea A., Araujo A. M., Caffarel M. M. (2021). The role of the IL-6 cytokine family in epithelial-mesenchymal plasticity in cancer progression. Int. J. Mol. Sci. 22, 8334. 10.3390/ijms22158334 - DOI - PMC - PubMed
    1. Blythe N. M., Muraki K., Ludlow M. J., Stylianidis V., Gilbert H. T. J., Evans E. L., et al. (2019). Mechanically activated Piezo1 channels of cardiac fibroblasts stimulate p38 mitogen-activated protein kinase activity and interleukin-6 secretion. J. Biol. Chem. 294, 17395–17408. 10.1074/jbc.RA119.009167 - DOI - PMC - PubMed
    1. Bruno F., Arcuri D., Vozzo F., Malvaso A., Montesanto A., Maletta R. (2022). Expression and signaling pathways of nerve growth factor (NGF) and pro-NGF in breast cancer: a systematic review. Curr. Oncol. 29, 8103–8120. 10.3390/curroncol29110640 - DOI - PMC - PubMed
    1. Chen J., Wei Y., Yang W., Huang Q., Chen Y., Zeng K., et al. (2022). IL-6: the link between inflammation, immunity and breast cancer. Front. Oncol. 12, 903800. 10.3389/fonc.2022.903800 - DOI - PMC - PubMed
    1. Chen Q., Yang D., Zong H., Zhu L., Wang L., Wang X., et al. (2017). Growth-induced stress enhances epithelial-mesenchymal transition induced by IL-6 in clear cell renal cell carcinoma via the Akt/GSK-3β/β-catenin signaling pathway. Oncogenesis 6, e375. 10.1038/oncsis.2017.74 - DOI - PMC - PubMed

LinkOut - more resources