. 2025 May 5;4(5):pgaf143.
doi: 10.1093/pnasnexus/pgaf143. eCollection 2025 May.

Immunotherapy of endometrial cancer via CD47 blockade-mediated macrophage phagocytosis

Affiliations

Immunotherapy of endometrial cancer via CD47 blockade-mediated macrophage phagocytosis

Kerem Yucebas et al. PNAS Nexus. .

Abstract

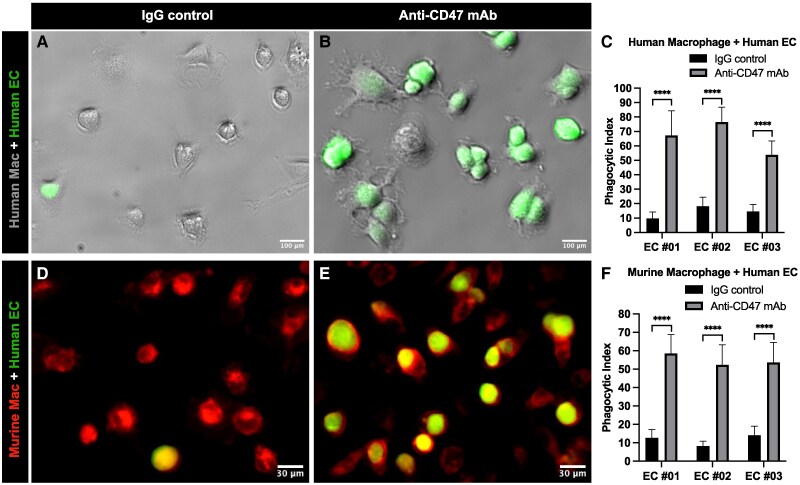
The interaction between CD47 expressed on cancer cells and signal regulatory protein-α located on macrophages blocks the phagocytosis of tumor cells by macrophages. Our data reveal that human endometrial cancer cells (hECCs) upregulate the CD47 level on their surface and that there is a high density of tumor-associated macrophages within the microenvironment of human endometrial cancer. In vitro functional assay shows that an anti-CD47 monoclonal antibody (mAb) promotes the phagocytosis of hECCs by macrophages. Systemic and in situ treatments with an anti-CD47 mAb effectively reduce tumor burden in vivo in a genetically engineered mouse model of endometrial cancer. Thus, this study provides preclinical evidence that CD47 blockade using an anti-CD47 mAb to augment macrophage phagocytosis is a potential therapeutic strategy for endometrial cancer.

Keywords: Biological Sciences; CD47; Medical Sciences; endometrial cancer; immunotherapy; macrophage; phagocytosis.


Figures

Fig. 1.
Fig. 1.
Pathophysiology of human EC. A) Representative fresh human uterine tissue with (left) and without (right) EC. The black dotted line demarcates the EC at the top and myometrium at the bottom. B) Representative H&E staining of human uterine tissue with (left) and without (right) EC. The cancerous uterine tissue contains a thick EC at the top connected with myometrium at the bottom; the border is outlined by a black dotted line. C) Representative IF staining for EpCAM in human uterine tissue section with (left) and without (right) EC. The cancerous uterine tissue contains a thick EpCAM-labeled (magenta) EC top layer connected with bottom myometrium stained with DAPI as blue. The right noncancerous uterine tissue contains a thin EpCAM-labeled magenta normal endometrial layer above the blue bottom myometrium. Twenty uterine samples with cancer and 16 uterine samples without cancer were analyzed. EpCAM is a specific marker of normal epithelial cells or carcinoma cancer cells. DAPI staining was used to label cell nuclei and to assess gross cell morphology. Scale bar: centimeter (CM) in A) and 1,000 μm in B) or C).
Fig. 2.
Fig. 2.
Up-regulation of CD47 expression in hECCs. A) IF staining of CD47 on human uterine tissue sections with (EC, n = 42) or without (PM, n = 23) EC. A stronger green fluorescence signal of CD47 staining on the surface of hECCs was detected compared with control PM endometrial epithelia with a basal level of fluorescence signal (PM). EpCAM was applied to label carcinoma cancer cells in EC or normal epithelial cells in PM shown as magenta. The cell proliferation was assessed by KI67 antibody staining as red. The quantification of cell proliferation is shown in Fig. S3. Blue DAPI staining was used to label cell nuclei and to assess gross cell morphology. B) Fluorescence intensity of CD47 staining in EC (n = 42) and PM (n = 23). ImageJ was used to measure the fluorescence staining signal of CD47. Thirty stained spots in EC or PM epithelium per human uterine sample were randomly captured for analysis. AU, arbitrary units. C) Level of CD47 protein in EC (n = 34) or PM (n = 16). ELISA was used to measure the CD47 protein level in EC tissue homogenate or in control endometrial tissue homogenate of PM. Thirty micrograms of total protein per human endometrial sample were used. Each dot in B) and C) represents a uterine tissue sample from a different patient. Data were analyzed by t test using Prism 10. *P < 0.05; ****P < 0.0001. Scale bar: 100 μm.
Fig. 3.
Fig. 3.
Significant tumor-associated immune cell infiltration in human EC. A) Assessment of CD68+ macrophages in human uterine endometrium with (EC) or without (PM) cancer. IF staining for CD68 was applied to identify TAMs in human EC (n = 38) or normal macrophages in control PM endometrium (n = 23) shown as green. Quantification of CD68+ TAMs in human EC and normal macrophages in PM. B) Assessment of CD8+ cytotoxic T cells in human uterine endometrium with (EC) or without (PM) cancer. IF staining for CD8 was applied to identify cytotoxic T cells in human EC (n = 22) or in control PM endometrium (n = 18) shown as green. Quantification of CD8+ cytotoxic T cells in human EC and PM. C) Assessment of CD4+ helper T cells in human uterine endometrium with (EC) or without (PM) cancer. IF staining for CD4 was applied to identify helper T cells in human EC (n = 26) or in control PM endometrium (n = 13) shown as green. Quantification of CD4+ helper T cells in human EC and PM. The immune cells within a tissue area of 0.29 mm2 under 40× magnification were counted based on the green fluorescence signal using a Leica DM5500 B automated upright microscope. At least four tissue areas in EC or PM endometrium per human uterine sample were randomly captured for analysis. Each dot in the quantification charts represents a uterine tissue sample from a different patient. Data were analyzed by t test using Prism 10. ****P < 0.0001; **P < 0.05. Scale bar: 200 μm.
Fig. 4.
Fig. 4.
CD47 protects hECCs from phagocytosis by macrophages. Phagocytosis assay using primary hECCs and healthy human macrophages. CFSE-labeled green hECCs (green) were incubated with macrophages derived from human peripheral blood monocytes in the presence of IgG1 isotype control (A) or an anti-CD47 (clone B6H12) mAb antibody (B), and their phagocytic indices were calculated (C). Phagocytosis assay using primary hECCs and normal mouse macrophages. CFSE-labeled hECCs (green) were incubated with RFP-labeled mouse bone marrow-derived macrophages in the presence of IgG1 isotype control (D) or an anti-CD47 (clone B6H12) mAb (E), and their phagocytic indices were calculated (F). The human macrophages were derived from one healthy human sample. The primary EC cells isolated from three independent human EC samples (EC#01, EC#02, and EC#03) were used. Each experiment was repeated for three times. More macrophages containing ingested green cancer cells were found in the anti-CD47 antibody treatment groups. Two-way ANOVA was performed with GraphPad Prism 10 for statistical analysis. ****P < 0.0001. Scale bar: 100 μm in human macrophage + human EC; 30 μm in murine macrophage + human EC.
Fig. 5.
Fig. 5.
Systemic treatment with an anti-CD47 mAb reduces EC burden. A) A schematic of systemic treatment with a CD47 blocking antibody. Anti-CD47 mAb (n = 7 mice) or control IgG (n = 8 mice) was given via IP injection to 1-month-old PR-cre+/−;Ptenflox/flox female mice twice per week for 8 weeks at 100 μg in 100 μL PBS per injection each mouse. B) Morphology of uteri posttreatment. Representative uteri from either anti-CD47 mAb or control IgG treatment groups were dissected out and imaged. C) Histology analysis of uteri posttreatments. H&E staining of uterine cross tissue sections shows a thin endometrium in the anti-CD47 mAb treatment group. IF staining of EpCAM was applied for labeling EC cells shown as green. D) Assessment of CD4+ helper T cells or CD8+ cytotoxic T cells by IF staining in uterus tissue from anti-CD47 mAb or control IgG treatment groups. E) Weight of uteri posttreatment with an anti-CD47 mAb or control IgG. F) Weight of bodies posttreatment with an anti-CD47 mAb or control IgG. G) EpCAM+ epithelia tumor area in uterus tissue from anti-CD47 mAb or control IgG treatment groups. H) Quantification of CD4+ helper T cells in uterus tissue from either anti-CD47 mAb or control IgG treatment groups. I) Quantification of CD8+ cytotoxic T cells in uterus tissue from either anti-CD47 mAb or control IgG treatment groups. Blue DAPI staining was used to label cell nuclei and to assess gross cell morphology. Each dot in E) and F) represents an individual animal. The size of the green EpCAM+ area of fluorescence was measured using ImageJ software to evaluate tumor size, at least five cross-sectional images per uterus for analysis, three uteri per treatment. The immune cells within a tissue area of 0.29 mm2 under 40× magnification were counted based on the red fluorescence signal using a Leica DM5500 B automated upright microscope. At least nine tissue areas in each mouse uterus were randomly captured for analysis, three uteri per treatment. Data were analyzed by t test using Prism 10. *P < 0.05; ****P < 0.0001; nsP > 0.05. Scale bar: 1,000 μm in C) and 100 μm in D).
Fig. 6.
Fig. 6.
In situ treatment with an anti-CD47 mAb reduces EC burden. A) A schematic of in situ treatment with a CD47 blocking antibody. Anti-CD47 mAb (n = 10 mice) or control IgG (n = 5 mice) was given daily via TV delivery to 1-month-old PR-cre+/−;Ptenflox/flox female mouse uterine lumen for 8 weeks at 10 μL of 25 μg per delivery each mouse. B) Morphology of uteri posttreatment. Representative uteri from anti-CD47 mAb or control IgG treatment groups were dissected out and imaged. C) Histology analysis of uteri posttreatments. H&E staining of uterine cross tissue sections shows a thin endometrium in the anti-CD47 mAb treatment group. IF staining of EpCAM was applied for labeling EC cells shown as green. D) Assessment of CD4+ helper T cells or CD8+ cytotoxic T cells by IF staining in uterus tissue from anti-CD47 mAb or control IgG treatment groups. E) Weight of uteri posttreatment with an anti-CD47 mAb or control IgG. F) Weight of bodies posttreatment with an anti-CD47 mAb or control IgG. G) EpCAM+ epithelia tumor area in uterus tissue from anti-CD47 mAb or control IgG treatment groups. H) Quantification of CD4+ helper T cells in in uterus tissue from either anti-CD47 mAb or control IgG treatment groups. I) Quantification of CD8+ cytotoxic T cells in uterus tissue from either anti-CD47 mAb or control IgG treatment groups. Blue DAPI staining was used to label cell nuclei and to assess gross cell morphology. Each dot in E) and F) represents an individual animal. The size of the green EpCAM+ area of fluorescence was measured using ImageJ software to evaluate tumor size, at least five cross-sectional images per uterus for analysis, three uteri per treatment. The immune cells within a tissue area of 0.29 mm2 under 40× magnification were counted based on the red fluorescence signal using a Leica DM5500 B automated upright microscope. At least nine tissue areas in each mouse uterus were randomly captured for analysis, three uteri per treatment. Data were analyzed by t test using Prism 10. *P < 0.05; ****P < 0.0001; nsP > 0.05. Scale bar: 1,000 μm in C) and 100 μm in D).

References

    1. Mellman I, Coukos G, Dranoff G. 2011. Cancer immunotherapy comes of age. Nature. 480(7378):480–489. - PMC - PubMed
    1. Leach DR, Krummel MF, Allison JP. 1996. Enhancement of antitumor immunity by CTLA-4 blockade. Science. 271(5256):1734–1736. - PubMed
    1. Iwai Y, et al. 2002. Involvement of PD-L1 on tumor cells in the escape from host immune system and tumor immunotherapy by PD-L1 blockade. Proc Natl Acad Sci U S A. 99(19):12293–12297. - PMC - PubMed
    1. Hirayama D, Iida T, Nakase H. 2017. The phagocytic function of macrophage-enforcing innate immunity and tissue homeostasis. Int J Mol Sci. 19(1):92. - PMC - PubMed
    1. Jaiswal S, Chao MP, Majeti R, Weissman IL. 2010. Macrophages as mediators of tumor immunosurveillance. Trends Immunol. 31(6):212–219. - PMC - PubMed

LinkOut - more resources