. 2025 Mar 25;12(7):uhaf092.
doi: 10.1093/hr/uhaf092. eCollection 2025 Jul.

Metabolite-mediated responses of phyllosphere microbiota to powdery mildew infection in resistant and susceptible black currant cultivars

Affiliations

Metabolite-mediated responses of phyllosphere microbiota to powdery mildew infection in resistant and susceptible black currant cultivars

Xueying Zhao et al. Hortic Res. .

Abstract

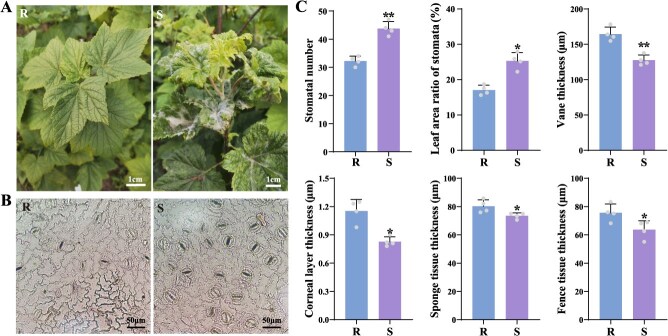
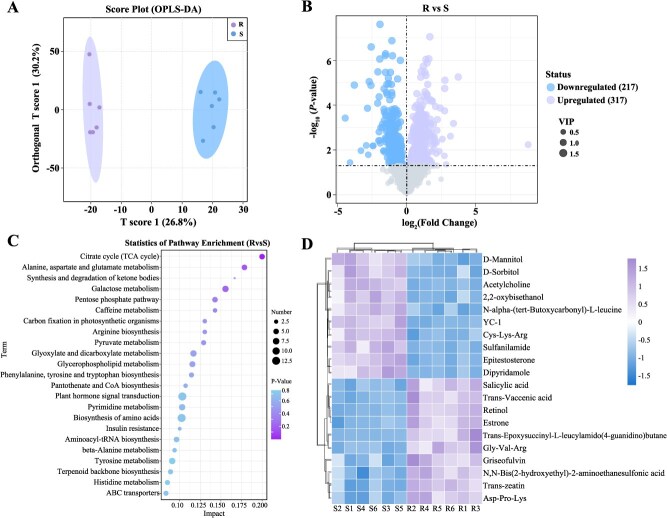
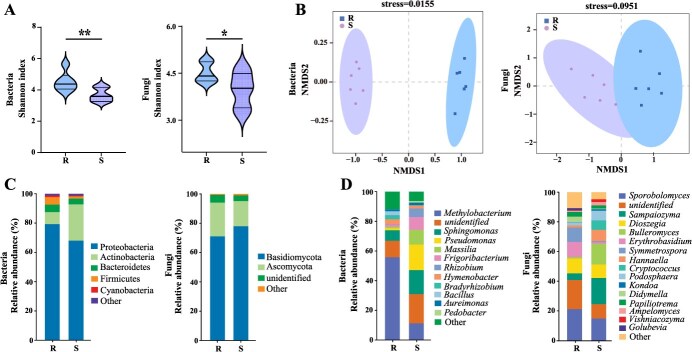
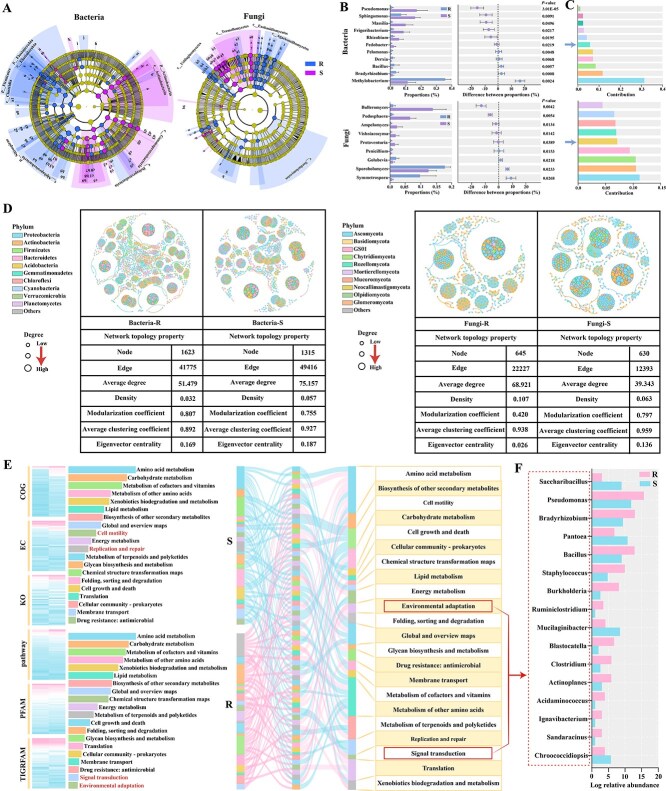
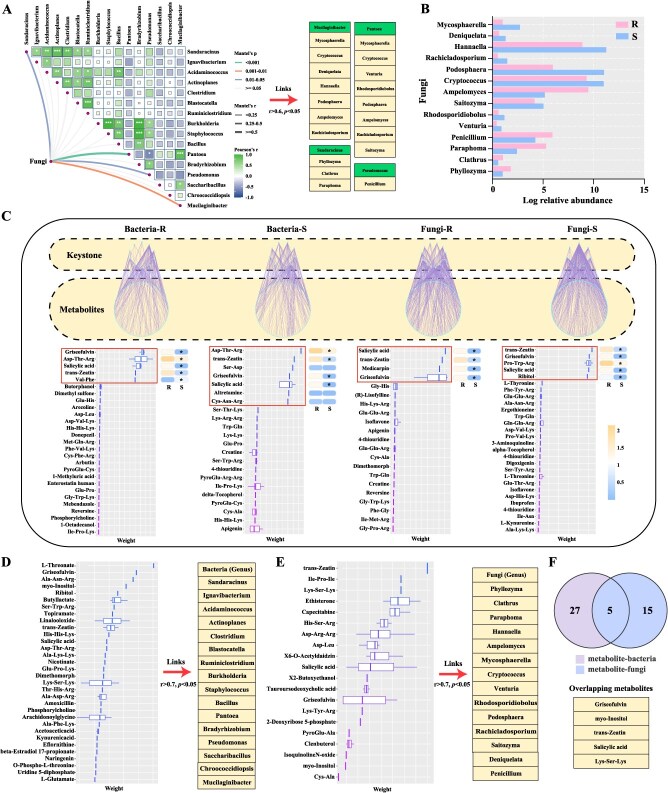
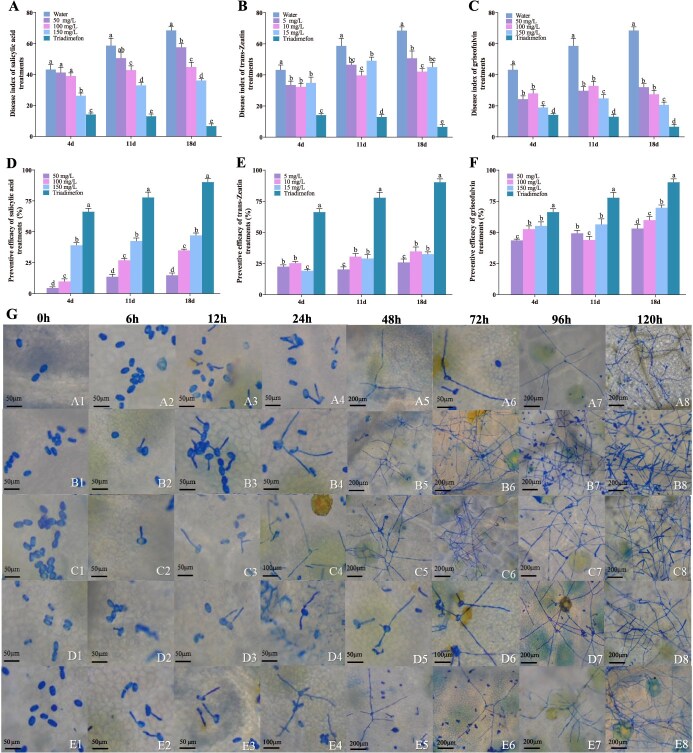
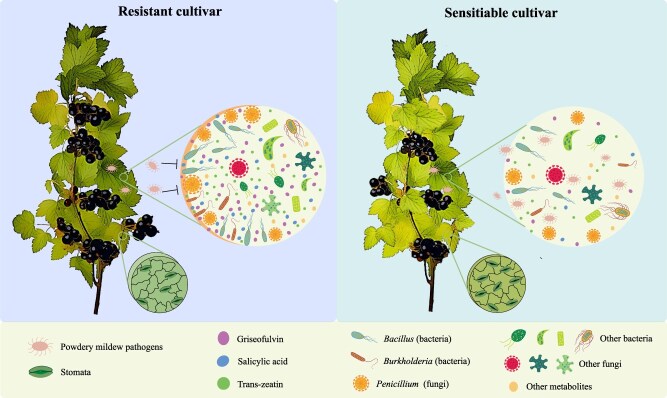
Plant-metabolite-microbe interactions play essential roles in disease suppression. Most studies focus on the root exudates and rhizosphere microbiota to fight soil-borne pathogens, but it is poorly understood whether the changes in phyllosphere metabolites can actively recruit beneficial microbes to enhance disease resistance. In this study, the differences of phyllosphere microbial communities and key leaf metabolites were systematically explored in resistant and susceptible black currant cultivars related to powdery mildew (PM) by integrating microbiome and metabolomic analyses. The results showed that the diversity and composition of microbiome changed, as highlighted by a reduction in microbial alpha-diversity and beta-diversity of susceptible cultivars. An increasing fungal network complexity and a decreasing bacterial network complexity occurred in resistant cultivar. Bacillus, Burkholderia (bacteria), and Penicillium (fungi) were identified as keystone microorganisms and resistance effectors in resistant cultivar. Metabolites such as salicylic acid, trans-zeatin, and griseofulvin were more abundant in resistant cultivar, which had a positive regulatory effect on the abundance of bacterial and fungal keystones. These findings unravel that resistant cultivar can enrich beneficial microorganisms by adjusting leaf metabolites, thus showing the external disease-resistant response. Moreover, the reduced stomatal number and increased tissue thickness were observed in resistant cultivar, suggesting inherent physical structure also provides a basic defense against PM pathogens. Therefore, resistant black currant cultivar displayed multilevel defense responses of physical structures, metabolites, and microorganisms to PM pathogens. Collectively, our study highlights the potential for utilizing phyllosphere microbiome dynamics and metabolomic adjustments in agricultural practices, plant breeding, and microbiome engineering to develop disease-resistant crops.


Conflict of interest statement

The authors declare that there are no conflicts of interest regarding the publication of this paper.

Figures

Figure 1
Figure 1
Molecular analysis and identification of PM pathogen in black currant. (A) Phylogenetic tree based on the ITS sequences derived from different plant species. The ITS sequence in this study was indicated by red stars. (B) Sequences comparison of PM pathogen.
Figure 2
Figure 2
Differences in phenotype and leaf structure of the resistant and susceptible black currant cultivars. (A) Morphological characteristics. (B) Lower epidermal stomata. (C) Comparison of leaf structures. The bars represented standard deviation. Statistical significance was indicated by asterisks (*P < 0.05, **P < 0.01). R: resistant cultivar ‘16A’, S: susceptible cultivar ‘Bright leaf’.
Figure 3
Figure 3
Variation in leaf metabolites of the resistant and susceptible black currant cultivars to PM infection. (A) OPLS-DA scores of metabolomes in PM-resistant and susceptible cultivars. (B) Volcano map analysis. (C) KEGG enrichment analysis of DAMs between R and S. (D) The heatmap of metabolites in the top 20 VIP values. The color intensity reflects variations in the relative abundances after normalization and standardization across the samples.
Figure 4
Figure 4
The composition in phyllosphere microbial community. (A) Simpson index, statistical significance was denoted by asterisks (*P < 0.05, **P <  0.01). (B) NMDS analysis. (C) Relative abundances at the phylum level. (D) Relative abundances at the genus level.
Figure 5
Figure 5
Prediction of biomarkers and keystone in microbial community, as well as function of phyllosphere bacterial community in R and S. (A) Bacterial and fungal biomarkers in different cultivars. The circle nodes represent the bacterial and fungal taxa, and the connectivity degree is indicated by the node size. (B) The difference of main bacteria and fungi between R and S according to Welch’s t-test (genus level). (C) The SIMPER analysis between R and S. (D) Visual network and topology statistics of bacterial/fungal co-occurrence in R and S. (E) Functional prediction of phyllosphere bacteria based on six databases. COG: Clusters of Orthologous Groups; EC: Enzyme Commission; KO: KEGG Orthology; pathway: KEGG Pathway; PFAM: Protein Family Database; TIGRFAM: TIGR Gene Family Database. (F) The relative abundance of 16 bacterial genera with significant differences between R and S.
Figure 6
Figure 6
Metabolome and phyllosphere microbiome interactions. (A) Mantel tests of the ‘disease resistance effectors’ of bacteria and fungi networks (r > 0.6, P < 0.05). (B) The relative abundance of core fungal genera between R and S. (C) The microbial community characteristic structure between R and S, and the prediction of weight ranking of high-effects metabolites, as well as the heatmap of distinct metabolites. (D) A Spearman correlation model (r > 0.7, P < 0.05) between ‘disease resistance effectors’ of bacteria and metabolite, and the metabolite weight ranking. (E) A Spearman correlation model (r > 0.7, P < 0.05) between core fungal genera and metabolite, and the metabolite weight ranking. (F) A Venn diagram based on the statistics of the frequent occurrence of the same metabolites in the two groups of metabolite–bacteria versus metabolite–fungi.
Figure 7
Figure 7
Validation of three key metabolites acting on PM pathogen suppression. (A–C) The disease indexes of plants treated with different concentrations of SA, trans-zeatin. and griseofulvin, respectively. (D–F) The preventive efficacy of plants treated with different concentrations of SA, trans-zeatin, and griseofulvin, respectively. (G) Spore growth characters with spraying water and different concentrations of griseofulvin at 0, 6, 12, 24, 48, 72, 96, and 120 h after PM pathogen inoculation. A1–A8: Spray water on resistant cultivar; B1–B8: Spray water on susceptible cultivar; C1–C8: Spray 50 mg/l griseofulvin on susceptible cultivar; D1–D8: Spray 100 mg/l griseofulvin on susceptible cultivar; E1–E8: Spray 150 mg/l griseofulvin on susceptible cultivar.
Figure 8
Figure 8
The mechanism of resistant cultivar enhances resistance to PM pathogens in the black currant phyllosphere.

Similar articles

References

    1. Woznicki TL, Heide OM, Sønstebyc A. et al. Effects of controlled post-flowering temperature and daylength on chemical composition of four black currant (Ribes nigrum L.) cultivars of contrasting origin. Sci Hortic. 2015;197:627–36
    1. Qin D, Wang H, Zhang C. et al. Effects of GA3 and ABA on the respiratory pathways during the secondary bud burst in black currants. J For Res. 2017;28:705–12
    1. Qin D, Zhao L, Gary G. et al. Effects of fruit thinning on ascorbate–glutathione cycle metabolism in black currants (Ribes nigrum L.). J For Res. 2017;28:903–8
    1. Li W, Qin D, Ma R. et al. Comparative evaluation of physiological and molecular responses of black currant varieties to powdery mildew infection. Front Plant Sci. 2024;15:1445839. - PMC - PubMed
    1. Kampuss K, Strautina S, Kampuse S. Red and white currant genetic resources in Latvia. Acta Hortic. 2007;760:397–403

LinkOut - more resources