. 2025 Jun 15;138(12):jcs263850.
doi: 10.1242/jcs.263850. Epub 2025 Jun 20.

A data-driven model for mitochondrial inner membrane remodeling as a driving force of organelle shaping

Affiliations

A data-driven model for mitochondrial inner membrane remodeling as a driving force of organelle shaping

Noga Preminger et al. J Cell Sci. .

Abstract

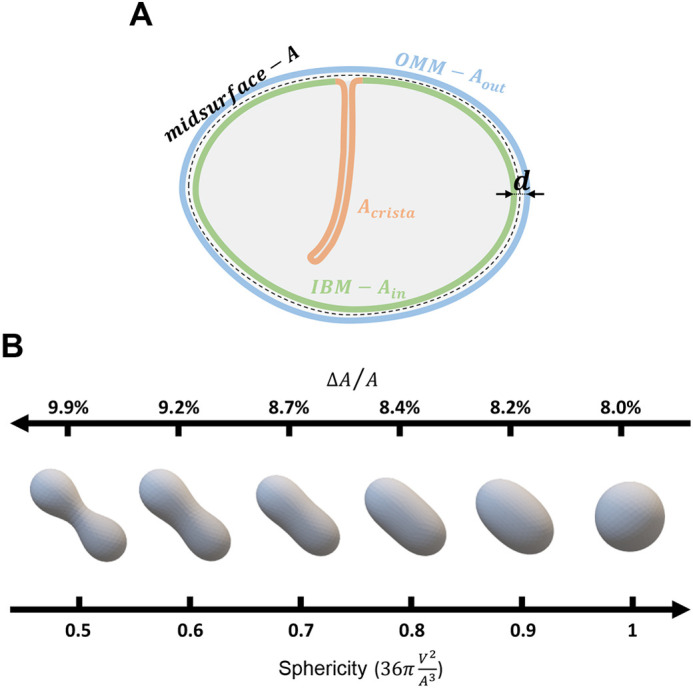
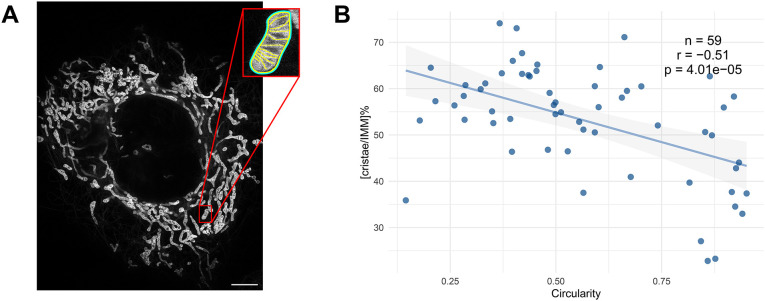
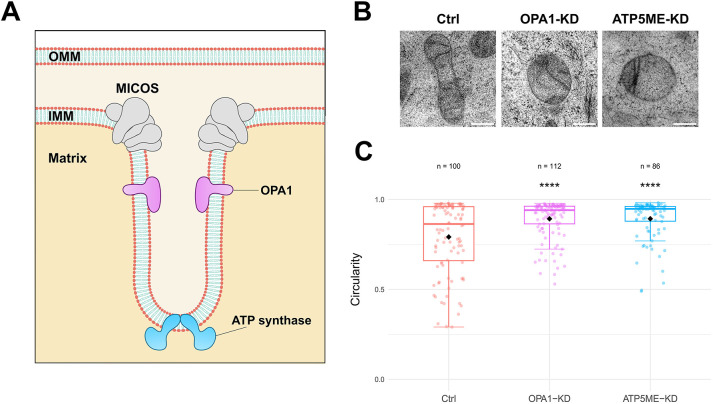
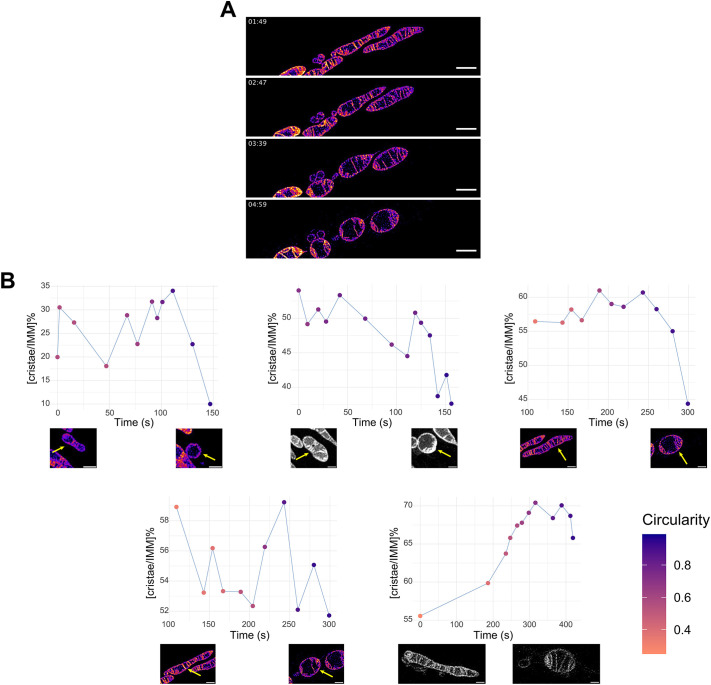
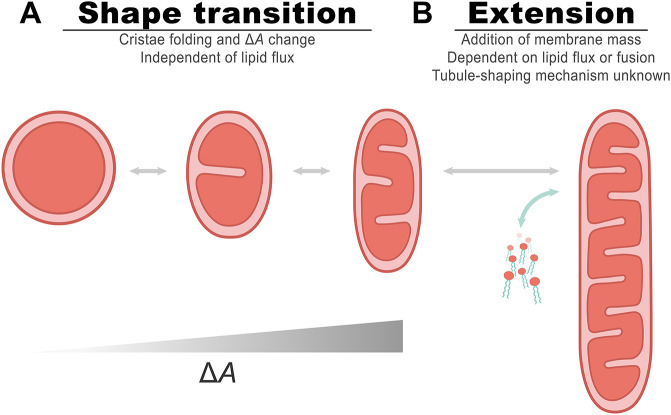
Mitochondria are dynamic organelles exhibiting diverse shapes. Although variation in mitochondrial shapes, which range from spheres to elongated tubules, and the transitions between them are clearly seen in many cell types, the molecular mechanisms governing this morphological variability remain poorly understood. Here, we propose a biophysical model for the shape transition between spheres and tubules based on the interplay between the inner and outer mitochondrial membranes. Our model suggests that the difference in surface area, arising from folding of the inner membrane into cristae, correlates with mitochondrial elongation. Analysis of live-cell super-resolution microscopy data supports this correlation, linking elongated shapes to the extent of cristae in the inner membrane. Knocking down cristae-shaping proteins further confirms the impact on mitochondrial shape, demonstrating that defects in cristae formation correlate with mitochondrial sphericity. Our results suggest that the dynamics of the inner mitochondrial membrane are not only important for simply creating surface area required for respiratory capacity but go beyond that to affect the whole organelle morphology. This work explores the biophysical foundations that govern the shape of individual mitochondria, suggesting potential links between mitochondrial structure and function. This should be of profound significance, particularly in the context of disrupted cristae-shaping proteins and their implications in mitochondrial diseases.

Keywords: Biophysical model; Cristae; Membrane remodeling; Mitochondrial membranes; Mitochondrial shape; Organelle shape.


Conflict of interest statement

Competing interests The authors declare no competing or financial interests.

Figures

Fig. 1.
Fig. 1.
Modeling membrane surface area as a driving force for organelle shape change. (A) A schematic representation and main parameters of the model. The OMM is shown by the blue line, and its surface area is denoted by Aout. The IMM is composed of (1) the IBM, which is shown by the green curve, and (2) the cristae membrane, which is shown by the orange curve. The surface area of the IBM is denoted by Ain. The mid-surface, which is the imaginary surface found between the outer and inner membranes, is shown by the dashed curve, and its surface area is denoted by A. The distance between the inner and outer membranes is d. (B) Computed results of elastic energy minimization of shapes with a varying difference between the inner and outer membrane surface area. Starting from a spherical shape, as the area difference increases, the sphericity decreases. At small perturbations, the sphere elongates and resembles a prolate ellipsoid. With further increased area difference, the middle part of the shape constricts in a peanut-shaped structure. The normalized area differences, ΔA/A, of the shapes are calculated for shape evolution starting with a sphere with a diameter of 500 nm and an intermembrane distance, d, of 10 nm, while preserving the surface area during the shape evolution.
Fig. 2.
Fig. 2.
The extent of cristae correlates with the degree of circularity. (A) HeLa cells were stained with PKMO (an IMM dye) and imaged using live-cell STED (Liu et al., 2022). The IBM and cristae of individual mitochondria (example in inset) were traced and measured. Scale bar: 5 µm. (B) The percentage of cristae length out of the total IMM length in each mitochondrion, [cristae/IMM]%, was plotted against the circularity measured for the shape of the mitochondrion, where a circularity value of 1 indicates a perfect circle. A Pearson's correlation test (two-tailed) was performed. The line represents a linear regression fit and the shaded area indicates the 95% c.i. n, number of analyzed mitochondria; r, Pearson's correlation; p, P-value.
Fig. 3.
Fig. 3.
Knockdowns of cristae-shaping proteins affect mitochondrial shape. (A) Scheme of a crista and cristae-shaping proteins. (B) Representative EM recordings of mitochondria in HeLa cells transfected with a control (Ctrl) siRNA pool or an siRNA pool for knockdown (KD) of cristae-shaping proteins, as indicated. Scale bars: 200 nm. (C) Circularity measurements of mitochondria sampled from Ctrl and KD cells. Each dot represents one mitochondrion. Horizontal lines within boxes indicate the median, black dots indicate the mean. Boxes show the interquartile range (IQR), and whiskers extend to 1.5× IQR from the Q1 and Q3 boundaries (Tukey method). Student's t-test (unpaired two-tailed) was used to compare to the control. n, number of analyzed mitochondria; ****P≤0.0001.
Fig. 4.
Fig. 4.
Time-resolved analysis of cristae extent during mitochondrial shape transition. (A) Representative snapshots extracted from time-lapse STED recordings (taken from Wang et al., 2019; republished with permission), showcasing the morphological transformation of mitochondria from tubular to spherical shapes over time (min:sec). Mitochondria were stained using MitoPB Yellow, enabling visualization of the IMM (Wang et al., 2019). MitoPB Yellow is shown in a false-color scale (magenta to yellow) representing fluorescence intensity. Scale bars: 2 µm. (B) Graphs depicting the change in [cristae/IMM]% over time (seconds) for mitochondria undergoing the transformation exemplified in A. Each graph represents one individual mitochondrion (shown in the pictures below each graph for initial and final times tracked, arrows indicating the mitochondrion analyzed), with color coding of the graphs indicating the degree of circularity of the mitochondrial shape at each timepoint. MitoPB Yellow is shown in a magenta–yellow scale and grayscale. Scale bars: 1 µm. Images taken from Wang et al., 2019. (republished with permission).
Fig. 5.
Fig. 5.
The CORSET model for shaping mitochondria. The shift of mitochondria from spheres to tubules or vice versa can be divided into two substages. (A) The first step is the change from a sphere to a primary tubule (the classical bean-like shape), which is hypothesized to be driven by cristae formation and changes in area difference (ΔA) between the membranes. (B) The second step is a further extension to a full-length tubule by either growth or fusion of several mitochondria, meaning an external addition of lipids, to create longer narrow tubules.

Similar articles

References

    1. Anand, R., Reichert, A. S. and Kondadi, A. K. (2021). Emerging roles of the MICOS complex in cristae dynamics and biogenesis. Biology 10, 600. 10.3390/biology10070600 - DOI - PMC - PubMed
    1. Barrera, M., Koob, S., Dikov, D., Vogel, F. and Reichert, A. S. (2016). OPA1 functionally interacts with MIC60 but is dispensable for crista junction formation. FEBS Lett. 590, 3309-3322. 10.1002/1873-3468.12384 - DOI - PubMed
    1. Blum, T. B., Hahn, A., Meier, T., Davies, K. M. and Kühlbrandt, W. (2019). Dimers of mitochondrial ATP synthase induce membrane curvature and self-assemble into rows. Proc. Natl. Acad. Sci. USA 116, 4250-4255. 10.1073/pnas.1816556116 - DOI - PMC - PubMed
    1. Brakke, K. A. (1992). The surface evolver. Exp. Math. 1, 141-165. 10.1080/10586458.1992.10504253 - DOI
    1. Bucevičius, J., Kostiuk, G., Gerasimaitė, R., Gilat, T. and Lukinavičius, G. (2020). Enhancing the biocompatibility of rhodamine fluorescent probes by a neighbouring group effect. Chem. Sci. 11, 7313-7323. 10.1039/d0sc02154g - DOI - PMC - PubMed

MeSH terms

Substances

LinkOut - more resources