. 2025 May 15;135(10):e185128.
doi: 10.1172/JCI185128.

Asparagine endopeptidase cleaves apolipoprotein A1 and accelerates pathogenesis of atherosclerosis

Affiliations

Asparagine endopeptidase cleaves apolipoprotein A1 and accelerates pathogenesis of atherosclerosis

Mengmeng Wang et al. J Clin Invest. .

Abstract

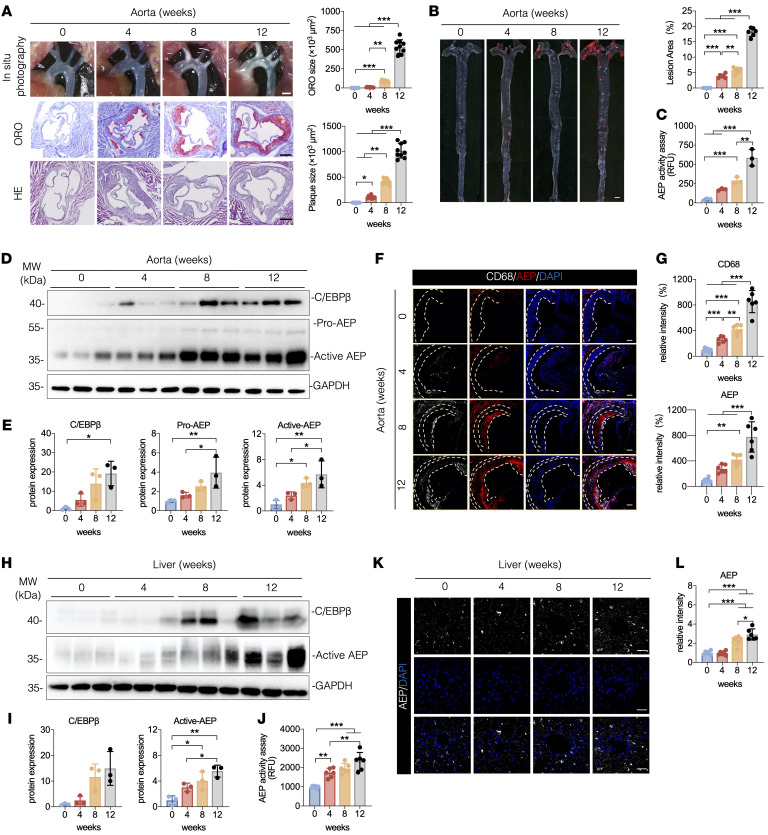
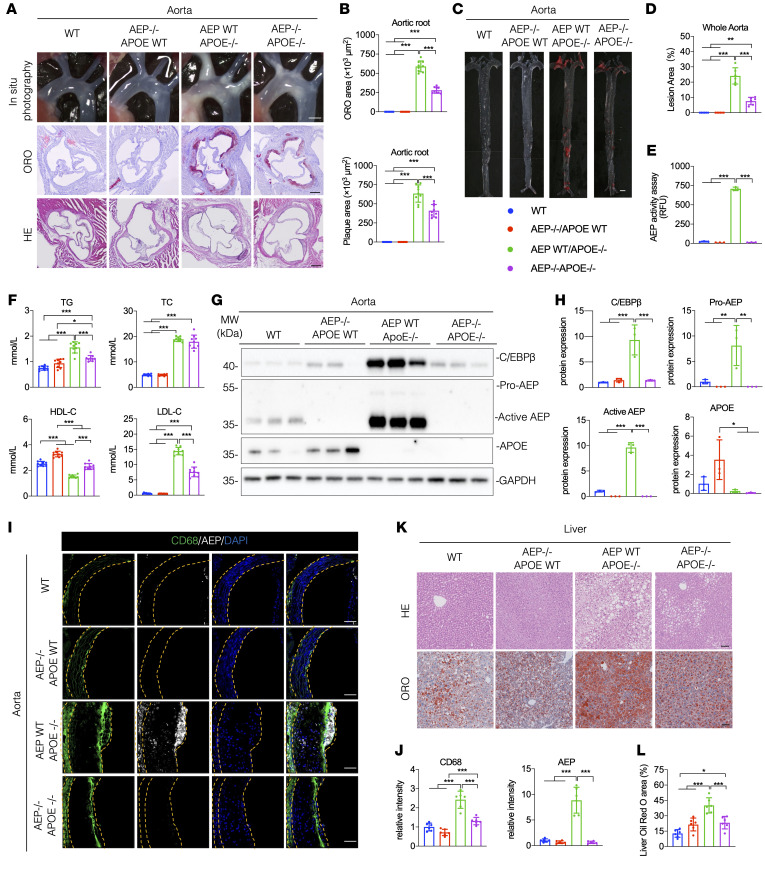
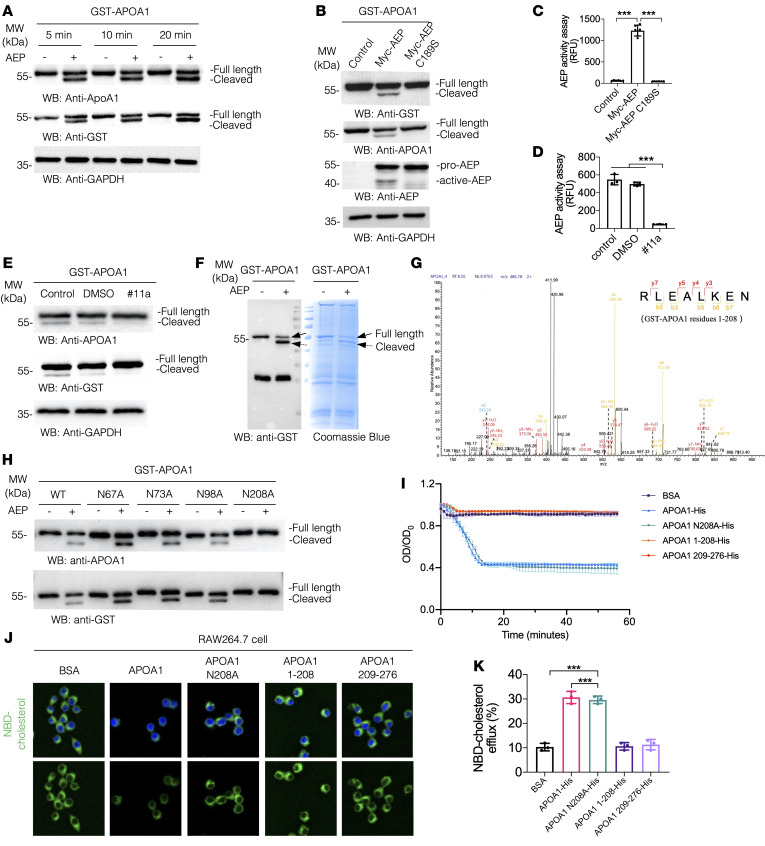
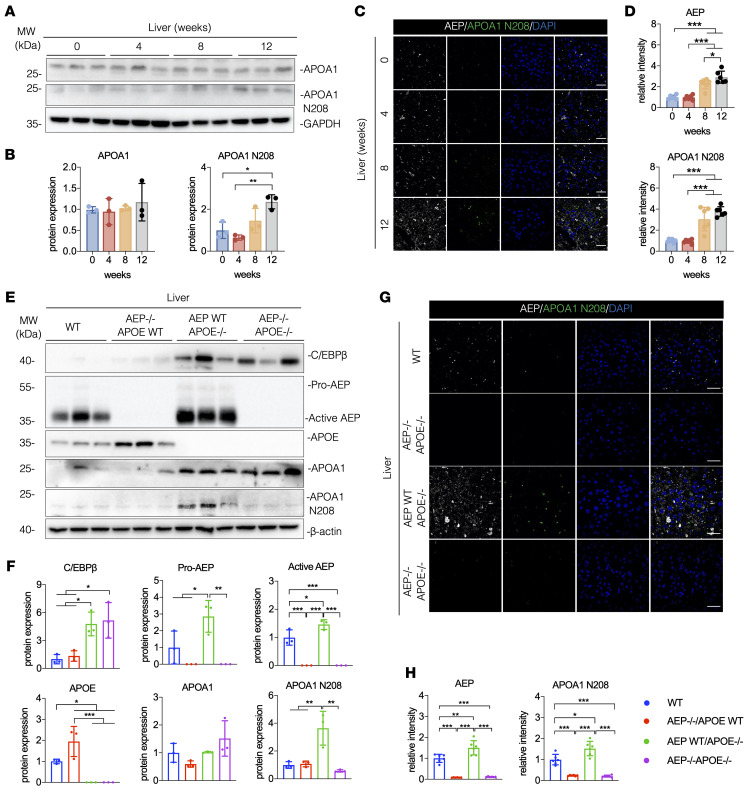
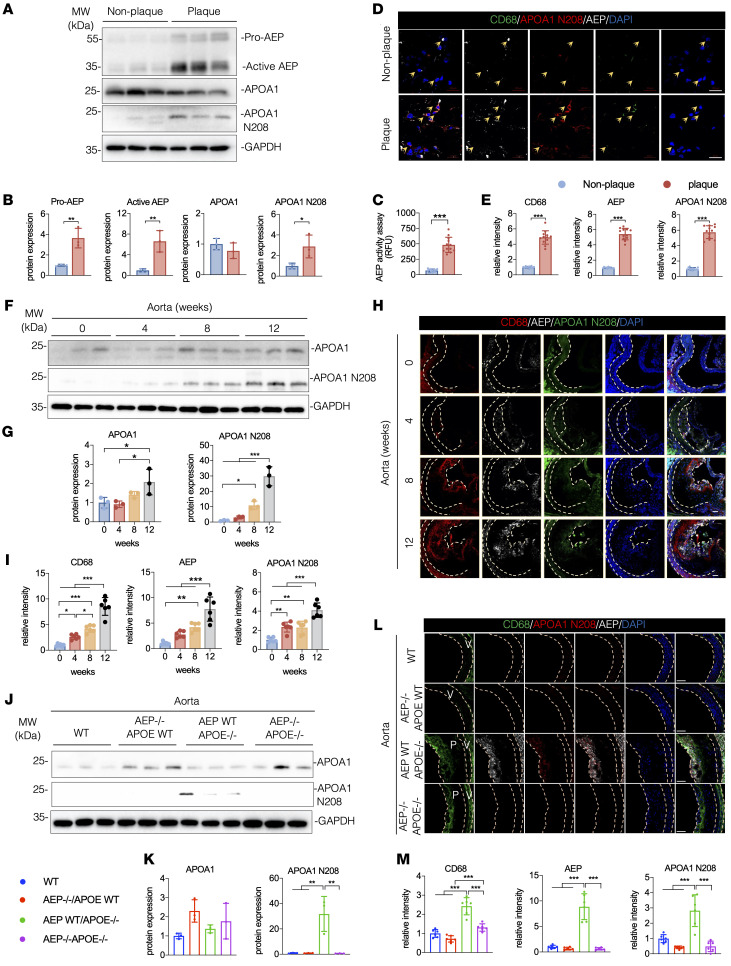
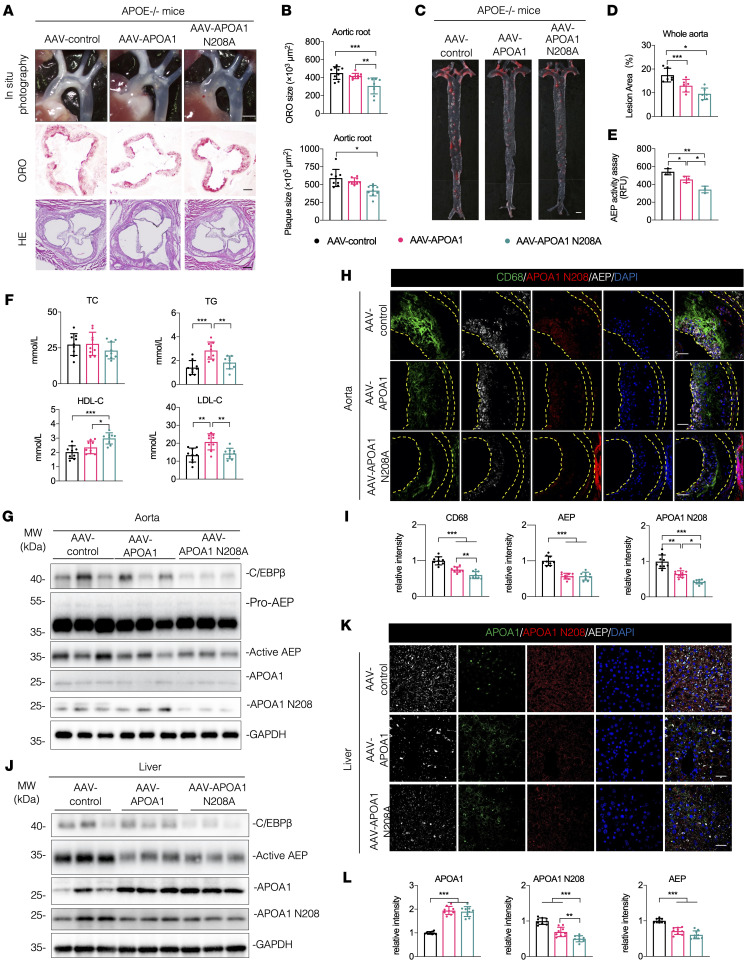
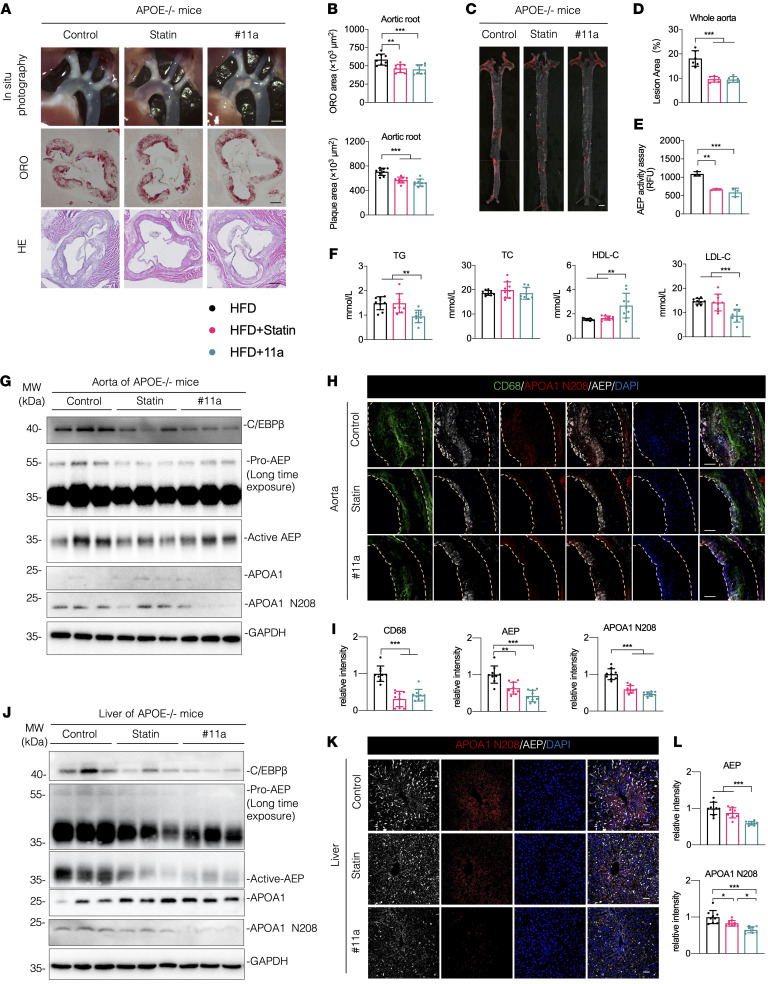
Atherosclerosis is a slowly progressing inflammatory disease characterized with cholesterol disorder and intimal plaques. Asparagine endopeptidase (AEP) is an endolysosomal protease that is activated under acidic conditions and is elevated substantially in both plasma and plaques of patients with atherosclerosis. However, how AEP accelerates atherosclerosis development remains incompletely understood, especially from the view of cholesterol metabolism. This project aims to reveal the crucial substrate of AEP during atherosclerosis plaque formation and to lay the foundation for developing novel therapeutic agents for Atherosclerosis. Here, we show that AEP is augmented in the atherosclerosis plaques obtained from patients and proteolytically cuts apolipoprotein A1 (APOA1) and impairs cholesterol efflux and high-density lipoprotein (HDL) formation, facilitating atherosclerosis pathologies. AEP is activated in the liver and aorta of apolipoprotein E-null (APOE-null) mice, and deletion of AEP from APOE-/- mice attenuates atherosclerosis. APOA1, an essential lipoprotein in HDL for cholesterol efflux, is cleaved by AEP at N208 residue in the liver and atherosclerotic macrophages of APOE-/- mice. Blockade of APOA1 cleavage by AEP via N208A mutation or its specific inhibitor, #11a, substantially diminishes atherosclerosis in both APOE-/- and LDLR-/- mice. Hence, our findings support that AEP disrupts cholesterol metabolism and accelerates the development of atherosclerosis.

Keywords: Atherosclerosis; Cardiology; Cholesterol; Macrophages; Vascular biology.


Conflict of interest statement

Conflict of interest: The authors have declared that no conflict of interest exists.

Figures

Figure 1
Figure 1. Increased AEP activation in the liver and aorta of APOE–/– mice.
(AL) APOE–/– mice were fed with a HFD for 0–12 weeks. (A) Representative macroscopic images and quantification of aortic arch and aortic root stained with H&E and ORO (n = 9 per group). Scale bars: 1 mm (top); 25 μm (bottom 2 rows). (B) Representative macrographs and quantification of aorta stained with ORO (n = 6 per group). Scale bar: 1 mm. (C) AEP enzymatic activities of aorta (n = 3 per group). (D and E) Western blot images and quantification of C/EBP-β and AEP levels in aorta (n = 3 per group). (F and G) IF staining and quantification of CD68 (green) and AEP (red) in aorta. Nuclei were counter-stained with DAPI (blue). Scale bar: 20 μm. (H and I) Western blot images and quantification of C/EBP-β and AEP levels in liver (n = 3 per group). (J) AEP enzymatic activities of liver (n = 6 per group). (K and L) IF staining and quantification of AEP (white) in liver. Nuclei were counter stained with DAPI (blue). Scale bar: 20 μm. All data are presented as the mean ± SEM from 3 to 6 independent experiments. 1-way ANOVA with Tukey’s post hoc test (AC, E, G, I, K, and L); 1-way ANOVA with Kruskal–Wallis test (C/EBP-β in I and L). *P < 0.05; **P < 0.01; ***P < 0.001.
Figure 2
Figure 2. Depletion of AEP from APOE–/– mice attenuates atherosclerosis.
(AL) WT, AEP–/–, APOE–/–, and AEP–/–APOE–/– mice were fed with a HFD for 12 weeks. (A) Representative macroscopic images of aortic arch and aortic root stained with H&E and ORO. Scale bars: 1 mm (top); 25 μm (bottom 2 rows). (B) Quantification of aortic plaque and ORO area in aortic root (n = 9 per group). (C) Representative macrographs of aorta stained with ORO. Scale bar: 1 mm. (D) Quantification of aortic plaque area of whole aorta (n = 6 per group). (E) AEP enzymatic activities of aorta (n = 3 per group). (F) Serum levels of total cholesterol (TC), triglyceride (TG), LDL-cholesterol (LDL-C) and HDL-C (n = 9 per group). (G and H) Western blot images and quantification of C/EBP-β, AEP and APOE levels in aorta (n = 3 per group). (I and J) Immunofluorescence staining and quantification of CD68 (green) and AEP (red) in aorta. Nuclei were counterstained with DAPI (blue) (n = 6 per group). Scale bars: 20 μm. (K and L) H&E and ORO staining of liver and quantification (n = 6 per group). Scale bars: 100 μm. All data are presented as the mean ± SEM. 1-way ANOVA with Tukey’s post hoc test (B, DF, H, J, and K). *P < 0.05; **P < 0.01; ***P < 0.001.
Figure 3
Figure 3. AEP cleaves APOA1 at N208 and severely impairs cholesterol efflux and HDL formation.
(A) HEK293 cells lysates overexpressing GST-APOA1 were incubated with AEP for 5 minutes, 10 minutes, and 20 minutes. Western blot showing the cleavage of APOA1 by recombinant AEP in a time-dependent manner. (B) Cells cotransfected with GST-APOA1 and myc-AEP WT or myc-AEP C189S. Western blot showing that WT AEP but not C189S mutant AEP cleaved GST-APOA1. (C) AEP activity was diminished by the C189S mutant of AEP. (D) Cleavage of APOA1 was blocked by AEP inhibitor #11a. (E) AEP activity was inhibited by #11a. (F) Cleavage of purified GST-APOA1 analyzed by immunoblotting (left panel) or Coomassie blue staining (right panel). (G) Proteomic analysis of APOA1 recombinant proteins processed by AEP. The detected peptide sequences indicate that N208 is the main cleavage site with the shed bands of molecular weight (MW) 50 kDa. (H) Cell lysates overexpressing GST-APOA1 WT, APOA1 mutant (N67A, N73A, N98A, N208A) were incubated with AEP. Western blot showing that the N208A mutant blocked the cleavage. (I) DMPC multilamellar vesicles were incubated with BSA alone (control, purple), APOA1 (blue), APOA1 N208Al (green), APOA1 1-208 (orange)or APOA1 209-276 (red). Ability to solubilize DMPC was determined. (J) Representative fluorescent images of the NBD-cholesterol burden in RAW264.7 obtained in the indicated group after incubation with APOA1, APOA1 N208A, APOA1 1–208, or APOA1 209–276 for 4 hours. Original maginification, ×20. (K) Quantification of NBD-cholesterol efflux. All data are presented as the mean ± SEM from 3 independent experiments. 1-way ANOVA with Tukey’s post hoc test (C, D, and K).*P < 0.05; **P < 0.01; ***P < 0.001.
Figure 4
Figure 4. Increased APOA1 cleavage in the liver of APOE–/– mice.
(AD) APOE–/– mice were fed with a HFD for 0–12 weeks. (A and B) Western blot images and quantification of APOA1 and APOA1 N208 levels in liver (n = 3 per group). (C and D) Immunofluorescence staining and quantification of AEP (white) and APOA1 N208 (red) in aorta. Nuclei were counterstained with DAPI (blue) (n = 6 per group). Scale bars: 20 μm. (EH) WT, AEP–/–, APOE–/–, and AEP–/–APOE–/– mice were fed with HFD for 12 weeks. (E and F) Western blot images and quantification of C/EBP-β, AEP, APOA1 and APOA1 N208 levels in liver (n = 3 per group). (G and H) IF staining and quantification of AEP (white) and APOA1 N208 (red) in liver. Nuclei were counterstained with DAPI (blue) (n = 6 per group). Scale bars: 20 μm. All data are presented as the mean ± SEM. 1-way ANOVA with Tukey’s post hoc test (B, D, F, and H). *P < 0.05; **P < 0.01; ***P < 0.001.
Figure 5
Figure 5. Elevated APOA1 cleavage in the plaques from patients and mice with atherosclerosis.
(AE) Aortic tissue was taken from patients with atherosclerosis and analyzed. (A and B) Western blot images and quantification of AEP, APOA1, and APOA1 N208 levels in patients (n = 3 per group). (E) AEP enzymatic activities of aorta (n = 12 per group). (D and E) IF staining and quantification of CD68 (green), AEP (white), and APOA1 N208 (red) in aorta. The nuclei were counterstained with DAPI (blue) (n = 12 per group). Scale bars: 20 μm. (FI) APOE–/– mice were fed with a HFD for 0–12 weeks. (F and G) Western blot images and quantification of APOA1 and APOA1 N208 levels in aorta (n = 3 per group). (H and I) Immunofluorescence staining and quantification of CD68 (green), AEP (white), and APOA1 N208 (red) in aorta. The nuclei were counterstained with DAPI (blue) (n = 6 per group). Scale bars: 20 μm. (JM) WT, AEP–/–, APOE–/–, and AEP–/–APOE–/– mice were fed with a HFD for 12 weeks. (J and K) Western blot images and quantification of C/EBP-β, AEP, APOA1, and APOA1 N208 levels in aorta (n = 3 per group). (L and M) Immunofluorescence staining and quantification of CD68 (green), AEP (white), and APOA1 N208 (red) in aorta. Nuclei were counterstained with DAPI (blue) (n = 6 per group). Scale bars: 20 μm. All data are presented as the mean ± SEM. 2-tailed, unpaired t test (B, C, and E); 1-way ANOVA with Tukey’s post hoc test (G, I, K, and M). *P < 0.05; **P < 0.01; ***P < 0.001.
Figure 6
Figure 6. Blockade of APOA1 cleavage by AEP attenuates atherosclerosis in APOE–/– mice.
(AL) APOE–/– mice were injected with AAV-control, AAV-APOA1, or AAV-ApoA 1 N208A virus at 6-week-old and fed with HFD for 12 weeks beginning at 8-weeks old. (A) Representative macroscopic images of aortic arch and aortic root stained with H&E and ORO. Scale bars: 1 mm (top); 25 μm (bottom 2 rows). (B) Quantification of aortic plaque and ORO area in aortic root (n = 9 per group). (C) Representative macrographs of aorta stained with ORO. Scale bar: 1 mm. (D) Quantification of aortic plaque area of whole aorta (n = 6 per group). (E) AEP enzymatic activities of aorta (n = 3 per group). (F) Serum levels of total cholesterol (TC), triglyceride (TG), LDL-cholesterol (LDL-C) and HDL-C (n = 9 per group). (G) Western blot analysis of C/EBP-β, AEP, APOA1, and APOA1 N208 levels in aorta (n = 3 per group). (H and I) IF staining and quantification of CD68 (green), AEP (white), and APOA1 N208 (red) in aorta. The nuclei were counterstained with DAPI (blue) (n = 9 per group). Scale bars, 20 μm. (J) Western blot analysis of C/EBP-β, AEP, APOA1, and APOA1 N208 levels in liver (n = 3 per group). (K and L) IF staining and quantification of AEP (white) and APOA1 N208 (red) in liver. Nuclei were counterstained with DAPI (blue) (n = 9 per group). Scale bars, 20 μm. All data are presented as the mean ± SEM. 1-way ANOVA with Tukey’s post hoc test (B, DF, I, and L). *P < 0.05; **P < 0.01; ***P < 0.001.
Figure 7
Figure 7. Inhibition of AEP with specific inhibitor #11a attenuates atherosclerosis in APOE–/– mouse model.
(AL) APOE–/– mice were fed with a HFD (control), HFD + statin (Statin, 10.0 mg/kg) or HFD + #11a (#11a, 7.5 mg/kg) for 12 weeks beginning at 8-weeks old. (A) Representative macroscopic images and quantification of aortic arch and aortic root stained with H&E and ORO. scale bars: 1 mm(top;) 25 μm(bottom 2 rows). (B) Quantification of aortic plaque and ORO area in aortic root (n = 9 per group). (C and D) Representative macrographs and quantification of aorta stained with ORO (n = 6 per group). Scale bar: 1 mm. (E) AEP enzymatic activities of aorta (n = 3 per group). (F) Serum levels of total cholesterol (TC), triglyceride (TG), LDL-cholesterol (LDL-C) and HDL-C (n = 9 per group). (G) Western blot analysis of C/EBP-β, AEP, APOA1, and APOA1 N208 levels in aorta (n = 3 per group). (H and I) IF staining and quantification of CD68 (green), AEP (white), and APOA1 N208 (red) in aorta. Nuclei were counterstained with DAPI (blue) (n = 9 per group). Scale bars: 20 μm. (J) Western blot analysis of C/EBP-β, AEP, APOA1, and APOA1 N208 levels in liver (n = 3 per group). (K and L) IF staining and quantification of AEP (white) and APOA1 N208 (red) in liver. Nuclei were counterstained with (blue) (n = 9 per group). Scale bars: 20 μm. All data are presented as the mean ± SEM. 1-way ANOVA with Tukey’s post hoc test (B, DF, I, and L). *P < 0.05; **P < 0.01; ***P < 0.001.

Similar articles

References

    1. Bjorkegren JLM, Lusis AJ. Atherosclerosis: recent developments. Cell. 2022;185(10):1630–1645. doi: 10.1016/j.cell.2022.04.004. - DOI - PMC - PubMed
    1. Papaspyridonos M, et al. Novel candidate genes in unstable areas of human atherosclerotic plaques. Arterioscler Thromb Vasc Biol. 2006;26(8):1837–1844. doi: 10.1161/01.ATV.0000229695.68416.76. - DOI - PubMed
    1. Haugen MH, et al. Nuclear legumain activity in colorectal cancer. PLoS One. 2013;8(1):e52980. doi: 10.1371/journal.pone.0052980. - DOI - PMC - PubMed
    1. Gawenda J, et al. Legumain expression as a prognostic factor in breast cancer patients. Breast Cancer Res Treat. 2007;102(1):1–6. doi: 10.1007/s10549-006-9311-z. - DOI - PubMed
    1. Clerin V, et al. Expression of the cysteine protease legumain in vascular lesions and functional implications in atherogenesis. Atherosclerosis. 2008;201(1):53–66. doi: 10.1016/j.atherosclerosis.2008.01.016. - DOI - PubMed

MeSH terms