. 2025 May 15;135(10):e185783.
doi: 10.1172/JCI185783.

TMEM219 signaling promotes intestinal stem cell death and exacerbates colitis

Affiliations

TMEM219 signaling promotes intestinal stem cell death and exacerbates colitis

Francesca D'Addio et al. J Clin Invest. .

Abstract

Mechanisms by which mucosal regeneration is abrogated in inflammatory bowel disease (IBD) are still under investigation, and a role for an intestinal stem cell (ISC) defect is now emerging. Herein, we report an abnormal ISC death that occurs in Crohn's disease, which exacerbates colitis, limits ISC-dependent mucosal repair, and is controlled through the death factor Transmembrane protein 219 (TMEM219). Large alterations in TMEM219 expression were observed in patients with Crohn's disease, particularly in those with active disease and/or those who were nonresponders to conventional therapy, confirming that TMEM219 signaling is abnormally activated and leads to failure of the mucosal regenerative response. Mechanistic studies revealed a proapoptotic TMEM219-mediated molecular signature in Crohn's disease, which associates with Caspase-8 activation and ISC death. Pharmacological blockade of the IGFBP3/TMEM219 binding/signal with the recombinant protein ecto-TMEM219 restored the self-renewal abilities of miniguts generated from patients with Crohn's disease in vitro and ameliorated DSS-induced and T cell-mediated colitis in vivo, ultimately leading to mucosal healing. Genetic tissue-specific deletion of TMEM219 in ISCs in newly generated TMEM219fl/flLGR5cre mice revived their mucosal regenerative abilities both in vitro and in vivo. Our findings demonstrate that a TMEM219-dependent ISC death exacerbates colitis and that TMEM219 blockade reestablishes intestinal self-renewal properties in IBD.

Keywords: Apoptosis; Gastroenterology; Inflammatory bowel disease; Mouse models; Stem cells.


Figures
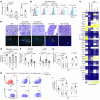
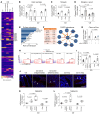
Figure 1
Figure 1. Intestinal stem cell defects exist in active Crohn’s disease.
(A and B). Flow cytometric analysis of CD45EPHB2+ ISCs of patients with active Crohn’s disease (CD, marginal and inflamed areas), responders in remission phase, nonresponders, or controls (n = 6–10/group). (C). Transcriptome profile delineating the stem cell–related signature in intestinal samples of controls and of patients with CD from all patient cohorts. (D). Representative pictures of H&E (upper panels) and confocal analysis (lower panels) of the ISC marker EPHB2 (red) and of the epithelial marker Cytokeratin 20 (CKT20, green) in intestinal samples of controls and of patients with Crohn’s disease from all patient cohorts. Nuclei stained by DAPI. Original magnification ×20; scale bar: 100 μm. (E). Development of miniguts from crypts isolated from controls and grown in pooled serum of people who were controls or patients (n = 5) with Crohn’s disease from all patient cohorts, in place of 10% FBS (n = 10/group). (F). Normalized mRNA expression of the ISC markers EPHB2 and LGR5 quantified in miniguts, as described in E (n = 10/group). (G and H). Flow cytometric analysis (fold increase) and flow plots of Annexin-V+ ISCs of patients with Crohn’s disease from all patient cohorts compared with people who were controls (n = 7–9/group). (I). Cell death analysis in intestinal samples of people who were controls and of patients with Crohn’s disease from all patient cohorts (n = 5–8/group). Mean ± SEM. At least 3 independent experiments performed in duplicate. 1-way ANOVA followed by Šidák’s post hoc analysis.
Figure 2
Figure 2. Dysfunctional Caspase-8–mediated TMEM219 signaling in Crohn’s disease.
(A). Apoptotic gene signature analyzed in intestinal samples of patients with active Crohn’s disease (CD, marginal and inflamed areas), of patients who were responders in remission phase and nonresponders compared with controls (Ctrl). (B). Cleaved Caspase-8 measured in intestinal samples of people who were controls and of patients with Crohn’s disease from all patient cohorts (n = 5–8/group). (C and D). Cleaved Caspase-8 quantified in miniguts developed from individuals who were controls and from patients with Crohn’s disease of all patient cohorts (n = 6/group) or measured in miniguts of control samples cultured with pooled serum of people who were controls or patients with Crohn’s disease (n = 5) from all patient cohorts in place of 10% FBS (n = 6/group). (E). Cell membrane receptors identified in the Caspase-8 interactome and depicted based on their ranking of interactions using Genemania analysis. (F). Network of Caspase-8 gene-gene interactions generated by the IntAct software, based on molecular interaction, type, and method of detection. Top 8 genes and MIscore for interaction with Caspase-8 are shown. (G). Cleaved Caspase-8 measured in Caco2 cells transfected with siRNA TMEM219 and cultured with the TMEM219 ligand IGFBP3 (50 ng/mL), (n = 3). (H and I). Flow cytometric expression of TMEM219 in intestinal cells of people who were controls (n = 13) and patients with Crohn’s disease from all patient cohorts (n = 7/group). (J). Representative pictures of TMEM219 immunofluorescence expression in intestinal samples of people who were controls and of patients with Crohn’s disease from all patient cohorts. The crypt base location of positive cells is highlighted. Original magnification ×20; scale bar: 100 μm. (K and L). TMEM219 protein and mRNA expression quantified in intestinal samples of patients with Crohn’s disease from all patient cohorts compared with controls (n = 5–8). Mean ± SEM. Box plots include the median line, the minimum and maximum value, and the upper and lower quartile. At least 3 independent experiments performed in duplicates. 1-way ANOVA followed by Šidák’s post hoc test and 2-sided t test.
Figure 3
Figure 3. Mechanistic studies delineate a TMEM219-related proapoptotic downstream signaling.
(A and B). Confocal microscopy analysis (Scale bar: 10 μm; original magnification ×63) depicting colocalization and binding of TMEM219 (green) and IGFBP3 (red) in intestinal cells dissociated from a control sample and incubated with recombinant IGFBP3 overnight and in CaCo2 cells. Cells were stained with DAPI for nuclei (blue) and immunolabeled with anti-TMEM219 (green) and anti-IGFP3 Abs (red). (C). Cleaved/activated Caspases 1, 2, 3, 7, 8, and 9 were quantified in CaCo2 cells cultured with/without IGFBP3 (50 ng/mL) and with/without the TMEM219 inhibitor ecto-TMEM219 (newly generated recombinant protein based on the TMEM219 extracellular portion). (D). Cell death quantified in CaCo2 cells cultured with/without IGFBP3 with ecto-TMEM219, Pan-caspase inhibitor, and selective inhibitors for Caspases 1, 3, 7, 8, and 9. (E and F). Phosphoproteomic profile identified in CaCo2 cells cultured with/without IGFBP3 (50 ng/mL) and with/without ecto-TMEM219 (130 ng/mL). Differentially expressed phosphorylated proteins (normalized to control) are presented in the heatmap as a ratio between nonphosphorylated and phosphorylated protein (mean value). In F, up/downregulated phosphorylated proteins with IGFBP3 and with Ecto-TMEM219 are reported. (G and H). Development of miniguts obtained from crypts of patients with active Crohn’s disase (CD) and cultured with/without IGFBP3 and ecto-TMEM219 (n = 7). Original magnification ×20; scale bar: 100 μm. (I and J). Normalized mRNA expression of EPHB2 (I) and LGR5 (J) in miniguts as described in G (n = 6). (K and L). Development of miniguts obtained from crypts of controls (Ctrl) and cultured in the presence of pooled sera of patients with active CD in place of 10% FBS and with/without ecto-TMEM219 (n = 7). Original magnification ×20; scale bar: 100 μm. (M and N). Normalized mRNA expression of EPHB2 (M) and LGR5 (N) in miniguts obtained as reported in K (n = 5). Mean ± SEM. At least 3 independent experiments run in duplicate. 1-way ANOVA followed by Šidák’s post hoc test and 2-sided t test.
Figure 4
Figure 4. Pharmacological blockade of IGFBP3/TMEM219 signal ameliorates DSS-mediated acute and chronic colitis in vivo.
(A). Experimental design of the DSS acute prevention model. (BD). Disease activity index (DAI), histological score, and colon length measured at day +12 in control (n = 5), DSS+PBS and DSS+ecto-TMEM219–treated mice (n = 7–10). (E). Representative pictures of H&E staining, crypt proliferation (MKI67), and ALDH immunostaining in colons of controls, DSS+PBS, and DSS+ecto-TMEM219–treated mice. Original magnification ×20 (upper and middle panels), ×40 (lower panels); scale bars: 100 μm. Arrows indicate ALDH+ cells (lower panels). (F and G). Development of 8-day miniguts obtained from colons of controls, DSS+PBS, and DSS+ecto-TMEM219–treated mice (n = 5/group). Original magnification ×20; scale bar: 100 μm. (H). Experimental design of the DSS chronic treatment model. (IK). DAI (n = 10), histological score (n = 5), and colon length (n = 10) measured at day 42 in controls, DSS+PBS, and DSS+ecto-TMEM219–treated mice. (L). Representative pictures of H&E staining, crypt proliferation (MKI67), and ALDH immunostaining in colons of controls, DSS+PBS, and DSS+ecto-TMEM219–treated mice. Original magnification ×20 (upper and middle panels) and ×40 (lower panels); scale bar: 100 μm. Arrows indicate MKI67+ cells (middle panel) and ALDH+ cells (lower panels). (M and N). Colon endoscopic analysis in controls, in mice receiving DSS+PBS (n = 9),or DSS+ecto-TMEM219 (n = 6), (Day 42). Mean ± SEM. 1-way ANOVA followed by Šidák’s post hoc test and 2-sided t test.
Figure 5
Figure 5. Pharmacological blockade of the IGFBP3/TMEM219 signaling improves colitis in vivo in the T cell transfer model.
(A). Experimental design of the T cell–mediated acute colitis prevention model, in which mice received T cells at day 0 and developed colitis between days 21 and 35 and were administered treatment with ecto-TMEM219 or with the positive control anti-p40 compound, from day 14 to day 42. (B). Percentage weight change in mice subjected to T cell–induced colitis and treated with ecto-TMEM219, anti-p40, or PBS (n = 8). (C and D). Colitis score and representative endoscopic pictures obtained at day 42 in naive mice (RAG–/–), in RAG–/– mice receiving T cells plus PBS, T cells plus anti-p40, or ecto-TMEM219 in the T cell transfer model (n = 6–10). (E). Representative pictures of histological analysis in colon samples of naive mice, mice receiving T cells plus PBS, T cells plus anti-p40, or ecto-TMEM219. Original magnification ×20; scale bar: 100 μm. (F and G). Histological score and colon length measured at day 42 in naive mice (n = 5) and in mice receiving T cells + PBS or T cells + anti-p40 or ecto-TMEM219 in the T cell transfer model (n = 8–12). Mean ± SEM. 2-way or 1-way ANOVA followed by Šidák’s post hoc test and 2-sided t test, Mann-Whitney t test.
Figure 6
Figure 6. TMEM219 genetic deletion in ISCs ameliorates acute colitis in vivo.
(A). Genetic approach used to generate the Tmem219fl/fl EGFP-Lgr5cre mouse, namely the ISC-Tmem219–/– mouse. (BD). Flow plot and bar graph quantifying TMEM219 protein (B and C) and mRNA (D) expression in EpCam+EGFP-LGR5+ intestinal cells isolated from the Tmem219fl/fl EGFP-Lgr5cre mouse, in which Tmem219 was deleted through tamoxifen injection (ISC-Tmem219–/–, n = 3), compared with the ISC-B6 mice, in which Cre was not activated by tamoxifen injection (n = 3). (E and F). Normalized mRNA expression of Lgr5 and Casp8 in colons of ISC-Tmem219–/– (n = 4) compared with ISC-B6 mice (n = 3). (G). Bar graphs showing ex vivo–generated 8-day miniguts from crypts of ISC-Tmem219–/– (n = 4) and of ISC-B6 controls (n = 5) cultured with/without IGFBP3 (50 ng/mL). (H). Experimental design of the DSS acute prevention model conducted in ISC-Tmem219–/– mice. (IK). DAI score, colon length, and histological score quantified in ISC-Tmem219–/– mice and in the ISC-B6 control (n = 8–10) with or without treatment with oral DSS (2.5%) in the prevention acute study model described in H. (L). H&E staining of colons obtained from mice as described in I. Arrows highlight inflammation, infiltrating leukocytes. Original magnification ×10; scale bar: 200 μm. (M and N). Flow cytometric analysis of infiltrating CD45+ cells performed in colon samples of ISC-Tmem219–/– mice and of ISC-B6 control mice with or without treatment with oral DSS, (n = 5). (O and P). Ex vivo–generated 8-day miniguts from crypts of ISC-Tmem219–/– mice and of ISC-B6 control control mice with or without treatment with DSS, (n = 6–7). Original magnification ×10; scale bar: 200 μm. Mean ± SEM. 1-way ANOVA followed by Šidák’s post hoc test, 2-sided t test.

Comment in

  • Promoting mucosal healing by targeting TMEM219-dependent intestinal epithelial stem cell defects in inflammatory bowel disease doi: 10.1172/JCI192640

References

    1. Le Berre C, et al. Ulcerative colitis and crohn’s disease have similar burden and goals for treatment. Clin Gastroenterol Hepatol. 2020;18(1):14–23. doi: 10.1016/j.cgh.2019.07.005. - DOI - PubMed
    1. de Souza HSP, et al. The IBD interactome: an integrated view of aetiology, pathogenesis and therapy. Nat Rev Gastroenterol Hepatol. 2017;14(12):739–749. doi: 10.1038/nrgastro.2017.110. - DOI - PubMed
    1. Villablanca EJ, et al. Mechanisms of mucosal healing: treating inflammatory bowel disease without immunosuppression? Nat Rev Gastroenterol Hepatol. 2022;19(8):493–507. doi: 10.1038/s41575-022-00604-y. - DOI - PubMed
    1. Monteleone G, et al. Mongersen, an oral SMAD7 antisense oligonucleotide, and Crohn’s disease. N Engl J Med. 2015;372(12):1104–1113. doi: 10.1056/NEJMoa1407250. - DOI - PubMed
    1. de Souza HS, Fiocchi C. Immunopathogenesis of IBD: current state of the art. Nat Rev Gastroenterol Hepatol. 2016;13(1):13–27. doi: 10.1038/nrgastro.2015.186. - DOI - PubMed

MeSH terms

Substances