. 2025 May 15;135(10):e182040.
doi: 10.1172/JCI182040.

IL-32-producing CD8+ memory T cells define immunoregulatory niches in human cutaneous leishmaniasis

Affiliations

IL-32-producing CD8+ memory T cells define immunoregulatory niches in human cutaneous leishmaniasis

Nidhi S Dey et al. J Clin Invest. .

Abstract

Human cutaneous leishmaniasis (CL) is characterized by chronic skin pathology. Experimental and clinical data suggest that immune checkpoints (ICs) play a crucial role in disease outcome, but the cellular and molecular niches that facilitate IC molecule expression during leishmaniasis are ill defined. In Sri Lankan patients with CL, indoleamine 2,3-dioxygenase 1 (IDO1) and programmed death-ligand 1 (PD-L1) were enriched in skin lesions, and reduced PD-L1 expression early after treatment initiation was predictive of a cure rate following antimonial therapy. Here, we used spatial cell interaction mapping to identify IL-32-expressing CD8+ memory T cells and Tregs as key components of the IDO1/PD-L1 niche in Sri Lankan patients with CL and in patients with distinct forms of dermal leishmaniasis in Brazil and India. Furthermore, the abundance of IL-32+ cells and IL-32+CD8+ T cells at treatment initiation was negatively correlated with the rate of cure in Sri Lankan patients. This study provides insights into the spatial mechanisms underpinning IC expression during CL and offers a strategy for identifying additional biomarkers of treatment response.

Keywords: Cellular immune response; Dermatology; Immunology; Infectious disease; Molecular pathology; Parasitology.


Conflict of interest statement

Conflict of interest: The authors have declared that no conflict of interest exists.

Figures

Figure 1
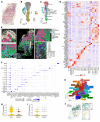
Figure 1. Visium analysis of spatial niches in L. donovani CL lesions.
(A and B) P3 lesion. (A) Macroscopic lesion features. (B) Lesion histology. H&E insets on right show parasitism site (top, yellow arrows indicate parasites) and anti–1 OpB staining (bottom). Scale bars: 500 μm and 10 μm (insets). (C and D) UMAPs of Visium spots from SL CL P1–P6 colored by patient ID (C) and by gene expression (D). (E) Top 10 genes per cluster heatmap. (F) Spatial map for P3 showing clusters from D. (G) P3 spatial plots of normalized CD274 (PD-L1) and IDO1 gene expression. (H) IDO1 and CD274 violin plots for My1–3 clusters (red dotted lines indicate the mean; black dotted lines indicate the IC range; Kruskal-Wallis 1-way test). (I) Predicted average abundance for the 10 most abundant cell types in My1–3 spots with the average number of cells predicted as the total inside. Panels CE, H, and I show data from 6 SL CL patients (P1–P6; Supplemental Table 1); data in other panels represent a single patient.
Figure 2
Figure 2. CosMx single-cell transcriptomics imaging of cutaneous lesions from Sri Lankan patients.
(AD) Single-cell spatial mapping of CL lesions. (A) H&E-stained image of a lesion from patient P3 showing FOVs analyzed using NanoString CosMx. Scale bar: 500 μm. (BD) UMAP by patient number (B) and cell type (C), and cell-type–specific top genes heatmap (D). (E) Single-cell map of stitched FOVs of P3 biopsy with magnified regions (boxes a–d). mDC, myeloid DC; pDC, plasmacytoid DC; mem, memory. (F) Gene expression dot plot across myeloid subtypes. (G) UMAP of subclustered myeloid cells. res, resident; infl, inflammatory; cDC2, type 2 conventional DCs. (H and I) Violin plots showing IDO1 (H) and CD274 (I) expression in the top 2 highest-expressing cells, sorted by average cluster expression level. (J) Spatial localization of DC subset: DC3 and monocyte-derived DC subsets moDC2 and moDC3 in P3 with magnified regions. Panels BD and FI show data from 4 SL CL patients (P3–P6; Supplemental Table 1); other panels represent data from a single patient.
Figure 3
Figure 3. Visium 55 μm neighborhoods of IDO1+ and CD274+ spots.
(A) IDO1 and CD274 normalized gene expression scatter plot for all Visium spots with thresholds (x = 1.1, y = 0.5) defining IDO1, CD274, IDO1/CD274, or other spot classes. (B) P3 spatial plot by spot class in A. Insets identify the lesion core and dermal T cell–rich regions as inferred from Visium and CosMx datasets. (C) Cytokine, chemokine, and receptor abundance by the expression classes described in A. (DK) Spatial feature plots for cytokines, chemokines, and ILs from C in P3’s lesion core and T cell–rich area. (L–N) Additional selected gene spatial features in the same regions. Panels A and C show data from 6 SL CL patients (P1–P6; see also Supplemental Table 1); others represent data from a single patient.
Figure 4
Figure 4. CosMx single-cell analysis of IDO1+ and CD274+ myeloid cell phenotypes and neighboring cells.
(A) Myeloid cell CD274 and IDO1 expression scatter plot from the CosMx dataset (thresholds: x,y = 3). (B) P3 Spatial plot by classes from A. (C) Myeloid subset distribution in IDO1+CD274mye+, IDO1mye+, and CD274mye+ cells. (D and E) Cell distances (IQR + median) (D) and neighbor count (range, 3–22) (E) in the Delaunay network analysis. (F) Cartoon representation of neighborhood analysis (see Methods for details). (GI) Spatial maps (left) and UpsetR plots (right) showing neighbor interactions for IDO1mye+CD274mye+ (G; n = 2,418 pairs), IDO1mye+ (H; n = 5,370), and CD274mye+ (I; n = 4,308) (see also the Supporting Data Values file). UpsetR plots show the top 15 heterotypic interactions; connecting lines indicate combinations, with vertical bars showing combination totals and horizontal bars showing total neighbor counts per cell type. For panels A, CE, and GI, the right panels show data from 4 SL CL patients (P3–P6; Supplemental Table 1); other panels represent data from a single patient.
Figure 5
Figure 5. CosMx and IHC validation of cellular neighborhoods.
(AC) Representative FOVs from the CosMx transcriptomics dataset showing IDO1mye+CD274+mye cells (pink) interacting with CD8+ memory T cells (T CD8 mem; red) (A), Tregs (magenta) (B), and CCL18 macrophages (CCL18_mac; blue) (C). Noninteracting cells are shown with an “oth_” prefix. (D) IHC images showing IDO1, PD-L1, and CD8a protein expression. Scale bars: 20 μm. (E) Proportion of cells coexpressing IDO1 and PD-L1 from D. (F) IHC images showing CD3ɛ, CD8α, and CD8β protein expression. Scale bars: 20 μm. (G) CD3ɛ+CD8α+CD8β+ T cells/mm² as a proportion of total CD8α+ cells (n = 19). (HJ) CD8α proximity to IDO1+PD-L1+ (H, magenta), IDO1+ (I, cyan), and PD-L1+ cells (J, red). Images in HJ show distance masks in shades of gray at 25, 50, and 100 μm diameter. Graphs in HJ show the proportions of CD8+ T cells by distance (Friedman’s test with Dunn’s adjustment, mean ± SD). Scale bars: 20 μm (D and F) and 40 um (HJ). For panels E and HJ, the right panels show data from 23 SL CL patients (see also Supplemental Table 1); other panels represent data from a single patient.
Figure 6
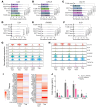
Figure 6. CosMx analysis of cellular sources and targets of cytokines in IDO1+ and CD274+ microenvironments.
(AF) Expression of IL32 (A), CXCL9 (B), CCL18 (C), IL24 (D), IFNGR2 (E) and IL1B (F) in the top 5 neighbors from Figure 4G. Data are presented as follows: mean = +, median = vertical line; Kruskal-Wallis with Dunn’s correction. (G and H) Expression of CCL18, IL24, IL1B, IFNGR2, CXCL9, IL32, TNFSF14, and FASLG in the top 5 neighbors of IDO1mye+ and CD274mye+ cells. (I) Heatmap showing the phenotype of neighboring CD8+ memory T cells and Tregs. Scale shows Gini coefficient z scores. Data shown in AI are from 4 SL CL patients (see also Supplemental Table 1). (J) IL32 isoform (α, β, γ, and δ) fold change versus GAPDH and healthy skin (n = 3) in L. donovani (L. don) CL patients (n = 2) and L. (V.) braziliensis (L. b) CL patients (n = 3). Data indicate the mean ± SD.
Figure 7
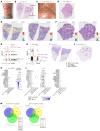
Figure 7. Visium spatial transcriptomics of IDO1 and CD274 niches in different dermal variants of leishmaniasis.
(A) CL lesion caused by L. braziliensis in P1 from Brazil. (B) H&E image from A. (C) Polymorphic PKDL lesion caused by L. donovani in P1 from India. (D) H&E image from C. (E and F) IDO1 and CD274 spatial expression in L. braziliensis CL P1 (E) and L. donovani PKDL P1 (F). (G and H) CD274 and IDO1 expression scatter plots from all spots from L. braziliensis–infected CL skin lesions (n = 4) (see also Supplemental Table 2; thresholds: x = 0.5, y = 0.2) (G) and L. donovani PKDL P1 and P2 (H) (see also Supplemental Table 3; thresholds: x,y = 0.2). (I and J) Spatial plot of IDO1 and PD-L1 expression classes for L. braziliensis CL P1 (I) and L. donovani PKDL P1 (J). (K and L) Differential expression of cytokines, chemokines, ILs, and TNF- and IFN-related and checkpoint markers between IDO1 and CD274 classes in L. braziliensis CL (K) (n = 4) and PKDL (L) (n = 2). (M) Top 50 IDO1- and CD274-correlated genes overlap across SL CL (n = 6), L. braziliensis CL (n = 4), and L. donovani PKDL (n = 2). (See also Supplemental Tables 1–3). Original magnification, ×20 (B, E, and I) and ×21 (D, F, and J).
Figure 8
Figure 8. Protein analysis of IL-32-induced IC expression and prognostic value of lesional IL-32+ T cells for CL cure rate in Sri Lanka.
(A) Histograms of IDO1 and PDL1 median fluorescence intensities in M-CSF–differentiated macrophages after IL-32γ (100 ng/mL) or IL-32β (50 ng/mL) stimulation. (B) Same analysis in GM-CSF–differentiated macrophages. (C) PDL1 and IDO1 expression fold changes in M-CSF and GM-CSF macrophages (n = 4). Symbols represent individual volunteers; colors indicate treatment. Data indicate the mean ± SEM. (D) IL-32 protein expression in SL CL. Scale bar: 100 μm. (E) Patient stratification by dermal IL-32+ cell density (n = 25; low = 11, high = 14). Data indicate the median. (F) Treatment response Kaplan-Meier plot for the IL-32 groups. Shaded areas = 95% CI. P value was determined by log-rank (Mantel-Cox) test. (G) Forest plot of a Cox hazard model (IL-32+ low vs. high), adjusted for age and sex, showing n values, HRs (95% CI), and P values. (HK) Equivalent analyses for IL-32+FOXP3+ cells (n = 22). Scale bar: 100 μm. (LO) Equivalent analyses for IL-32+CD8α+ cells (n = 25). Scale bar: 100 μm. Note: FOXP3+ and CD8α+ cell populations may include minor non-Treg and CD8+ T cell subsets. ****P < 0.0001, by 2-tailed Mann-Whitney U test (E, I, and M).

References

    1. Scott P, Novais FO. Cutaneous leishmaniasis: immune responses in protection and pathogenesis. Nat Rev Immunol. 2016;16(9):581–592. doi: 10.1038/nri.2016.72. - DOI - PubMed
    1. Heyde S, et al. CD11c-expressing Ly6C+CCR2+ monocytes constitute a reservoir for efficient Leishmania proliferation and cell-to-cell transmission. PLoS Pathog. 2018;14(10):e1007374. doi: 10.1371/journal.ppat.1007374. - DOI - PMC - PubMed
    1. Costa-da-Silva AC, et al. Immune responses in leishmaniasis: an overview. Trop Med Infect Dis. 2022;7(4):54. doi: 10.3390/tropicalmed7040054. - DOI - PMC - PubMed
    1. Samant M, et al. Role of cytokines in experimental and human visceral leishmaniasis. Front Cell Infect Microbiol. 2021;11:624009. doi: 10.3389/fcimb.2021.624009. - DOI - PMC - PubMed
    1. Bogdan C. Macrophages as host, effector and immunoregulatory cells in leishmaniasis: Impact of tissue micro-environment and metabolism. Cytokine X. 2020;2(4):100041. doi: 10.1016/j.cytox.2020.100041. - DOI - PMC - PubMed

MeSH terms