

Comparison of Manual Versus QuPath Software-based Immunohistochemical Scoring Using Oral Squamous Cell Carcinoma as a Model
- PMID: 40371713
- PMCID: PMC12081382
- DOI: 10.1369/00221554251335698
Comparison of Manual Versus QuPath Software-based Immunohistochemical Scoring Using Oral Squamous Cell Carcinoma as a Model
Abstract
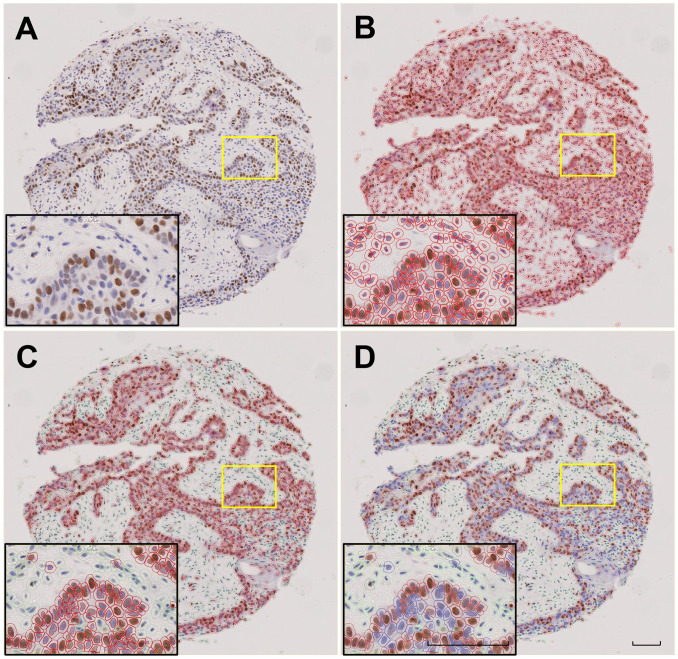
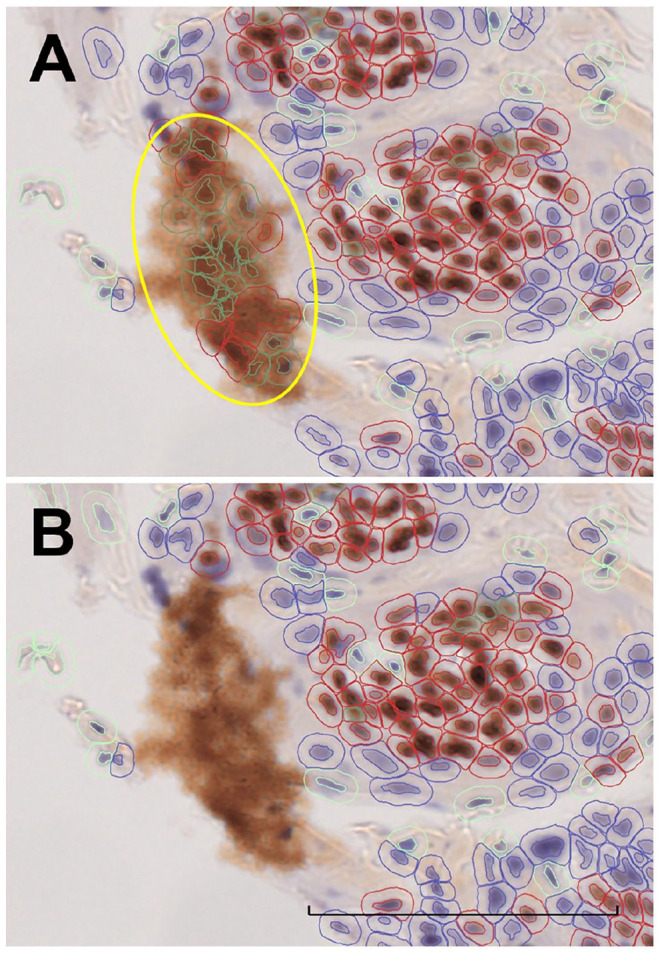
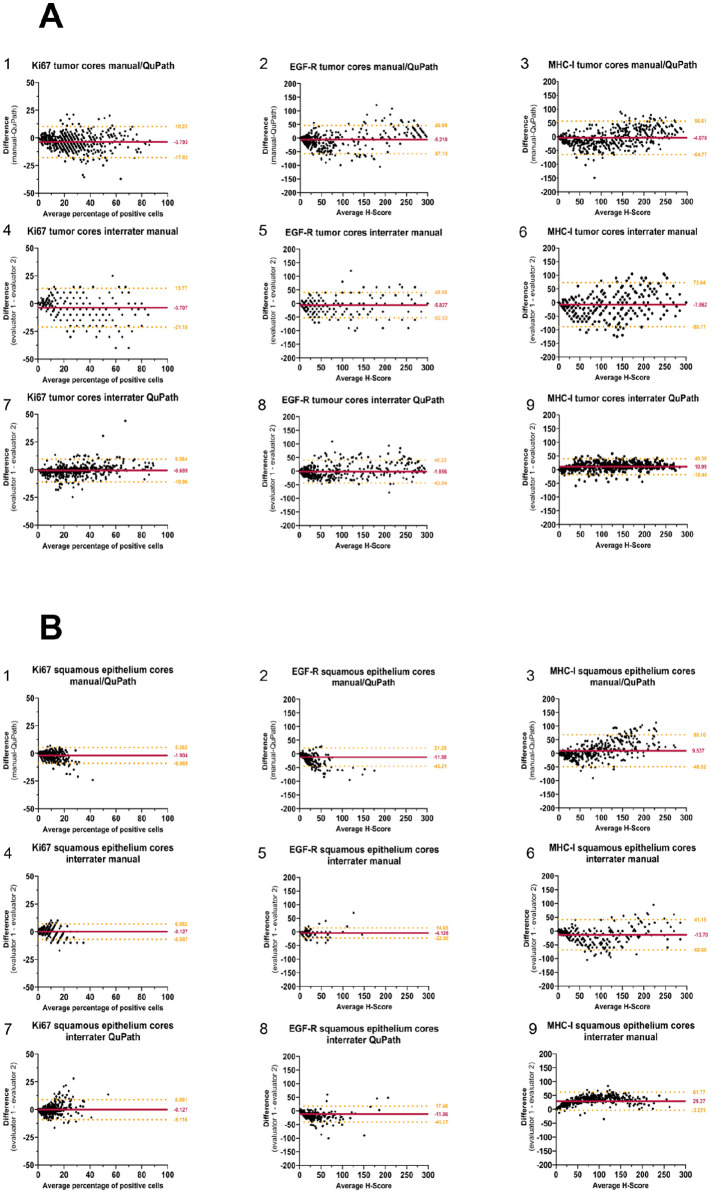
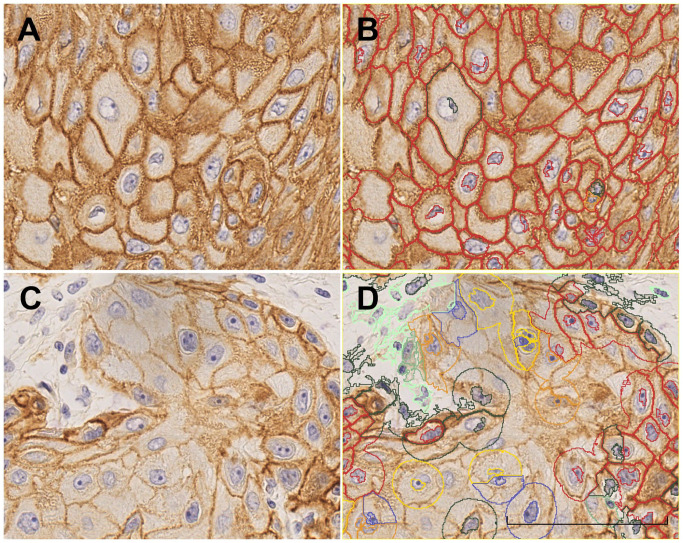
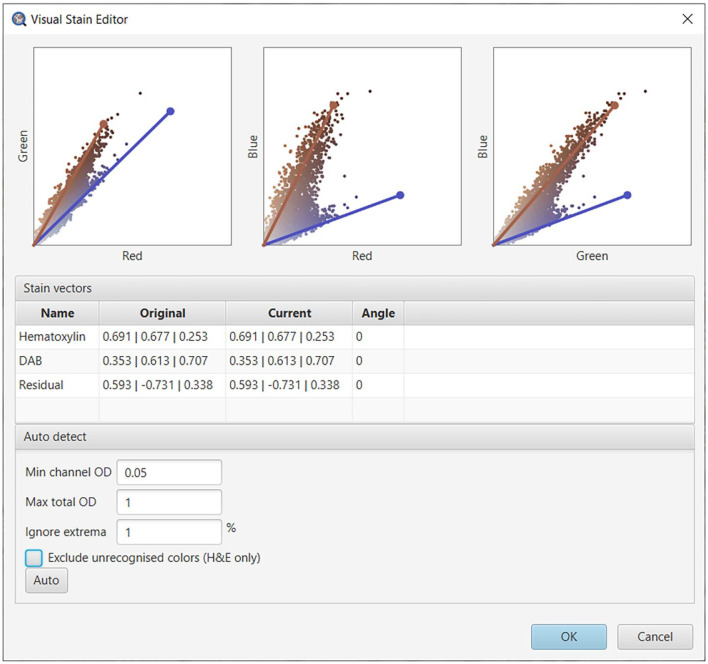
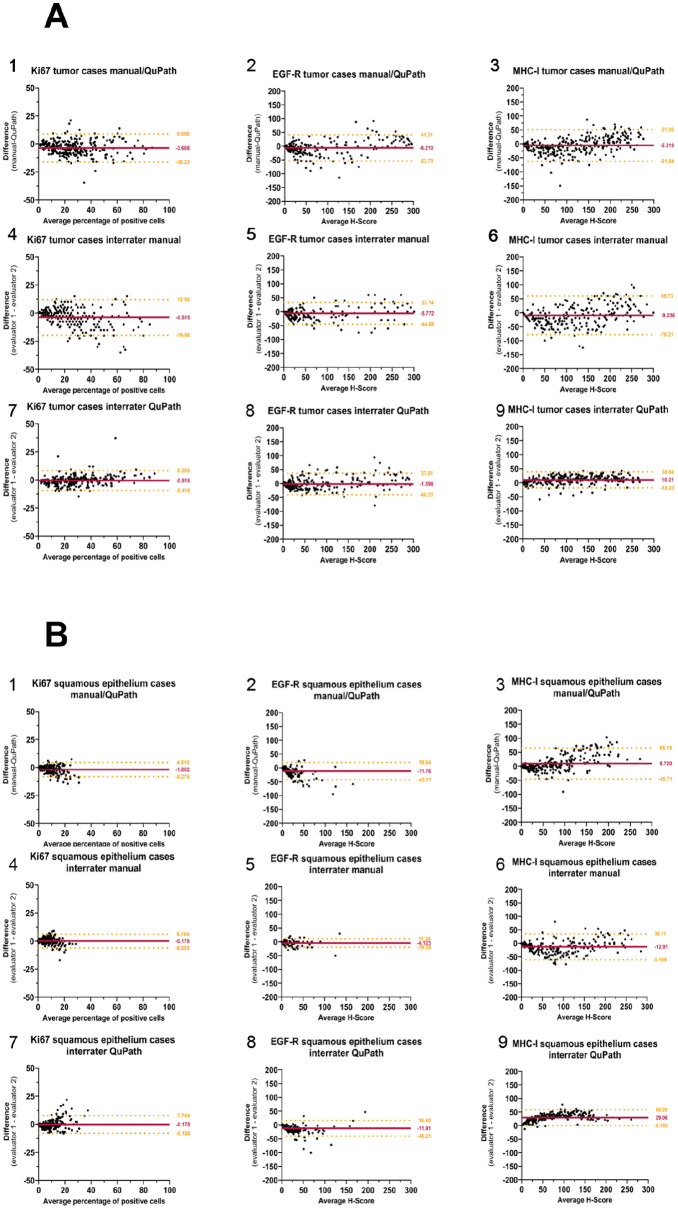
Gold standard for immunohistochemical analyses is the manual assessment by two specialist pathologists. This process is time-consuming, highly dependent on the respective evaluator and often difficult to reproduce. The use of image analysis software, such as ImageJ, QuPath, or CellProfiler, which employ machine learning and/or deep learning mechanisms to perform biomarker analyses, offers a potential solution to these problems. The objective of our study is to evaluate whether digital assessment using the open-source software QuPath is comparable to manual evaluation and to examine the inter-evaluator variability between the two manual evaluators and two software-based evaluations. Six tissue microarrays (TMAs) were constructed for a cohort of 309 patients with primary oral squamous cell carcinoma (OSCC). The tumor tissue and corresponding non-lesional squamous epithelial mucosa specimen were immunohistochemically stained for the biomarkers Ki67, as a nuclear marker; the epidermal growth factor receptor (EGF-R), as a membranous marker; and the major histocompatibility complex class I (MHC-I) heavy chain (HC) expressed on the membrane and in the cytoplasm. The staining pattern was analyzed by two experienced, independent manual evaluators and by QuPath. The percentage of positive cells, for Ki67, and the histoscore (H-score) based on the percentage of positive cells and their staining intensity, for EGF-R and MHC-I, were determined as final values. The results yielded high to excellent spearman correlation coefficients for all three biomarkers (p<0.001) in lesional and non-lesional tissues. The Bland-Altman plots demonstrated a high degree of agreement between manual and software-based analysis, as well as inter-evaluator variability demonstrating a high comparability of the evaluation methods. However, a prerequisite for a proper software-based analysis is an accurate, time-consuming annotation of the single specimen, which requires users with a comprehensive understanding of histology and extensive training in QuPath. Once these requirements are met, the software-based analysis offers advantages for large-scale biomarker studies due to objective and reproducible comparability of the stainings leading to a greater accuracy as well as the reuse of established conditions across similar analyses without requiring further operator input.
Keywords: biomarker; digital pathology; head and neck squamous cell carcinoma; immunohistochemistry.
Figures
References
-
- Wu L, Qu X. Cancer biomarker detection: recent achievements and challenges. Chem Soc Rev. 2015;44(10):2963–97. - PubMed
-
- Freier K, Joos S, Flechtenmacher C, Devens F, Benner A, Bosch FX, Lichter P, Hofele C. Tissue microarray analysis reveals site-specific prevalence of oncogene amplifications in head and neck squamous cell carcinoma. Cancer Res. 2003;63(6):1179–82. - PubMed
-
- Kononen J, Bubendorf L, Kallioniemi A, Bärlund M, Schraml P, Leighton S, Torhorst J, Mihatsch MJ, Sauter G, Kallioniemi OP. Tissue microarrays for high-throughput molecular profiling of tumor specimens. Nat Med. 1998;4(7):844–7. - PubMed
-
- Taylor CR. Immunomicroscopy : a diagnostic tool for the surgical pathologist. 2024. Available from: https://cir.nii.ac.jp/crid/1130000797961714560
Publication types
MeSH terms
Substances
LinkOut - more resources
Full Text Sources
Medical
Research Materials
Miscellaneous
