. 2025 Jun;34(6):e70154.
doi: 10.1002/pro.70154.

Polyglutamine expansion induced dynamic misfolding of androgen receptor

Affiliations

Polyglutamine expansion induced dynamic misfolding of androgen receptor

Laurens W H J Heling et al. Protein Sci. 2025 Jun.

Abstract

Spinal bulbar muscular atrophy (SBMA) is caused by a polyglutamine expansion (pQe) in the N-terminal transactivation domain of the human androgen receptor (AR-NTD), resulting in a combination of toxic gain- and loss-of-function mechanisms. The structural basis of these processes has not been resolved due to the disordered nature of the NTD, which hinders experimental analyses of its detailed conformations. Here, using extensive computational modeling, we show that AR-NTD forms dynamic compact regions, which upon pQe re-organize dynamically, mediated partly by direct pQ interaction with the Androgen N-Terminal Signature (ANTS) motif. The altered dynamics of the NTD result in a perturbation of interdomain interactions, with potential implications for the binding of the receptor protein to its response element. Oligomeric aggregation of the dynamic misfolded NTD exposes pQe, but blocks tau-5 and the FQNLF motif, which could lead to aberrant receptor transcriptional activity. These observations suggest a structural mechanism for AR dysfunction in SBMA.

Keywords: androgen receptor; intrinsically disordered protein; neuromuscular disorder; polyglutamine expansion; spinal‐bulbar muscular atrophy.


Conflict of interest statement

The authors have no conflicts of interest to disclose.

Figures

FIGURE 1
FIGURE 1
Full length model of AR‐NTD color coded by region. red: NR; blue: CR; green: DBD; purple: Hinge region and orange: LBD. The gray alpha‐helix in the DBD contains the DNA‐interacting P‐Box. Model combines the Alphafold structure of DBD‐LBD and the computationally derived wt‐NTD model published previously (Sheikhhassani et al., 2022). Model taken from Sheikhhassani et al. (2022). The graphic underneath highlights the linear structure of AR, with the subregions and corresponding residue numbers. It also contains some motifs important for AR function.
FIGURE 2
FIGURE 2
pQe results in local misfold and global alterations of protein dynamics (a) pQ tracts at the end of the simulations taken from “isolated simulations”, the SIRAH and a99SBdisp models. The results indicate that Q23 and Q45 tracts adopt different conformations. (b) pQ expansion results in an altered global conformation, both from SIRAH and a99SBdisp forcefields. NR is colored red, CR blue, the pQ region in silver and the FQNLF motif in cyan in all models. (c) Root mean squared fluctuations (RMSF) calculated per residue indicates that pQ expansion reduces chain dynamics. (d) Residue‐based α‐helix analysis of wt‐ and pQe‐NTD during the last 850 ns of all‐atom MD simulations. Residues that are involved in a stable helical formation (probability >30%) are observed in the FQNLF region and sections of the pQ and pQe tracts. (e) Quantitative secondary structure analysis reveals that pQ expansion increases the α‐helical content from 13.7 to 21.8% (error: STD over three simulations). (f) Contact time between the CR and NR regions of the wt‐NTD and pQe‐NTD. It is defined as the fraction of time during the last 850 ns of simulations when residues from the NR and CR were in contact (error: STD over three simulations). (g) Two‐dimensional density plots comparing the topological configuration space of the wt‐NTD and pQe‐NTD. Each contour plot shows the distribution of combined P + X topological relations as a function of S topological relations, aggregated over three independent simulation replicates. The contour levels represent the probability density of sampled configurations, with lighter shades indicating regions of higher probability. The axes represent the number of residues (×1000). (h) Residue‐based local circuit topology (CT) for WT and pQe AR NTD. The mean number of inverse parallel relations (±SEM, shown as shades) is shown as a function of residue number. The pQ tract and ANTS motif are highlighted by gray‐shaded areas.
FIGURE 3
FIGURE 3
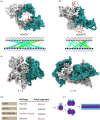
Protein–protein interactions are altered as a result of pQ expansion. (a) Representative structure of wt‐ and pQ‐NTD interacting with DBD (orange). CR‐mediated DNA binding regulation was reduced in pQe‐NTD due to exposure of P‐Box despite (black) NTD‐DBD interactions. The pQ region is colored in silver and the FQNLF motif in cyan in all models. (b) Representative structure of wt‐NTD interacting with RAP74. pQ expansion induces a change in binding sites, reducing transcriptional control. (c) Representative structure of wt‐NTD interacting with CHIP. Bar charts indicate the fraction of poses interacting with NR (red) NR/CR (dual colored) and CR (blue) residues. Graphics underneath highlight the mechanistic changes upon pQ expansion.
FIGURE 4
FIGURE 4
Multimerization of pQe NTD leads to fibrillar aggregates. Representative structure and residue interaction map of (a) wt‐NTD and (b) pQe‐NTD dimer. The white and cyan structures represent one NTD monomer, the pQ tract is depicted in red. The precise interactions we saw between the two monomers for wt‐ and pQe‐NTD are depicted under the representative structures. Different types of interactions are colored differently: Hydrogen bonds (green), Salt Bridge/Ionic (cyan), π‐Cation (red), and π‐Stacking (blue). (c) Models of tetramer and octamer of pQe AR‐NTD. The exposed pQ tracts are depicted in red. The cyan and white in these models each depict half the total number of proteins in the oligomer. (d) Table of functionally important motifs and their involvement in a NTD dimer. “Exposed” means that the motif is exposed on the surface of the dimer, while “blocked” means that it is buried in the interaction interface. “Partially involved” means that a subpart of the motif is involved in the dimer interface. (e) Aggregation model of pQe NTD, leading from a monomer to a fibril with the pQ tracts exposed.

References

    1. Abraham MJ, Murtola T, Schulz R, Páll S, Smith JC, Hess B, et al. GROMACS: high performance molecular simulations through multi‐level parallelism from laptops to supercomputers. SoftwareX. 2015;1–2:19–25.
    1. Adachi H. Widespread nuclear and cytoplasmic accumulation of mutant androgen receptor in SBMA patients. Brain. 2005;128:659–670. - PubMed
    1. Adegbuyiro A, Sedighi F, Pilkington AW, Groover S, Legleiter J. Proteins containing expanded polyglutamine tracts and neurodegenerative disease. Biochemistry. 2017;56:1199–1217. - PMC - PubMed
    1. Alibay I, Barnoud J, Beckstein O, Gowers RJ, Loche PR, MacDermott‐Opeskin H, et al. Building a community‐driven ecosystem for fast, reproducible, and reusable molecular simulation analysis using mdanalysis. Biophys J. 2023;122:420A.
    1. Arrasate M, Mitra S, Schweitzer ES, Segal MR, Finkbeiner S. Inclusion body formation reduces levels of mutant huntingtin and the risk of neuronal death. Nature. 2004;431:805–810. - PubMed

MeSH terms