. 2025 May;93(5):e70092.
doi: 10.1111/aji.70092.

Deciphering the Molecular Crosstalk of Endoplasmic Reticulum Stress and Immune Infiltration in Endometriosis

Affiliations

Deciphering the Molecular Crosstalk of Endoplasmic Reticulum Stress and Immune Infiltration in Endometriosis

Yuan Ma et al. Am J Reprod Immunol. 2025 May.

Abstract

Background: Endometriosis (EMs), characterized by ectopic endometrial growth causing infertility. Endoplasmic reticulum stress (ERS) is an important cellular defense mechanism. However, the correlation between ERS and EMs remains unclear. We aimed to investigate the relationship between them, identify biomarkers, and offer new insights into the treatment of EMs.

Methods: Two RNA expression datasets (GSE120103 and GSE25628) related to EMs in Homo sapiens were used to identify ERS-differentially expressed genes (ERS-DEGs). Protein-protein interaction (PPI) networks and CytoHubba (Cytoscape) identified ERS-associated HUB genes, with receiver operating characteristic curves (ROC) evaluating diagnostic value. Constructed mRNA-microRNA (miRNA)/RNA-transcription factor (TF) interaction networks and performed ssGSEA to compare immune infiltration between EMs patients and controls. Real-time quantitative polymerase chain reaction (RT-qPCR), western blotting (WB), and immunohistochemistry (IHC) were performed to assess potential biomarker levels.

Results: Thirty-three ERS-DEGs were identified, with nine HUB genes (HSPA5, XBP1, HSP90B1, DNAJC3, PDIA3, PDIA6, PDIA4, HERPUD1, and MANF) demonstrating diagnostic efficacy (AUC > 0.7). Furthermore, immune infiltration revealed a significant relationship between immune cell abundance and HUB gene expression. Experimental validation confirmed the consistency of four biomarkers (HSPA5, HSP90B1, PDIA6, and HERPUD1). Regulatory network analysis identified 62 miRNAs and 44 TFs interacting with HUB genes, suggesting a multifactorial immunometabolic axis.

Conclusions: We identified four biomarkers (HSPA5, HSP90B1, PDIA6, and HERPUD1) associated with ERS that offer new insights into the detection and treatment of EMs. Our findings indicate an abnormal response to ERS and immune system infiltration contribute to the progression of EMs.

Keywords: endometriosis; endoplasmic reticulum stress; immune system infiltration.


Figures

FIGURE 1
FIGURE 1
Screening of DEGs associated with EMs. (A) Boxplot of the merged dataset before dataset correction. (B) Boxplot after correction of the merged dataset. (C) PCA plot of the combined dataset before correction. (D) PCA plot after correction of the combined dataset.
FIGURE 2
FIGURE 2
Identification of ERSRGs associated genes in EMs. (A) Volcano plot of DEG analysis between the normal and EMs groups in the combined dataset. (B) Venn diagram of DEGs and ERSRGs in the combined dataset. (C) Heatmap of ERS‐DEGs in the combined dataset. DEGs, differentially expressed genes; ERSRGs, ERS‐related genes.
FIGURE 3
FIGURE 3
Functional and signaling pathway enrichment of 33 ERS‐DEGs. (A) Bubble plot of GO enrichment analysis. (B) Bubble plot of KEGG enrichment analysis. (C) Bar chart of GO enrichment analysis. (D) Bar chart of KEGG enrichment analysis. (E) Network diagram of GO functional enrichment analysis of CSDEGs. (F) Network diagram of KEGG pathway enrichment analysis of CSDEGs. The screening criteria for significantly enriched GO and KEGG entries were p.adjust < 0.05 and FDR value (q‐value) < 0.05. GO, gene ontology; BP, biological process; CC, cellular component; MF, molecular function; KEGG, Kyoto Encyclopedia of Genes and Genomes.
FIGURE 4
FIGURE 4
Gene set enrichment analysis (GSEA) of 33 ERS‐DEGs. (A) GSEA of the EMs/normal group samples in the combined dataset showed four main biological characteristics. (B–E) MAPK (B) and JAK‐STAT signaling pathways (C). TP53 regulates metabolic genes (D), Wnt signaling (E), and NF‐κB activation through the FADD Rip 1 pathway mediated by caspases 8 and 10 (F) and other pathways.
FIGURE 5
FIGURE 5
Screening HUB genes associated with ERSRGs in EMs. (A) PPI network of the STRING database. (B) PPI network of the Cytoscape database. (C–G) PPI network of HUB genes under the Closenes (C), Degree (D), EPC (E), MCC (F), and MNC (G) algorithms; colors from light to dark represent scores from low to high. H. closeness, degree, EPC, MCC, and MNC five‐algorithm Venn diagram. I. The reciprocal network was collected and derived from the GeneMANIA website, where black circles with white slash lines represent input HUB genes, and other black circles without white slash lines represent functionally predicted genes. The red line represents the physical interactions between genes, purple line represents the co‐expression between genes, yellow lines represent shared protein domains between genes, blue lines represent co‐localization relationships between genes, and green lines represent genetic interactions between genes. ERS‐DEGs, ERS‐differentially expressed genes; PPI, protein–protein interaction; Degree, degree correlation; MNC, maximum neighborhood component; MCC, maximal clique centrality; EPC, edge‐percolated component; Closeness, closeness centrality.
FIGURE 6
FIGURE 6
Group comparison plot and ROC curve. (A) Group comparison graph shows the difference in the expression of HUB genes in the dataset. Statistical methods: Mann–Whitney U test (Wilcoxon rank‐sum test). (B–E) ROC curve of nine HUB genes (HSPA5, XBP1, HSP90B1, DNAJC3, PDIA3, PDIA4, PDIA6, HERPUD1, and MANF) with normal and EMs as outcome variables. The symbol * is equivalent to p < 0.05, which is statistically significant, and ** represents p < 0.01, *** represents p < 0.001. The area under the ROC curve values are generally between 0.5 and 1. The closer the AUC is to 1, the better is the diagnostic performance. When the AUC was between 0.5 and 0.7, the accuracy was low; when the AUC was between 0.7 and 0.9, the accuracy was moderate; and when the AUC was above 0.9, the accuracy was high. FPR, false positive rate; TPR, true positive rate; ROC, receiver operating characteristics.
FIGURE 7
FIGURE 7
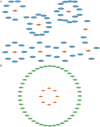
mRNA‐miRNA and mRNA‐TF interaction networks of HUB genes. (A) mRNA‐miRNA interaction network of HUB genes. (B) mRNA‐TF interaction network of HUB genes. The orange diamonds in the mRNA‐miRNA (A) interaction network represent mRNAs and the blue ovals represent miRNAs. The orange diamonds in the mRNA‐TF (B) interaction network represent mRNAs and the green ovals represent transcription factors. TF, transcription factor.
FIGURE 8
FIGURE 8
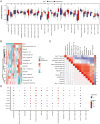
Immune cell infiltration analysis of dataset samples of HUB genes. (A) Group comparison diagram of ssGSEA immune infiltration analysis results for dataset samples. (B) Heatmap of ssGSEA immune infiltration analysis results for dataset samples. (C) The results of the correlation analysis of immune cell infiltration abundance of the dataset samples are presented. (D) Heatmap of the correlation between immune cell infiltration abundance and expression levels of nine HUB genes. The symbol ns is equivalent to p < 0.05, indicating no statistical significance. The symbol * is equivalent to p < 0.05, which is statistically significant. The symbol ** is equivalent to p < 0.01, which is highly statistically significant. The symbol *** is equivalent to p < 0.001, which is highly statistically significant.
FIGURE 9
FIGURE 9
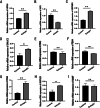
(A–I) qPCR results of nine HUB genes (HSPA5, XBP1, HSP90B1, DNAJC3, PDIA3, PDIA4, PDIA6, HERPUD1, and MANF) with normal and EMs as outcome variables. The symbol * is equivalent to p < 0.05, which is statistically significant, ** represents p < 0.01, which is highly statistically significant, and *** represents p < 0.001, which is highly statistically significant.
FIGURE 10
FIGURE 10
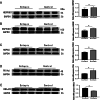
(A–E) WB results of five HUB genes (HSPA5, HSP90B1, DNAJC3, PDIA6, and HERPUD1) with normal and EMs as outcome variables. The symbol * is equivalent to p < 0.05, which is statistically significant, ** represents p < 0.01, which is highly statistically significant, and *** represents p < 0.001, which is highly statistically significant.
FIGURE 11
FIGURE 11
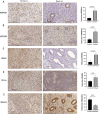
(A–E) IHC results of five HUB genes (HSPA5, HSP90B1, DNAJC3, PDIA6, and HERPUD1) with normal and EMs as outcome variables. The symbol * is equivalent to p < 0.05, which is statistically significant, ** represents p < 0.01, which is highly statistically significant, and *** represents p < 0.001, which is highly statistically significant.

Similar articles

References

    1. Becker C. M., Bokor A., Heikinheimo O., et al., “ESHRE Guideline: Endometriosis,” Human Reproduction Open 2022, no. 2 (2022): hoac009. - PMC - PubMed
    1. Anglesio M. S. and Yong P. J., “Endometriosis‐Associated Ovarian Cancers,” Clinical Obstetrics and Gynecology 60, no. 4 (2017): 711–727. - PubMed
    1. Hetz C. and Papa F. R., “The Unfolded Protein Response and Cell Fate Control,” Molecular Cell 69, no. 2 (2018): 169–181. - PubMed
    1. Wang H., Karnati S., and Madhusudhan T., “Regulation of the Homeostatic Unfolded Protein Response In Diabetic Nephropathy,” Pharmaceuticals (Basel) 15, no. 4 (2022): 401. - PMC - PubMed
    1. Lin S., Yang L., Shi H., et al., “Endoplasmic Reticulum‐Targeting Photosensitizer Hypericin Confers Chemo‐Sensitization Towards Oxaliplatin Through Inducing Pro‐Death Autophagy,” International Journal of Biochemistry & Cell Biology 87 (2017): 54–68. - PubMed