Review
. 2025 Jun;34(6):e70148.
doi: 10.1002/pro.70148.

Chemically induced partial unfolding of the multifunctional apurinic/apyrimidinic endonuclease 1

Affiliations
Review

Chemically induced partial unfolding of the multifunctional apurinic/apyrimidinic endonuclease 1

Ratan Rai et al. Protein Sci. 2025 Jun.

Abstract

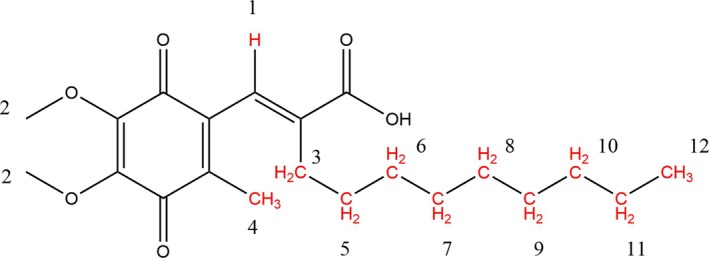
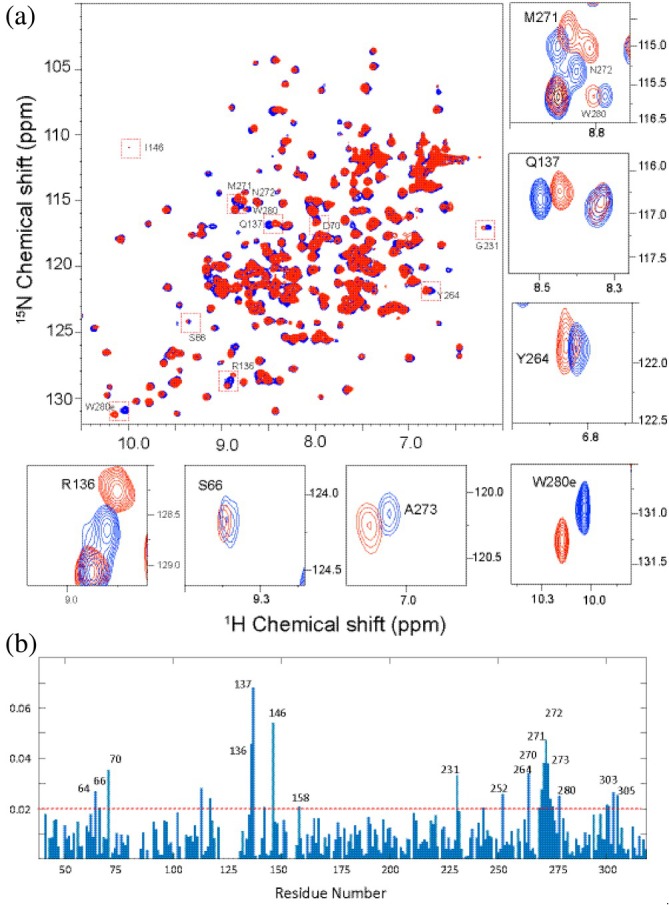
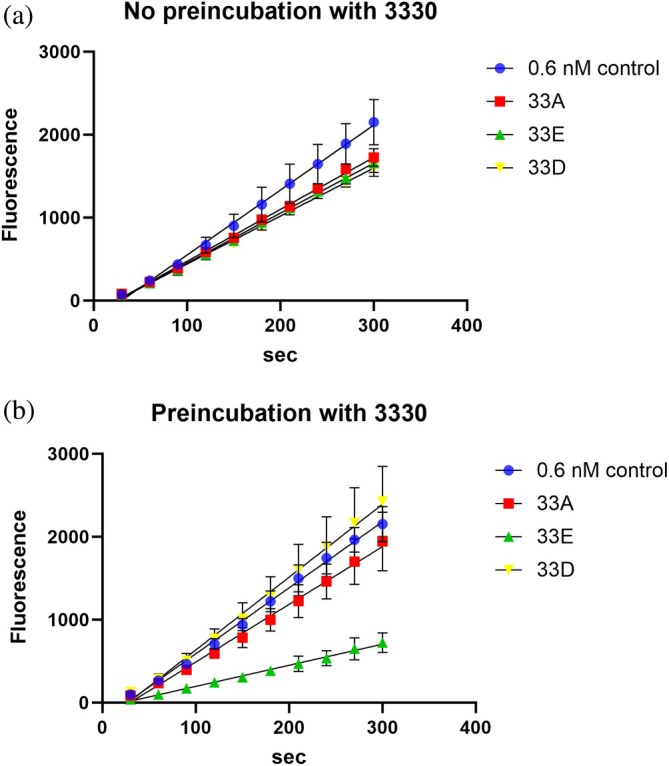
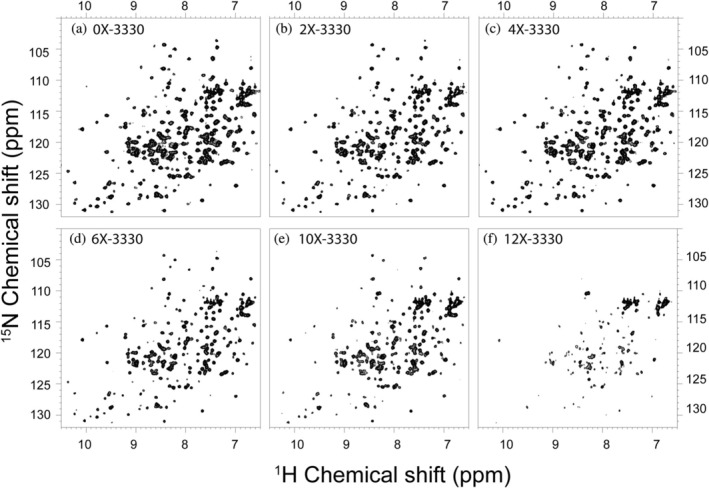
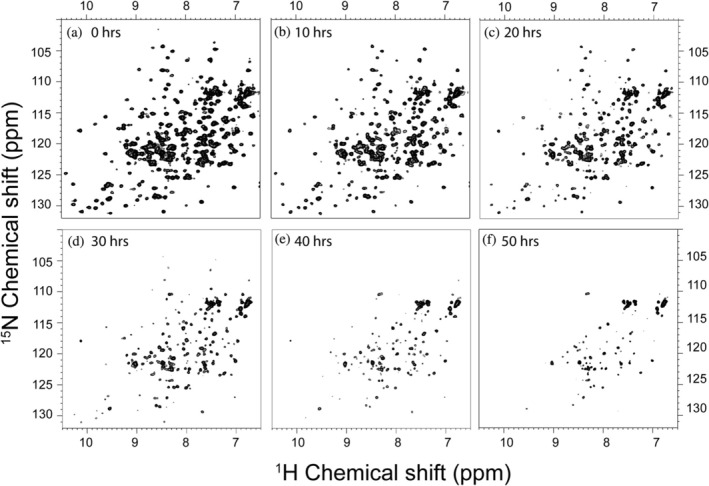
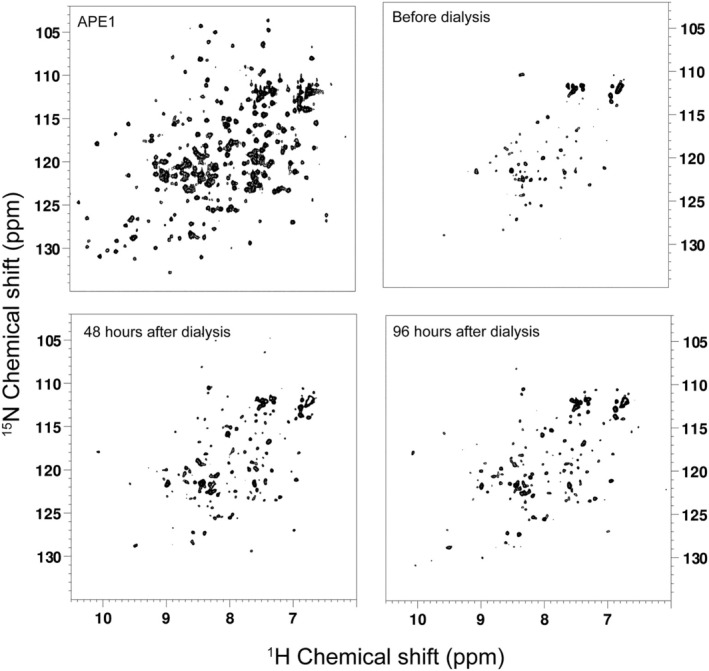
Apurinic/apyrimidinic endonuclease I (APE1) acts as both an endonuclease and a redox factor to ensure cell survival. The two activities require different conformations of APE1. As an endonuclease, APE1 is fully folded. As a redox factor, APE1 must be partially unfolded to expose the buried residue Cys65, which reduces transcription factors including AP-1, NF-κB, and HIF-1α and thereby enables them to bind DNA. To determine a molecular basis for partial unfolding associated with APE1's redox activity, we characterized specific interactions of a known redox inhibitor APX3330 with APE1 through waterLOGSY and 1H-15N HSQC NMR approaches using ethanol and acetonitrile as co-solvents. We find that APX3330 binds to the endonuclease active site in both co-solvents and to a distant small pocket in acetonitrile. Prolonged exposure of APE1 with APX3330 in acetonitrile resulted in a time-dependent loss of 1H-15N HSQC chemical shifts (~35%), consistent with partial unfolding. Regions that are partially unfolded include adjacent N- and C-terminal beta strands within one of the two sheets comprising the core, which converge within the small binding pocket defined by the CSPs. Removal of APX3330 via dialysis resulted in a slow reappearance of the 1H-15N HSQC chemical shifts suggesting that the effect of APX3330 is reversible. APX3330 significantly decreases the melting temperature of APE1 but has no effect on endonuclease activity using a standard assay in either co-solvent. Our results provide insights on reversible partial unfolding of APE1 relevant for its redox function as well as the mechanism of redox inhibition by APX3330.

Keywords: APE1; APX3330; HSQC NMR; partial unfolding.


Conflict of interest statement

MRK is the CSO and cofounder of Apexian Pharmaceuticals, which developed APX3330 for an oncology clinical trial and Ocuphire Pharma (now Opus Genetics) for a diabetic retinopathy clinical trial. Neither Apexian Pharmaceuticals nor Opus Genetics had any input or control over the contents of this manuscript.

Figures

FIGURE 1
FIGURE 1
Chemical structure of APX3330 (E3330). Protons with altered solvent accessibility in a 1D WaterLOGSY NMR experiment are highlighted in red. Numbers refer to assignments on the NMR spectra (Figure S9).
FIGURE 2
FIGURE 2
Interaction of APX3330/ethanol results in CSPs within the endonuclease active site of APE1. (a) 2D 1H–15N HSQC spectral overlay of the APE1 (85 μM) spectrum (black) and with 850 μM APX3330 (red). Each cross peak corresponds to one backbone or side chain amide. Specific chemical shift perturbations are shown in small boxes. (b) The chemical shift perturbations versus residue number reveal urbations versus residue number reveal defined interactions with APE1.
FIGURE 3
FIGURE 3
Interaction of APX3330/acetonitrile result in CSPs defining two distinct pockets in APE1. (a) 2D 1H–15N HSQC spectral overlay of the APE1 (85 μM) spectrum (black) and with 850 μM APX3330 (red). Each cross peak corresponds to one backbone or side chain amide. Specific chemical shift perturbations are shown in small boxes. (b) The chemical shift perturbations versus residue number reveal widespread interactions with APE1.
FIGURE 4
FIGURE 4
Residues with CSPs greater than 0.02 are shown mapped on the structure of APE1 (PDB ID: 4QHD) for the single point, 10‐fold molar excess of APX3330 dissolved in acetonitrile. APE1 is shown as a semi‐transparent gray surface rendering in (a) and cartoon rendering with residues as ball‐and‐stick models (C, green for small pocket, cyan for endonuclease active site, magenta for internal residues on N‐terminal strand, or orange for other residues; O, red; N, blue; and S, yellow) in (b). In (a), a small pocket is defined by interactions of Ile64 (C, magenta), Arg136, and Gln137 with APX3330 (C, green). This pocket is located on the opposite face of APE1 from the endonuclease active site. (b) The same as in (a) is shown as a cartoon rendering. (c) A semi‐transparent surface rendering for a view of APE1 rotated approximately 180° highlights residues within the endonuclease active site (C, cyan) with significant CSPs. (d) A cartoon rendering of the same view as in (c) is shown. (e) A surface rendering of APE1 with a stick model of bound DNA substrate mimic (PDB ID: 5DFI) is shown. Highlighted in the color scheme indicated above are a subset of residues with significant CSPs that are found in either active site (Asp 70 and Asn 272) or the small pocket (Arg136) and the abasic site (ABS). (f) A close‐up of the endonuclease active site is shown with the abasic site (ABS) flipped out into the shallow pocket defined by Trp280 (light blue).
FIGURE 5
FIGURE 5
Docking of APX3330 based on crystal structure of CRT0044876 (7TC2). (a) A semi‐transparent surface of APE1 (4QHD) is shown with residues Arg136, Gln137, and Ser164 (stick model with C green, O red, and N blue), which define the small pocket identified in the crystal structure and our CSP analysis. Ser164 exhibited a significant CSP in the 10‐fold molar excess point in our titration experiment for APX3330 dissolved in acetonitrile. For reference, Ile64 and Ser66 are shown as stick models with C atoms in magenta. Consensus poses for APX3330 obtained from AutoDock Vina in yellow and CDOCKER in cyan are shown superimposed on the pose for CRT0004876 from the crystal structure. (b) A close‐up view of the consensus poses shown in (a). (c) The consensus APX3330 models shown in yellow and cyan as indicated in (a) with CRT0044876 in blue.
FIGURE 6
FIGURE 6
APX3330 inhibits endonuclease activity only when preincubated with APE1 and when ethanol is used as a co‐solvent. (a) APX3330 (10 μM) dissolved in acetonitrile (red square), ethanol (green triangle), or DMSO (yellow cross) has little effect on the rate of endonuclease activity (control blue circle) when added to reactions containing APE1 (0.6 nM) and DNA substrate (50 nM). (b) Preincubation of APX3330 (final concentration of 10 μM) dissolved in acetonitrile, ethanol, or DMSO (same symbols and colors as for (a)) shows differential effects, with the co‐solvent ethanol resulting in a significant reduction in the rate of endonuclease activity. Triplicate measurements were made for endonuclease activity.
FIGURE 7
FIGURE 7
Concentration dependent effects of APX3330 on [U15N]‐APE1. All 1H–15N HSQC spectra were recorded on a single APE1 sample. (a) 2D 1H–15N HSQC spectra of (85 μM) free protein. 1H–15N HSQC spectra with increasing APX3330 concentration: (b) 2‐fold APX3330, (c) 4‐fold APX3330, (d) 6‐fold APX3330, (e) 10‐fold APX3330, and (f) 12‐fold APX3330. It took a total of 24 h to record all spectra. The time points for APX3330 titration are as follows: (b) 2.0 h, (c) 4.2 h, (d) 6.3 h, (e) 8.3 h, and (f) 24 h at 25°C.
FIGURE 8
FIGURE 8
Time dependent effects of APX3330 on [U15N]‐APE1. A time course of 1H–15N HSQC spectra was collected at 30°C following the addition of an 8‐fold molar excess of APX3330 at (a) 0 h, (b) 10 h, (c) 20 h, (d) 30 h, (e) 40 h, and (f) 50 h. The peak intensities decrease as time progresses and approximately 35% of the backbone resonances are lost after 40 h; this spectrum appears similar to that of the 12‐fold APX3330.
FIGURE 9
FIGURE 9
Time‐dependent effects of APX3330 on APE1. (a) Highlighted in red on a cartoon rendering of APE1 (4QHD) are the residues for which backbone resonances were lost in the 40 h time point in the HSQC spectrum, while in tan are the residues that were initially unassigned. Cys65 located in strand 1 is shown as a yellow stick model. (b) A view of APE1 with the same residues highlighted looking down the beta sandwich. Numbering is shown for the strands comprising sheet 1 of the beta sandwich core. In (c) and (d), the same views of APE1 are shown with the N‐terminal region highlighted in blue including strand 1 and the C‐terminal region in red, including strand 6, highlighting the juxtaposition of the N‐ and C‐terminal regions of the protein within sheet 1.
FIGURE 10
FIGURE 10
Chemically induced partial unfolding of APE1 is reversible following removal of APX3330. Following dialysis to remove APX3330, a subset of backbone resonances reappears in the 2D 1H–15N HSQC spectrum of APE1 after 48 hours. After 96 hours, a few more backbone resonances reappear. This result is consistent with slow refolding of the protein. All 1H–15N HSQC spectrum of [U15N]‐APE1(90 μM) were collected on a 600 MHz Bruker AVANCE spectrometer equipped with a 5‐mm triple‐resonance cryoprobe at 25 °C. The 2D 1H–15N NMR HSQC spectra were acquired with 2048 points in the direct F2 dimension (1H) and 256 points in the F1 dimension (15N).

Update of

Similar articles

References

    1. Bapat A, Glass LS, Luo M, Fishel ML, Long EC, Georgiadis MM, et al. Novel small‐molecule inhibitor of apurinic/apyrimidinic endonuclease 1 blocks proliferation and reduces viability of glioblastoma cells. J Pharmacol Exp Ther. 2010;334:988–998. - PMC - PubMed
    1. Barchiesi A, Bazzani V, Jabczynska A, Borowski LS, Oeljeklaus S, Warscheid B, et al. DNA repair protein APE1 degrades dysfunctional abasic mRNA in mitochondria affecting oxidative phosphorylation. J Mol Biol. 2021;433:167125. - PubMed
    1. Barchiesi A, Wasilewski M, Chacinska A, Tell G, Vascotto C. Mitochondrial translocation of APE1 relies on the MIA pathway. Nucleic Acids Res. 2015;43:5451–5464. - PMC - PubMed
    1. Best RB, Mittal J, Feig M, MacKerell AD Jr. Inclusion of many‐body effects in the additive CHARMM protein CMAP potential results in enhanced cooperativity of alpha‐helix and beta‐hairpin formation. Biophys J. 2012;103:1045–1051. - PMC - PubMed
    1. Best RB, Zhu X, Shim J, Lopes PE, Mittal J, Feig M, et al. Optimization of the additive CHARMM all‐atom protein force field targeting improved sampling of the backbone phi, psi and side‐chain chi(1) and chi(2) dihedral angles. J Chem Theory Comput. 2012;8:3257–3273. - PMC - PubMed

MeSH terms