Review
. 2025 May 9;37(5):koaf036.
doi: 10.1093/plcell/koaf036.

Lost in translation: What we have learned from attributes that do not translate from Arabidopsis to other plants

Affiliations
Review

Lost in translation: What we have learned from attributes that do not translate from Arabidopsis to other plants

Adrienne H K Roeder et al. Plant Cell. .

Abstract

Research in Arabidopsis thaliana has a powerful influence on our understanding of gene functions and pathways. However, not everything translates from Arabidopsis to crops and other plants. Here, a group of experts consider instances where translation has been lost and why such translation is not possible or is challenging. First, despite great efforts, floral dip transformation has not succeeded in other species outside Brassicaceae. Second, due to gene duplications and losses throughout evolution, it can be complex to establish which genes are orthologs of Arabidopsis genes. Third, during evolution Arabidopsis has lost arbuscular mycorrhizal symbiosis. Fourth, other plants have evolved specialized cell types that are not present in Arabidopsis. Fifth, similarly, C4 photosynthesis cannot be studied in Arabidopsis, which is a C3 plant. Sixth, many other plant species have larger genomes, which has given rise to innovations in transcriptional regulation that are not present in Arabidopsis. Seventh, phenotypes such as acclimation to water stress can be challenging to translate due to different measurement strategies. And eighth, while the circadian oscillator is conserved, there are important nuances in the roles of circadian regulators in crop plants. A key theme emerging across these vignettes is that even when translation is lost, insights can still be gained through comparison with Arabidopsis.


Conflict of interest statement

M.A.H. is an employee of BASF and owns shares in companies that sell agricultural products. The views of M.A.H expressed here are personal.

Figures

Figure 1.
Figure 1.
Floral dip transformation. GUS staining of (A) entire Arabidopsis flower, and (B) Arabidopsis ovule, after floral dip with Agrobacterium carrying intron-GUS in T-DNA. C) Immature Arabidopsis flower (gynoecium in center, surrounded by 6 anthers). Arabidopsis gynoecium (pistil) develops as an open vase; stigmatic cap only forms and closes locule 3 to 4 days before anthesis. D) Lost effort to translate floral dip to soybean (success rate 0/200,000 seeds). E) Possible air-brush method for applying Agrobacterium/sucrose/surfactant to floral primorida of soybean (or other plants). A and B are from (Desfeux et al. 2000), C is from (Bowman 1994).
Figure 2.
Figure 2.
Comparison of expected copy number, synteny, and gene tree topology across 3 species. A) Time-calibrated phylogenies for the 3 contrasts. Each internal branch is dated by its median predicted divergence time. Stars indicate WGDs (white) and triplications (grey). **Indicates the expected copy number, based on ploidy increases following whole-genome duplications without consideration of subsequent diploidization. B) GENESPACE synteny maps between focal (blue; human, maize, soybean) and model (brown; mouse, rice, Arabidopsis) chromosomes. Synteny to the first chromosome of the focal species are colored red, while synteny to all other focal species’ chromosomes are light grey. Chromosome segments are scaled by their physical size (see independent key for each contrast for the length of a 500-Mb segment) and ordered by the alphanumeric chromosome ID order. C) Representative gene trees for sets of orthologs. For each contrast, 2 gene trees are presented. The left tree follows the expected copy number of orthologs in that contrast, given the whole-genome duplications presented in panel A. The right gene tree is a well-known complex gene tree with variable copy number. D) Tabulation of orthogroup classifications for the 3 contrasts: 1-to-1 orthologs are single copy in each genome (pink), PAV are missing in 1 genome (yellow), and CNV orthogroups (blue) are the remainder. E) Tabulation of orthogroup classifications for 2 pairs of genome annotations. Both annotations for the soybean contrast (top) were built by Phytozome with identical parameters and methods. The rice contrast (bottom) compares the genome annotation of “Nipponbarre,” which was originally annotated by Michigan State University (and is now hosted on NCBI), and the “Kitaake” cultivar, which was annotated by Phytozome. Colors and class orders follow panel D.
Figure 3.
Figure 3.
Loss of arbuscular mycorrhizal (AM) symbiosis in Arabidopsis. Phylogenetic tree of selected flowering plant species that shows the loss of genes required to engage in AM symbiosis in some plants from the Brassicales order, including Arabidopsis thaliana. Red represents the clades that lost the ability for AM symbiosis. Examples of known genes are included in the tree, showing how some genes are lost during evolution. Black genes represent genes conserved for AM symbiosis, and red genes are those with functions in both AM symbiosis and other important developmental pathways. A rough time scale is included to provide context and is based on (Hohmann et al. 2015). Diagrams represent root segments that successfully (upper) or unsuccessfully (lower) engage in symbiosis with AM fungi.
Figure 4.
Figure 4.
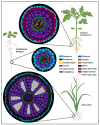
Schematic of tomato, Arabidopsis, and rice plants with cross-sectional diagrams depicting their respective root anatomies highlighting the polar lignin cap in Solanum lycopersicum (tomato) and aerenchyma in Oryza sativa (rice). Root legend cell type colors are listed in order from the outermost layer to the innermost layer as in Oryza sativa. Partially created with BioRender.com. Rice root image is adapted from BAR (bar.utoronto.ca) and Kajala et al. 2021.
Figure 5.
Figure 5.
Molecular networks conserved across species aid translation from C3 to C4 photosynthesis. A) In C3 plants, assimilation of CO2 primarily occurs in mesophyll cells, with the bundle sheath also contributing to sulfur assimilation, water transport, and decarboxylation of C4 acids derived from the transpiration stream. B) C4 photosynthesis involves the coordinated function of mesophyll and bundle sheath cells to enhance carbon fixation efficiency. Carbon atoms are indicated by dots. C) Summary of areas where analysis of Arabidopsis has been informative, as well as areas where predictions are more challenging.
Figure 6.
Figure 6.
The presence of distal regulatory regions in large genomes. A) Schematic diagram generated by BioRender showing the nucleosome distribution of closed and accessible chromatin regions (ACRs) upstream of a gene. The ACRs are often nucleosome-free, with TF binding to cis-regulatory elements that can regulate gene expression. Histone acetylation such as H3K27ac and H3K9ac are often deposited at the nucleosomes flanking accessible chromatin regions as well as the transcribed gene body region. The first nucleosome near transcriptional start sites is marked with H3K4me3. The TE and repeat regions have condensed nucleosomes and are often associated with DNA hypermethylation and H3K9me2. B) Maize genes often have additional distal ACRs. The distribution of distance of the summit of ATAC-seq peak to the nearest gene's transcriptional start site is shown. To avoid the noise in cross-species comparison, only the top 10,000 peaks from Arabidopsis and maize leaf ATAC-seq based on signal fold change are used (Tu et al. 2022). Including the weaker ATAC-seq peaks will not change the pattern but will increase the height of maize 4-kb and Arabidopsis 1.4-kb peaks.
Figure 7.
Figure 7.
Water potential (ψw) is the variable most directly describing water status. The description of acclimation responses is only meaningful within water potential values between the first signs of stress and nonreturn values; however, this range varies in different plant species and cannot be transferred without wet lab/experimental confirmation. ψw can be directly quantified in most plants by a Scholander's chamber, but this is not so straightforward in Arabidopsis. Thus, other, more indirect variables are normally measured, such as relative water content (RWC), water potential in soil (ψsoil) or osmotic potential in tissues (ψo). Plant acclimation strategies to water status variations during both water deprivation and rehydration routines modulate stomatal conductance (gs) and transpiration, measured by various means. However, the relationship between these variables and ψw (and its indirect proxies) is not the same in Arabidopsis and crops, which once again complicates the transfer of meaningful information; in addition, stomatal conductance will be affected by vapor pressure deficit (VPD) between leaf tissues and air, which can vary dramatically for semi-controlled environments and field experiments. Although a thorough characterization is missing, the gsw relationship in Arabidopsis seems to follow an intermediate curve between the one describing tolerance vs avoidance strategies.
Figure 8.
Figure 8.
Identification of circadian oscillator components has informed analysis of the effect of circadian loci on phenotypes in crops. A) Arabidopsis circadian oscillator components ordered by sequence of approximate activity where blue indicates dawn (LHY to CCA1), yellow the day (REV8 to PRR3), red dusk (ZTL to TOC1), and grey the night (ELF4 to NOX). CCA1 (CIRCADIAN COLD ASSOCIATED 1), LHY (LATE ELONGATED HYPOCOTYL), RVE8 (REVEILLE 8), PRR (PSEUDO RESPONSE REGULATOR), ZTL (ZEITLUPE), TOC1 (TIMING OF CAB EXPRESSION1), GI (GIGANTEA), ELF (EARLY FLOWERING), LUX (LUX ARRHYTHMO), and NOX (NOX/BROTHER OF LUX ARRHYTHMO). The box around ELF3/4 and LUX indicates they work as an evening complex of proteins in Arabidopsis. B) Some effects of orthologues of Arabidopsis circadian oscillator components on yield-related phenotypes in crops. See Supplementary Table S1 from Steed et al. 2021 for references.

Similar articles

Cited by

References

    1. Abbas Q, Wilhelm M, Kuster B, Poppenberger B, Frishman D. Exploring crop genomes: assembly features, gene prediction accuracy, and implications for proteomics studies. BMC Genomics. 2024:25(1):619. 10.1186/s12864-024-10521-w - DOI - PMC - PubMed
    1. Alexandre Moraes T, Mengin V, Peixoto B, Encke B, Krohn N, Höhne M, Krause U, Stitt M. The circadian clock mutant lhy cca1 elf3 paces starch mobilization to dawn despite severely disrupted circadian clock function. Plant Physiol. 2022:189(4):2332–2356. 10.1093/plphys/kiac226 - DOI - PMC - PubMed
    1. Almario J, Fabianska I, Saridis G, Bucher M. Unearthing the plant-microbe quid pro quo in root associations with beneficial fungi. New Phytol. 2022:234(6):1967–1976. 10.1111/nph.18061 - DOI - PubMed
    1. Alonso JM, Stepanova AN, Leisse TJ, Kim CJ, Chen H, Shinn P, Stevenson DK, Zimmerman J, Barajas P, Cheuk R, et al. Genome-wide insertional mutagenesis of Arabidopsis thaliana. Science. 2003:301(5633):653–657. 10.1126/science.1086391 - DOI - PubMed
    1. Altpeter F, Springer NM, Bartley LE, Blechl AE, Brutnell TP, Citovsky V, Conrad LJ, Gelvin SB, Jackson DP, Kausch AP, et al. Advancing crop transformation in the era of genome editing. Plant Cell. 2016:28(7):1510–1520. 10.1105/tpc.16.00196 - DOI - PMC - PubMed

MeSH terms

LinkOut - more resources