. 2025 Jun 11;16(6):e0078325.
doi: 10.1128/mbio.00783-25. Epub 2025 May 15.

Tetrahymena ATG8 homologs, TtATG8A and TtATG8B, are responsible for mitochondrial degradation induced by starvation

Affiliations

Tetrahymena ATG8 homologs, TtATG8A and TtATG8B, are responsible for mitochondrial degradation induced by starvation

Shinya Matsuda et al. mBio. .

Abstract

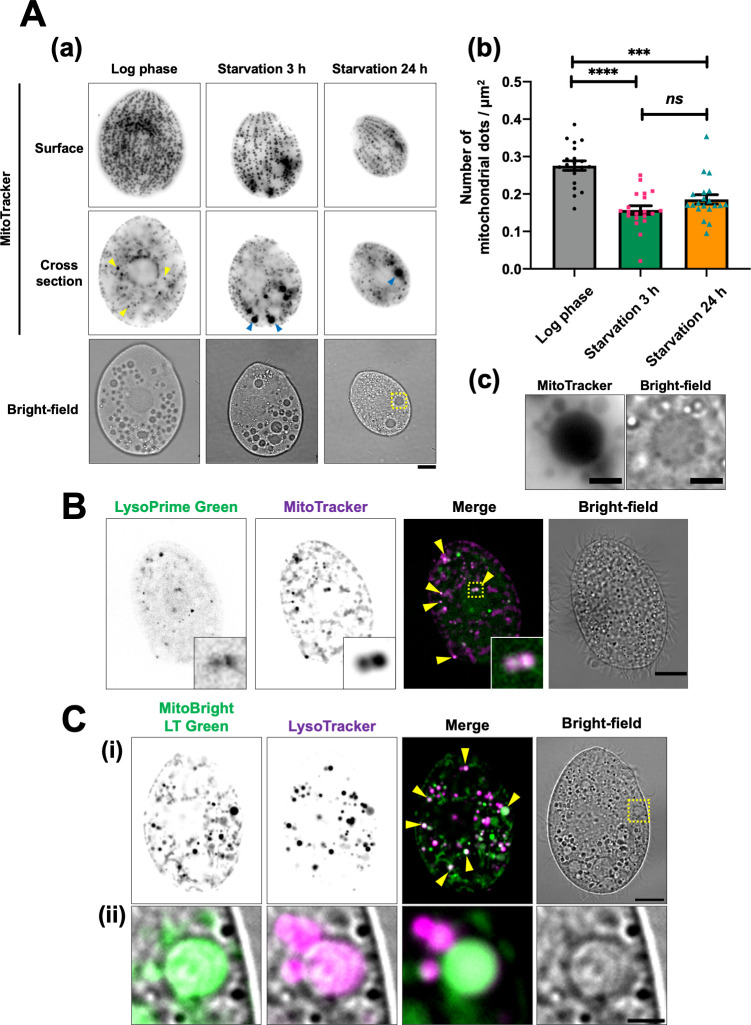
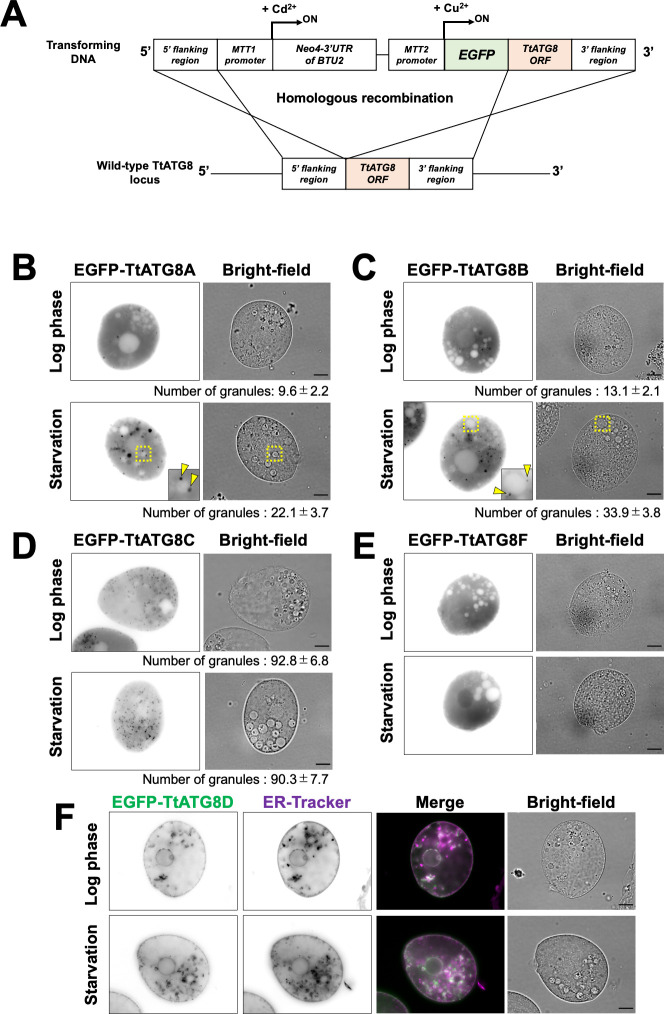
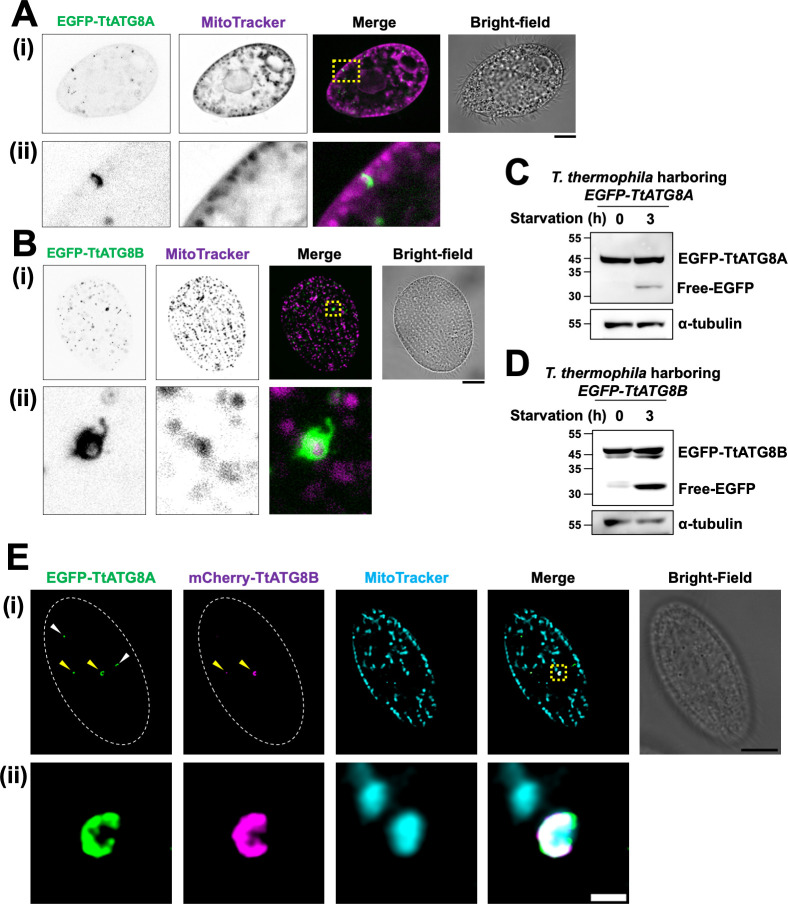
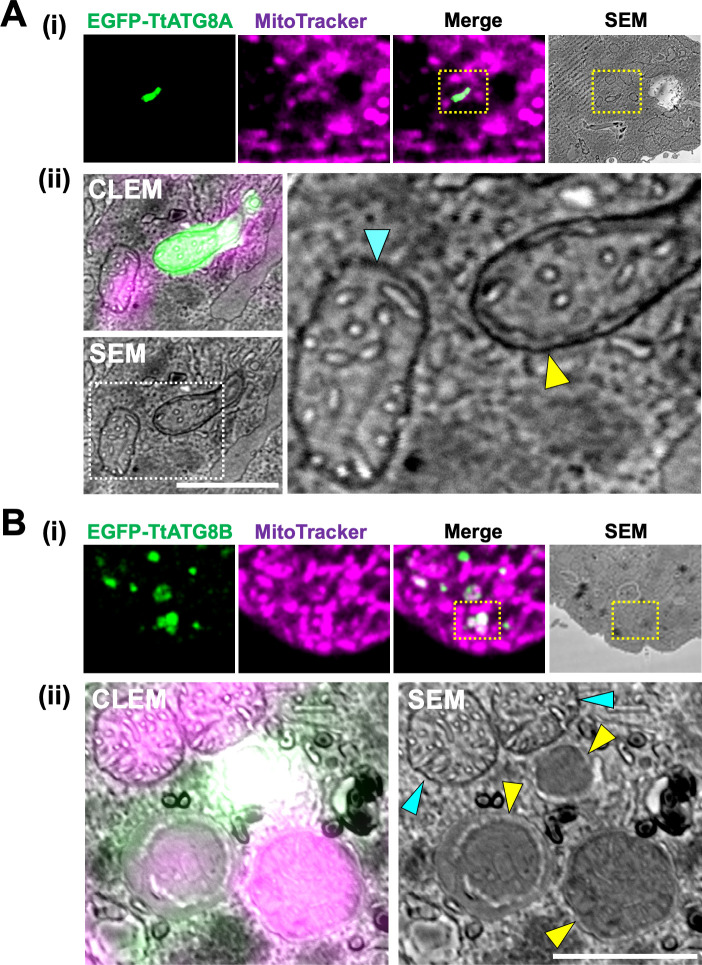
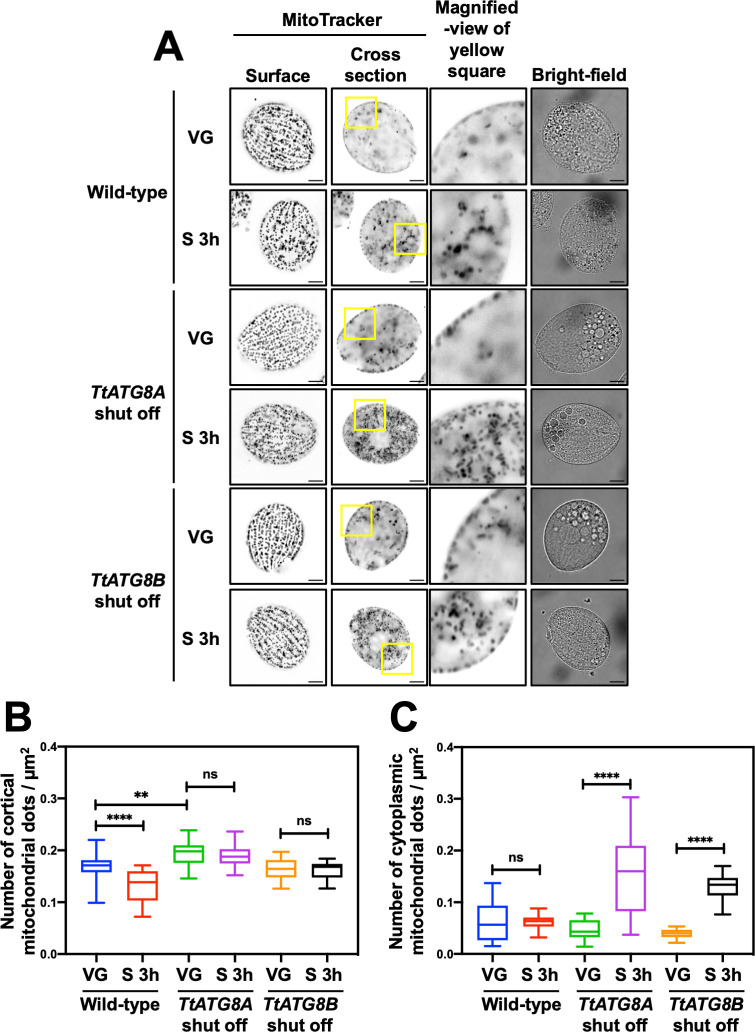
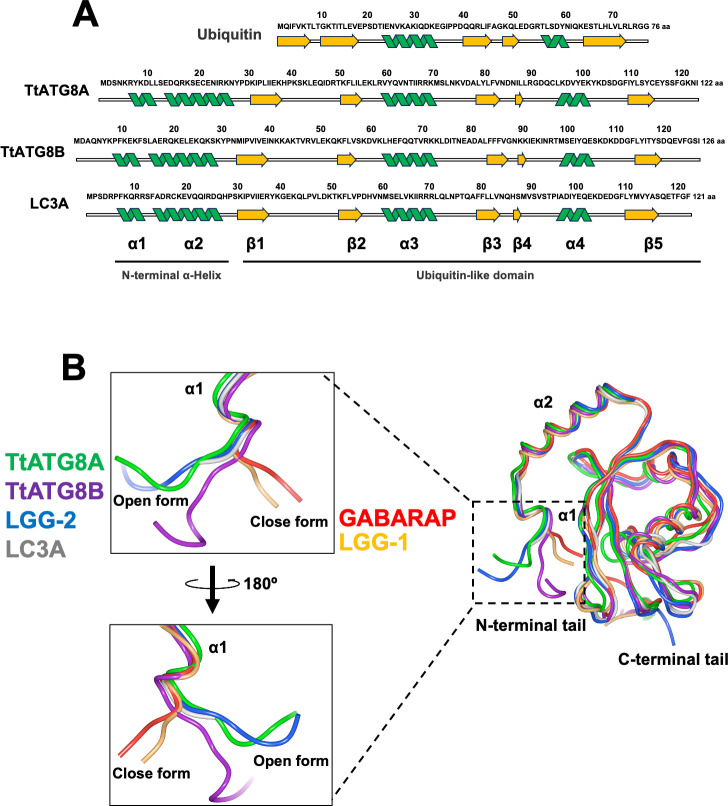
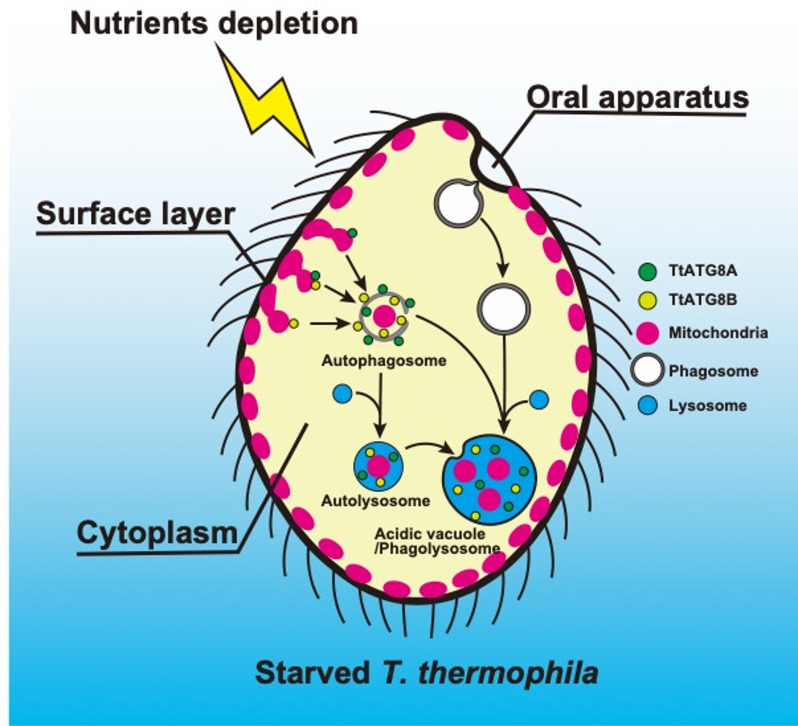
The majority of heterotrophic unicellular eukaryotes have evolved mechanisms to survive periods of starvation, allowing them to endure until conditions are favorable for regrowth. The ciliate Tetrahymena exhibits active swimming behavior in water, preying on microorganisms and growing exponentially at a rate of 0.5-0.75 h⁻¹ under optimal conditions. In this organism, numerous mitochondria localize to the cell cortex along the ciliary rows, likely ensuring an efficient ATP supply necessary for vigorous cell movement. Although mitochondrial reduction occurs immediately under starvation, the underlying mechanism remains unknown. Here, we demonstrated that autophagy is responsible for mitochondrial reduction in Tetrahymena thermophila. Among the five T. thermophila ATG8 homologs, TtATG8A and TtATG8B formed granule- and cup-shaped structures in response to starvation. Fluorescent microscopy further showed that TtATG8A and TtATG8B associate with mitochondria. Moreover, correlative light and electron microscopy analysis revealed that mitochondria colocalized with TtATG8A or TtATG8B were engulfed by autophagosomes and displayed abnormal appearances with disrupted cristae structures. Additionally, repression of TtATG8A or TtATG8B expression significantly attenuated starvation-induced mitochondrial reduction. These findings suggest that TtATG8A- and TtATG8B-mediated autophagy is a key mechanism underlying mitochondrial reduction in starved T. thermophila.

Importance: This study is the first comprehensive description of the mitochondrial degradation process under nutrient starvation in the ciliate Tetrahymena. It is well known that the cell surface structure of ciliates consists of an elaborate spatial arrangement of microtubule networks and associated structures and that this surface repetitive pattern is inherited by the next generation of cells like genetic information. Our findings provide a basis for understanding how ciliates maintain an adequate amount of mitochondria on the cell surface in response to nutritional conditions. Furthermore, we have successfully demonstrated the usefulness of Tetrahymena as an experimental system for studying mitochondrial quality control and turnover. Further studies of Tetrahymena will facilitate comparative studies among diverse biological systems on how eukaryotes other than opisthokonta (yeast, cultured cells, etc.) control their mitochondria.

Keywords: ATG8; Tetrahymena; autophagy; mitochondria.


Conflict of interest statement

The authors declare no conflict of interest.

Figures

Fig 1
Fig 1
Cortical mitochondria are reduced in starved cells, likely due to their association with digestive organelles such as lysosomes and vacuoles. (A) T. thermophila wild-type cells were cultured in super proteose peptone medium until they reached log phase and then transferred to 10 mM Tris-HCl (pH 7.5) for starvation. The cells were stained with 200 nM MitoTracker Red CMXRos for at least 30 min. Fluorescent images were captured using an Olympus BX51 microscope. Due to the frequent movement of vacuoles within living cells, the fluorescent and bright-field images may not always align precisely. Scale bars: 10 µm (a). The number of mitochondrial dots and cell area (µm2) were quantified using Image J software. Results are presented as the mean ± s.e.m (n = 20 cells). One-way analysis of variance followed by Tukey’s multiple comparison test was used, with ***P < 0.001, ****P < 0.0001, and ns indicating not significant (b). (c) A magnified view of the yellow dotted square in panel a. Scale bar: 3 µm. (B) Two-hour starved wild-type cells were stained with LysoPrime Green (green) and MitoTracker Red CMXRos (magenta) for 1 h. The stained cells were fixed with 2% paraformaldehyde, and fluorescence images were obtained using a Thunder imaging system. Yellow arrowheads indicate colocalization of mitochondria and lysosomes. The bottom right inset shows a magnified view of the yellow dotted square. (C) After 2 h of starvation, wild-type cells were simultaneously stained with MitoBright LT Green (green) and LysoTracker Red DND-99 (magenta) for at least 30 min. Fluorescent images were captured using a Thunder imaging system. Yellow arrowheads indicate colocalization of mitochondria and LysoTracker. The bottom panel (ii) shows a magnified view of the yellow dotted square in the upper panel (i). Each fluorescence image is merged with a bright-field image. Scale bars: 10 µm (i) and 2 µm (ii).
Fig 2
Fig 2
Localization pattern of EGFP-TtATG8s during starvation. (A) Illustration of homologous recombination at the TtATG8s gene locus. (B through F) Cells expressing the indicated EGFP-TtATG8 constructs were cultured in Super Proteose Peptone medium containing 1.5 mM CuSO4 for 4–8 h. Log phase or 3 h-starved cells were observed using an Olympus BX51 microscope. The fluorescence images were focused on cross-sections of the cells. The number of EGFP-TtATG8 granules is shown below each panel. Results are presented as the mean ± s.e.m (n = 10 cells). Statistical significance was determined using Welch’s t-test (unequal variance assumed). P-values: log phase vs starvation in panel B, P = 0.0107; log phase vs starvation in panel C, P = 0.0003. In panel F, cells were stained with ER-Tracker 1 h prior to observation. Green indicates EGFP-TtATG8D, and magenta indicates ER-Tracker. Scale bars: 10 µm.
Fig 3
Fig 3
TtATG8A and TtATG8B in contact with mitochondria. (A–D) T. thermophila strains expressing EGFP-TtATG8A or EGFP-TtATG8B strains were grown in Super Proteose Peptone with 1.5 mM CuSO4, starved for 2 h, and then stained with 200 nM MitoTracker Red CMXRos for 1 h. The cells were fixed with 2% paraformaldehyde, and fluorescence images were captured using deconvolution microscopy with the Thunder Imaging System. The bottom panel (ii) provides a magnified view of the yellow dotted square from the upper panel (i). Green: EGFP-TtATG8A; magenta: MitoTracker. Scale bar: 10 µm (A and B). The fluorescence images were focused on cross-sections of the cells (A) or cell surface (B), respectively. Western blot analysis of cell lysates using anti-GFP and anti-α-tubulin antibodies is shown in panels C and D. α-tubulin was used as a protein loading control. (E) T. thermophila strains expressing EGFP-TtATG8A and mCherry-TtATG8B strains were cultured in super proteose peptone with 1.5 mM CuSO4, starved for 2 h, and then stained with 200 nM MitoTracker DeepRed for 1 h. The cells were fixed with 2% paraformaldehyde, and fluorescence images were obtained using a TCS SP8 confocal microscope. Green: EGFP-TtATG8A; magenta: mCherry-TtATG8B, and cyan: MitoTracker. The bottom panel (ii) shows a magnified view of the yellow dotted square from upper panel (i). Scale bars: 10 µm (i) and 1 µm (ii).
Fig 4
Fig 4
CLEM analysis of TtATG8A and TtATG8B. (A and B) Fluorescence, SEM, and CLEM images of T. thermophila expressing EGFP-TtATG8A (A) and EGFP-TtATG8B (B) after 3 h of starvation. The bottom panel (ii) shows a magnified view of the yellow dotted square from the upper panel (i). (A-ii) The right panel provides a magnified view of the white dotted square from the SEM image. Blue arrowheads indicate the outer membrane of mitochondria. Yellow arrowheads indicate autophagosome-like membranes. Scale bars: 1 µm.
Fig 5
Fig 5
Shutoff of TtATG8A and TtATG8B suppresses mitochondrial degradation after starvation. (A) T. thermophila cells, where TtATG8A or TtATG8B genes on the macronuclear chromosomes were almost completely replaced with the corresponding EGFP-TtATG8 cassette (see Fig. 2A), were cultured in Super Proteose Peptone without CuSO4. Vegetative growth cells (VG) or 3 h-starved cells (S 3 h) were stained with 200 nM MitoTracker Red CMXRos. Fluorescent images were captured using a Thunder imaging system with deconvolution fluorescence microscopy. Scale bars: 10 µm. (B and C) The number of cortical or cytoplasmic mitochondrial dots and cell area (µm2) were quantified using Image J software. Results are presented as box-and-whisker plots showing the median, interquartile range, and minimum/maximum values (n = 20 cells). One-way analysis of variance followed by Tukey’s multiple comparison test was used, with **P < 0.01, ****P < 0.0001, and ns indicating not significant.
Fig 6
Fig 6
Structural comparison of ATG8 homologs. (A) Alignment of the secondary structures of ubiquitin (PDB:1UBI), TtATG8A (AlphaFoldDB: AF-I7LUK8-F1), TtATG8B (AlphaFoldDB: AF-Q22M73-F1), and LC3A (PDB:3WAL). (B) Tertiary structures of TtATG8A (AlphaFoldDB: AF-I7LUK8-F1), TtATG8B (AlphaFoldDB: AF-Q22M73-F1), LC3A (PDB:3WAL), GABARAP (PDB:1GNU), LGG-1 (PDB:5AZF), and LGG-2 (PDB:5AZH). The protein structures were visualized using Waals software (Altif Laboratories). Green: TtATG8A; purple: TtATG8B; blue: LGG-2; gray: LC3A; red: GABARAP; and yellow: LGG-1.
Fig 7
Fig 7
Schematic diagram of mitochondrial degradation by two ATG8 homologs in starved T. thermophila. In response to nutrient depletion, TtATG8A and TtATG8B interact with mitochondria, leading to the formation of autophagosomes. These autophagosomes then fuse with lysosomes to form autolysosomes, where the mitochondria associated with TtATG8A or TtATG8B are eventually degraded. Based on previous reports of mitochondrial remnants accumulating within vacuoles (4, 7, 8) and fluorescence microscopy observations (see Fig. 1; Fig. S1B), some autophagosomes containing mitochondria are also transported to acidic vacuoles (phagolysosomes). As a prelude to autophagic degradation, cortical mitochondria under starvation conditions may relocalize to the cytoplasm. Further details are discussed in the text.

Similar articles

References

    1. Kiel JAKW. 2010. Autophagy in unicellular eukaryotes. Phil Trans R Soc B 365:819–830. doi: 10.1098/rstb.2009.0237 - DOI - PMC - PubMed
    1. Kourtis N, Tavernarakis N. 2009. Autophagy and cell death in model organisms. Cell Death Differ 16:21–30. doi: 10.1038/cdd.2008.120 - DOI - PubMed
    1. Cole E, Gaertig J. 2022. Anterior-posterior pattern formation in ciliates. J Eukaryot Microbiol 69:e12890. doi: 10.1111/jeu.12890 - DOI - PMC - PubMed
    1. Aufderheide K. 1979. Mitochondrial associations with specific microtubular components of the cortex of Tetrahymena thermophila. I. Cortical patterning of mitochondria. J Cell Sci 39:299–312. doi: 10.1242/jcs.39.1.299 - DOI - PubMed
    1. Nelsen EM. 1978. Transformation in Tetrahymena thermophila. development of an inducible phenotype. Dev Biol 66:17–31. doi: 10.1016/0012-1606(78)90270-1 - DOI - PubMed

MeSH terms

Substances

LinkOut - more resources