. 2025 Jun 16;85(12):2179-2198.
doi: 10.1158/0008-5472.CAN-23-2654.

Targeting the Dependence on PIK3C3-mTORC1 Signaling in Dormancy-Prone Breast Cancer Cells Blunts Metastasis Initiation

Affiliations

Targeting the Dependence on PIK3C3-mTORC1 Signaling in Dormancy-Prone Breast Cancer Cells Blunts Metastasis Initiation

Islam E Elkholi et al. Cancer Res. .

Abstract

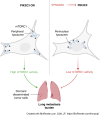
Halting breast cancer metastatic relapse following primary tumor removal remains challenging due to a lack of specific vulnerabilities to target during the clinical dormancy phase. To identify such vulnerabilities, we conducted genome-wide CRISPR screens on two breast cancer cell lines with distinct dormancy properties: 4T1 (short-term dormancy) and 4T07 (prolonged dormancy). The dormancy-prone 4T07 cells displayed a unique dependency on class III PI3K (PIK3C3). Unexpectedly, 4T07 cells exhibited higher mechanistic target of rapamycin complex 1 (mTORC1) activity than 4T1 cells due to lysosome-dependent signaling occurring at the cell periphery. Pharmacologic inhibition of PIK3C3 suppressed this phenotype in the 4T1-4T07 models as well as in human breast cancer cell lines and a breast cancer patient-derived xenograft. Furthermore, inhibiting PIK3C3 selectively reduced metastasis burden in the 4T07 model and eliminated dormant cells in a HER2-dependent murine breast cancer dormancy model. These findings suggest that PIK3C3-peripheral lysosomal signaling to mTORC1 may represent a targetable axis for preventing dormant cancer cell-initiated metastasis in patients with breast cancer.

Significance: Dormancy-prone breast cancer cells depend on the class III PI3K to mediate peripheral lysosomal positioning and mTORC1 hyperactivity, which can be targeted to blunt breast cancer metastasis.


Conflict of interest statement

C.L. Kleinman reports grants from the Canadian Institutes of Health Research and other support from the Fonds de Recherche du Québec - Santé during the conduct of the study. A.P. Gomes reports other support from MetroBiotech outside the submitted work. J.A. Aguirre-Ghiso reports personal fees from the Samuel Waxman Cancer Research Foundation and Astrin Biosciences and nonfinancial support from HiberCell LLC outside the submitted work and has a patent for WO2019191115A1/EP-3775171-B1 issued. No disclosures were reported by the other authors.

Figures
None
Graphical abstract
Figure 1.
Figure 1.
Genome-wide knockout CRISPR screens define the common and differential fitness genes in the 4T1 and 4T07 cells. A, Schematic outline for the performed screens’ pipeline. B, Enumeration of the revealed cell line–specific and common (core) fitness genes. C, Ranked differential gene fitness score between the 4T1 and 4T07 cells. A value >0 denotes a 4T1-specific fitness gene; a value <0 denotes a 4T07-specific fitness gene. D, Schematic representation integrating the 4T1-specific fitness genes (green) and proliferation suppressor genes (positively selected genes; gray) in the canonical PI3K-AKT pathway. E and F, Gene set enrichment analysis comparing the enrichment of genes previously found to be induced by AKT upregulation (E) or PTEN downregulation in the two cell lines (F). NES, normalized enrichment scale.
Figure 2.
Figure 2.
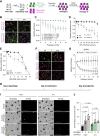
Pik3ca and Pik3c3 are differential fitness genes for the 4T1 and 4T07 cells. A, Schematic representation of the two-color competition assay. B, Representative images showing 4T1 cells expressing either Pik3ca-gRNA or Rosa26-gRNA (both in green) cocultured independently with 4T1 cells expressing Rosa26-gRNA (magenta) at passages zero (P0) and 10 (P10). Scale bar, 100 μm. C, Graph showing the representation of the green 4T1 cell populations over serial passages in reference to P0. P values indicate the difference between the control condition and experimental conditions at P10. D, Proliferation assay comparing the 4T1-4T07 cells’ response to BYL719. E, Proliferation assay comparing the 4T1-4T07 cells’ response to MK-2206. F, Representative images showing 4T07 cells expressing Pik3c3-gRNA, Pik3r4-gRNA, or Rosa26-gRNA (all in green) cocultured independently with cells expressing Rosa26-gRNA (magenta) at passages zero (P0) and 10 (P10). Scale bar, 100 μm. G, Graph showing the representation of the green 4T07 cell populations over serial passages in reference to P0. P values indicate the difference between the control condition and experimental conditions at P10. H, Schematic for the timeline of assessing the effect of VPS34IN1 on the 4T07 and 4T1 cells’ survival in I and J. The 4T07 and 4T1 cells were seeded and cultured on BME, in which they form spheroids, and were then treated with VPS34IN1 or DMSO. I, Representative images of 4T07 and 4T1 3D spheroids at the experimental endpoint after treatment with either the vehicle (DMSO) or VPS34IN1 at 5 and 10 μmol/L. J, Quantifications of cell death burden as indicated by positive staining for SYTOX.
Figure 3.
Figure 3.
mTORC1 is more active in 4T07 cells compared with 4T1 cells. A and B, Western blot analysis for the PI3K–AKT–mTORC1 pathway readouts in the 4T1-4T07 cells upon treatment with BYL719 (A) or MK-2206 (B). C, Quantification of the relative PI3K and mTORC1 activity in the two cell lines from the performed Western blots in A and B. D, OncoPrints for somatic alterations in genes involved in the PI3K–AKT–mTOR pathway in 4T1 and 4T07 cells. E, Western blot analysis assessing mTORC1 activity in the 4T1-4T07 cells under different nutritional conditions. AA, amino acids.
Figure 4.
Figure 4.
Differential lysosomal positioning between the 4T1 and 4T07 cells. A and B, Immunostaining for the lysosomal marker Lamp1 and mTORC1 markers Rptor and pMtor (S2448) in the 4T1-4T07 cells under basal culture conditions, amino acid starvation, or amino acid refeeding. C, Quantification of the mean fluorescence intensity of mTORC1 (pMtor signal) on the lysosomes in the two cell lines under the three different conditions. D, Graph representing the percentage of peripheral lysosomes in the two cell lines under the three different conditions. ∗∗∗∗, P < 0.0001.
Figure 5.
Figure 5.
PIK3C3 mediates peripheral lysosomal positioning and mTORC1 activity in murine and human breast cancer cells. A, Western blot analysis for the VPS34IN1 (1 μmol/L) effect on 4T07 and 4T1 cells’ mTORC1 activity. B, Quantification of mTORC1 activity in A. C, Immunostaining for Lamp1 and pMtor in 4T07 and 4T1 cells under the effect of VPS34IN1 (1 μmol/L for 2 hours). D, Quantifications of the percentage of peripheral lysosomes in the VPS34IN1-treated cells in comparison with the control condition (DMSO-treated). E, Immunostaining for LAMP2 and pmTOR in the PDX-1915 cells under the effect of VPS34IN1 (2 μmol/L) or DMSO for 2 hours. ns, nonsignificant. F, Quantifications of the percentage of peripheral lysosomes in E. G, Quantifications of the percentage of tubulated lysosomes in E. H, Immunostaining for LAMP2 and pmTOR in the CAMA-1 cells under the effect of VPS34IN1 (2 μmol/L) or DMSO for 2 hours. I, Quantification of the percentage of peripheral lysosomes in H. J, Immunostaining for LAMP2 and pmTOR in the T47D cells under the effect of VPS34IN1 (2 μmol/L) or DMSO for 2 hours. K, Quantification of the percentage of peripheral lysosomes in J. L, Immunostaining for LAMP2 and pmTOR in the HCC70 cells under the effect of VPS34IN1 (2 μmol/L) or DMSO for 2 hours. M, Quantification of the percentage of peripheral lysosomes in L.
Figure 6.
Figure 6.
High mTORC1 or PIK3C3 activity correlates with worse outcomes in patients with breast cancer. A, Heatmaps showing gene set variation analysis ranked by the Hallmark_mTORC1_Signaling signature score. Breast cancer (BC) samples were stratified according to their intrinsic molecular subtype based on gene expression profiling. B, Comparison of different breast cancer subtypes according to the Hallmark_mTORC1_Signaling signature score in the METABRIC and TCGA datasets. C, Kaplan–Meier curves of disease-free survival and progression-free interval from the METABRIC and TCGA datasets, respectively. D, Comparison of different breast cancer subtypes according to the PIK3C3 signature score in the METABRIC and TCGA datasets. E, Kaplan–Meier curves of relapse- and progression-free survival from the METABRIC and TCGA datasets, respectively. PFS, progression-free survival; RFS, relapse-free survival. , P < 0.05; ∗∗∗, P = 0.0003; ∗∗∗∗, P < 0.0001.
Figure 7.
Figure 7.
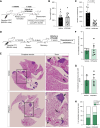
Inhibiting the Pik3c3-mTORC1 axis decreases the metastatic burden in vivo preferentially in the 4T07 model. A, Schematic of the experiment investigating the effect of Pik3c3 inhibition on the metastatic burden in the 4T07 model. B, Graph showing tumor weight of mice treated with either VPS34IN1 (50 mg/kg/day) or vehicle. C, Graph showing the number of colonies retrieved from the lungs of mice treated with either VPS34IN1 (50 mg/kg/day) or vehicle. D, Schematic of the experiment investigating the effect of Pik3c3 inhibition on the metastatic burden in 4T1 tumor–bearing BALB/c mice. E, Representative hematoxylin and eosin stainings of lungs obtained from mice in D. Black arrows, metastatic lesions. F–H, Quantifications of the metastatic burden: absolute number of lesions (F), number of lesions normalized to lung area (G), and percentage of different sizes of metastases (H) in the vehicle- and VPS34IN1-treated mice (50 mg/kg/day).
Figure 8.
Figure 8.
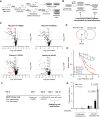
Pik3c3 is a therapeutic vulnerability of dormant cancer cells in a HER2 breast cancer model. A, Schematic for the MMTV-rtTA;TetO-Her2 and the origin of the primary and recurrent lines. doub, population doubling; dox, doxycycline; T0, reference time point; T-End, endpoint. B, Schematic for the CRISPR screen performed in the primary and recurrent MMTV-rtTA;TetO-Her2 cells. C, Graphs demonstrating the identification of Pik3c3 as a recurrent cell-specific fitness gene, as defined by the FDR and fold change of its gRNA(s) in the screens’ endpoint in reference to T0 (see Supplementary Methods for details). D, Venn diagram highlighting the number of identified recurrent cell-exclusive fitness genes. E, Cell viability assay comparing the sensitivity of primary and recurrent MMTV-rtTA;TetO-Her2 cells to VPS34IN1. AUC was quantified for each line and all lines’ sensitivity to VPS34IN1 was statistically different. F, Schematic for a cell death assay investigating the effect of VPS34IN1 (10 μmol/L) on the 54074 primary cells either during proliferation (in prescence of doxycycline) or dormancy (cells deprived of doxycycline). G, Quantifications of the percentage of dead 54074 cells after 24 and 48 hours treatment with VPS34IN1.

Update of

References

    1. McKenzie HS, Maishman T, Simmonds P, Durcan L, Eccles D; POSH Steering Group . Survival and disease characteristics of de novo versus recurrent metastatic breast cancer in a cohort of young patients. Br J Cancer 2020;122:1618–29. - PMC - PubMed
    1. Kennecke H, Yerushalmi R, Woods R, Cheang MC, Voduc D, Speers CH, et al. Metastatic behavior of breast cancer subtypes. J Clin Oncol 2010;28:3271–7. - PubMed
    1. Karrison TG, Ferguson DJ, Meier P. Dormancy of mammary carcinoma after mastectomy. J Natl Cancer Inst 1999;91:80–5. - PubMed
    1. Risson E, Nobre AR, Maguer-Satta V, Aguirre-Ghiso JA. The current paradigm and challenges ahead for the dormancy of disseminated tumor cells. Nat Cancer 2020;1:672–80. - PMC - PubMed
    1. Carlson P, Dasgupta A, Grzelak CA, Kim J, Barrett A, Coleman IM, et al. Targeting the perivascular niche sensitizes disseminated tumour cells to chemotherapy. Nat Cell Biol 2019;21:238–50. - PMC - PubMed

MeSH terms

Substances