. 2025 May 31;39(10):e70632.
doi: 10.1096/fj.202402808RR.

Intrinsically Disordered Regions Define Unique Protein Interaction Networks in CHD Family Remodelers

Affiliations

Intrinsically Disordered Regions Define Unique Protein Interaction Networks in CHD Family Remodelers

Mehdi Sharifi Tabar et al. FASEB J. .

Abstract

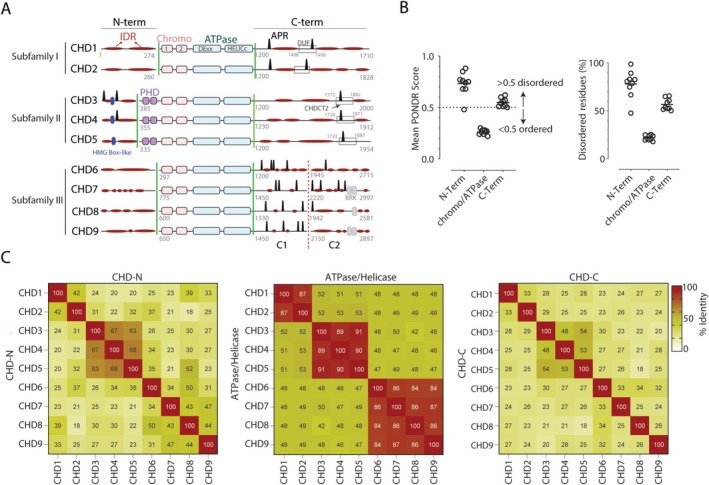
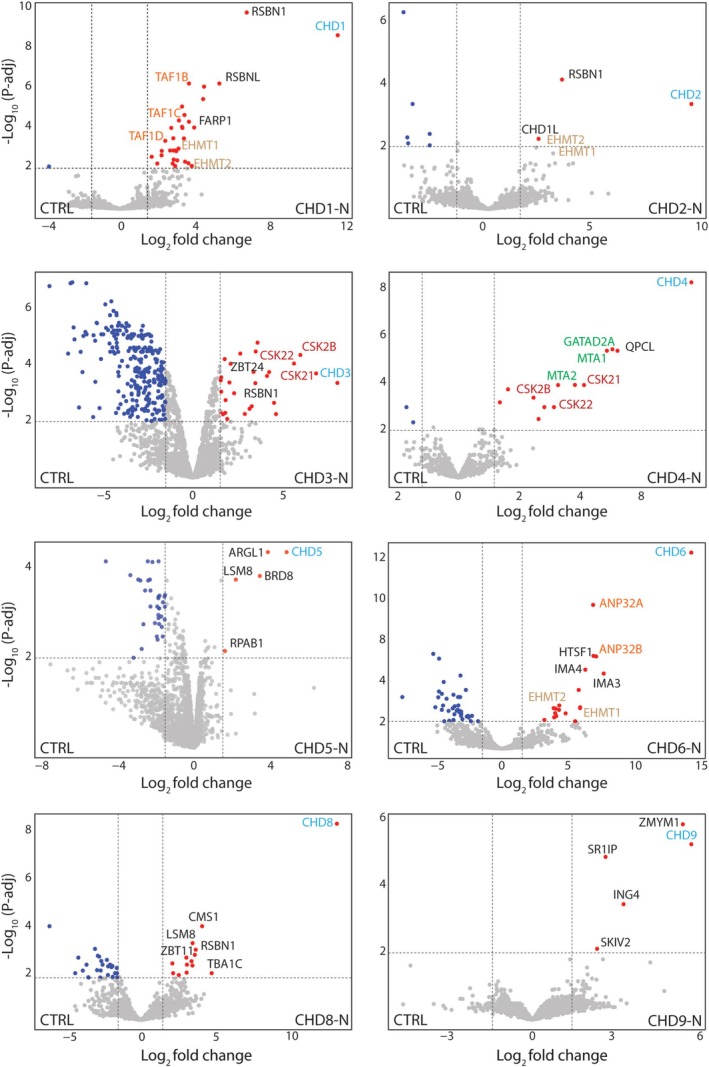
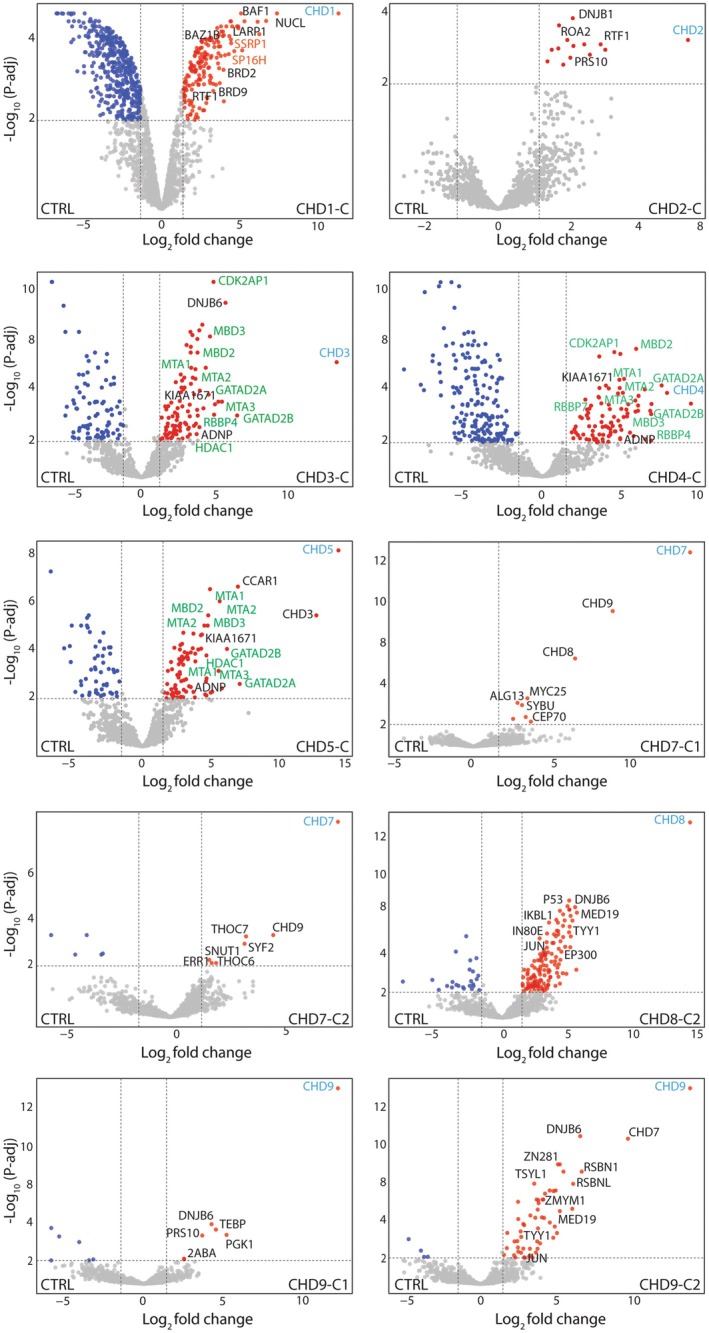
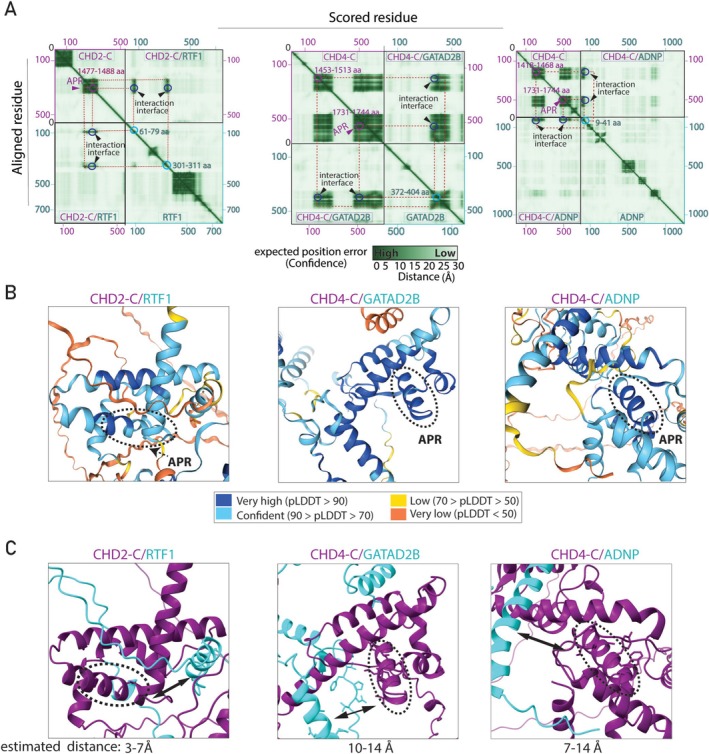
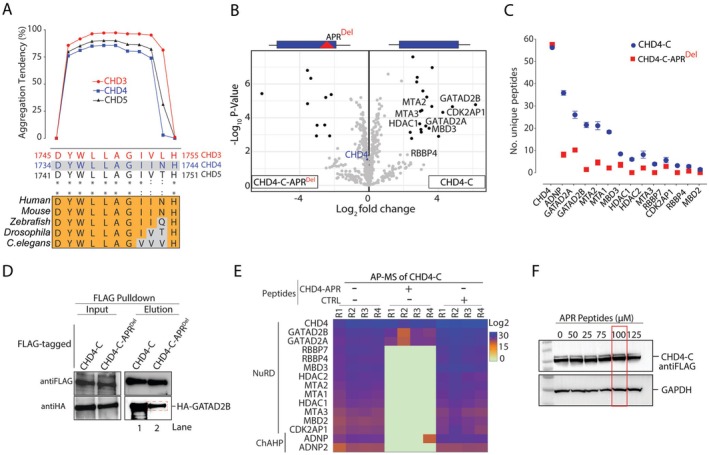
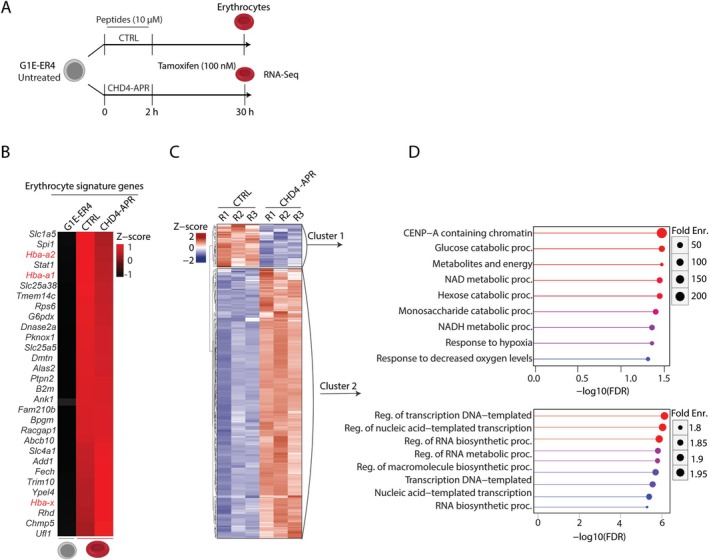
Chromodomain helicase DNA-binding (CHD) enzymes play a pivotal role in genome regulation. They possess highly conserved ATPase domains flanked by poorly characterized and intrinsically disordered N- and C-termini. Using mass spectrometry, we identify dozens of novel protein-protein interactions (PPIs) within the N- and C-termini of human CHD family members. We also define a highly conserved aggregation-prone region (APR) within the C-terminus of CHD4 which is critical for its interaction with the nucleosome remodeling and deacetylase (NuRD), as well as ChAHP (CHD4, activity-dependent neuroprotective protein (ADNP), and HP1γ) complexes. Further analysis reveals a regulatory role for the CHD4 APR in gene transcription during erythrocyte formation. Our results highlight that the N- and C-termini of CHD chromatin remodelers shape protein interaction networks that drive unique transcriptional programs.

Keywords: DNA helicase; aggregation‐prone regions; chromatin remodelers; intrinsically disordered regions; protein–protein interactions; transcription.


Conflict of interest statement

The authors declare no conflicts of interest.

Figures

FIGURE 1
FIGURE 1
Human CHD family members exhibit both unique and shared structural characteristics. (A) Representation of the domain organization of CHD proteins, highlighting the distribution of aggregation‐prone regions (APRs, black peaks) and intrinsically disordered regions (IDRs, flat red ovals) within the N‐ and C‐termini. The domain of unknown function (DUF) and CHD C‐terminal 2 (CHDCT2) domains, which contain APR regions within the C‐termini, are represented by rectangles. Green lines denote boundaries for N‐ and C‐terminal segments used in AP‐MS analysis. The C1 and C2 segments, separated by a dotted red line, denote further truncated CHD6‐9 C‐termini. Numbers in gray refer to amino acid positions. Blue and gray ovals represent high mobility group (HMG) Box‐like and Brahma and Kismet (BRK) domains, respectively. (B) The graphs illustrate the mean PONDR score and the proportion of disordered residues (%) of the N‐terminal, ATPase, and C‐terminal domains of all CHD proteins. (C) Heatmap matrices represent Pearson correlation analysis within and between CHD subfamily domains.
FIGURE 2
FIGURE 2
The protein interaction landscape of CHD N‐termini. Volcano plots representing affinity purification of CHDs N‐termini using FLAG antibody‐conjugated beads followed by label‐free mass spectrometry analysis (n = 3). CHD bait proteins are labeled in cyan, while significantly co‐enriched proteins are represented by red dots. Co‐enriched proteins associated with gene ontology terms related to chromatin and gene transcription were manually selected and labeled on the graphs. Proteins that are part of multi‐subunit complexes are represented with the same color; NuRD subunits are represented in green in the CHD4‐N panel. Significance was determined as log2 (fold change) > 1.5, −log10 (p‐adj) > 2; gray dots indicate proteins which were not significantly enriched.
FIGURE 3
FIGURE 3
The protein interaction landscape of CHD C‐termini. Volcano plots representing affinity purification of CHDs C‐termini using FLAG antibody‐conjugated beads followed by label‐free mass spectrometry analysis (n = 3). CHD bait proteins are labeled in cyan, while significantly co‐enriched proteins are represented by red dots. Co‐enriched proteins associated with gene ontology terms related to chromatin and gene transcription were manually selected and labeled on the graphs. Proteins that are part of multi‐subunit complexes are represented with the same color; NuRD subunits are represented in green in the CHD3‐5C panels. Significance was determined as log2 (fold change) > 1.5, −log10 (p‐adj) > 2; gray dots indicate proteins which were not significantly enriched.
FIGURE 4
FIGURE 4
AlphaFold validation of CHD protein interactions discovered by AP‐MS. (A) Heatmaps represent the Predicted Aligned Error (PAE) score between all pairs of residues. A dark green color indicates a low PAE, signifying high reliability of the relative position of the residues. Conversely, lighter shades denote lower confidence in the positioning. Potential interaction interfaces are indicated by arrowheads. Potential interacting residues within each polypeptide are indicated in the same color as the protein label. (B) Predicted 3D structure of the identified complexes. The predicted local distance difference tool (pLDDT) score represents the confidence of the predicted structure. APRs form alpha helical structures with high pLDDT scores (highlighted with dotted circles in B and C). (C) Estimated contact distances between APRs (purple) and interacting proteins (cyan): Left, between CHD2‐C and RTF1; middle, between CHD4‐C and GATAD2B; right, between CHD4‐C and ADNP. Double‐headed arrows in (C) indicate the estimated distance between the two polypeptides.
FIGURE 5
FIGURE 5
The C‐terminus of CHD4 protein harbors an APR that directly interacts with the NuRD and ChAHP complexes. (A) TANGO analysis shows β‐sheet aggregation tendency for the conserved APR within CHD3, CHD4, and CHD5. Corresponding APR residues are shown with homology within CHD3‐5 subfamily and between CHD4 orthologues. (B, C) AP‐MS for interactors of CHD4‐C and CHD4‐C‐APRDel showing: (B) volcano plots of enriched proteins; and (C) the number of unique peptides of subunits of the NuRD and ChAHP complexes detected. (D) Western blots of input and elution samples from FLAG‐CHD4‐C co‐expressed with HA‐GATAD2B protein using an in vitro transcription/translation system; samples were probed with anti‐HA and anti‐FLAG antibodies. (E) Cellular lysate expressing FLAG‐CHD4‐C incubated in the presence of CHD4‐APR or CTRL peptides (100 μM) before subsequent AP‐MS. The heatmap represents intensity of detected peptides for CHD4‐C‐NuRD and ‐ChAHP complex subunits. (F) Western blots confirming consistent detection of FLAG‐CHD4‐C protein after addition of APR peptidomimetics (0–125 μM) to the cell lysates. Red box indicates the concentration used in (E).
FIGURE 6
FIGURE 6
CHD4 dissociation from the NuRD and ChAHP complexes can lead to gene dysregulation. (A) Schematic illustrating the experimental procedure and sample collection timepoints. G1E‐ER4 cells were treated with either CHD4‐APR or CTRL peptides for 2 h and then tamoxifen was added, and samples were collected after 28 h (total 30 h). Erythrocytes were subjected to RNA‐Seq analysis. (B) Heatmap representing the upregulation of the erythrocytic signature genes in the presence of tamoxifen (top 30 genes are represented) and globin genes are highlighted in red. RNA‐Seq data of untreated G1E‐ER4 cells was obtained from ENCODE (GSE101195). The columns represent the mean of combined normalized expression from three replicates. (C) Z‐score heatmap representing the pattern of differentially expressed genes in CHD4‐APR versus CTRL peptides. (D) Gene ontology analysis indicating biological processes significantly associated with the differentially expressed genes.

Similar articles

Cited by

References

    1. Bednar J., Horowitz R. A., Grigoryev S. A., et al., “Nucleosomes, Linker DNA, and Linker Histone Form a Unique Structural Motif That Directs the Higher‐Order Folding and Compaction of Chromatin,” Proceedings of the National Academy of Sciences of the United States of America 95 (1998): 14173–14178. - PMC - PubMed
    1. Lai W. K. M. and Pugh B. F., “Understanding Nucleosome Dynamics and Their Links to Gene Expression and DNA Replication,” Nature Reviews. Molecular Cell Biology 18 (2017): 548–562. - PMC - PubMed
    1. Saha A., Wittmeyer J., and Cairns B. R., “Chromatin Remodelling: The Industrial Revolution of DNA Around Histones,” Nature Reviews. Molecular Cell Biology 7 (2006): 437–447. - PubMed
    1. Clapier C. R., Iwasa J., Cairns B. R., and Peterson C. L., “Mechanisms of Action and Regulation of ATP‐Dependent Chromatin‐Remodelling Complexes,” Nature Reviews. Molecular Cell Biology 18 (2017): 407–422. - PMC - PubMed
    1. Farnung L., Ochmann M., and Cramer P., “Nucleosome‐CHD4 Chromatin Remodeler Structure Maps Human Disease Mutations,” eLife 9 (2020): e56178. - PMC - PubMed

MeSH terms

Substances

LinkOut - more resources