. 2025 Aug;10(8):101256.
doi: 10.1016/j.jacbts.2025.02.015. Epub 2025 May 14.

SLAMF7 Restrains Pro-Inflammatory Macrophage Activation to Counteract Doxorubicin-Induced Cardiotoxicity

Affiliations

SLAMF7 Restrains Pro-Inflammatory Macrophage Activation to Counteract Doxorubicin-Induced Cardiotoxicity

Ao Liu et al. JACC Basic Transl Sci. 2025 Aug.

Abstract

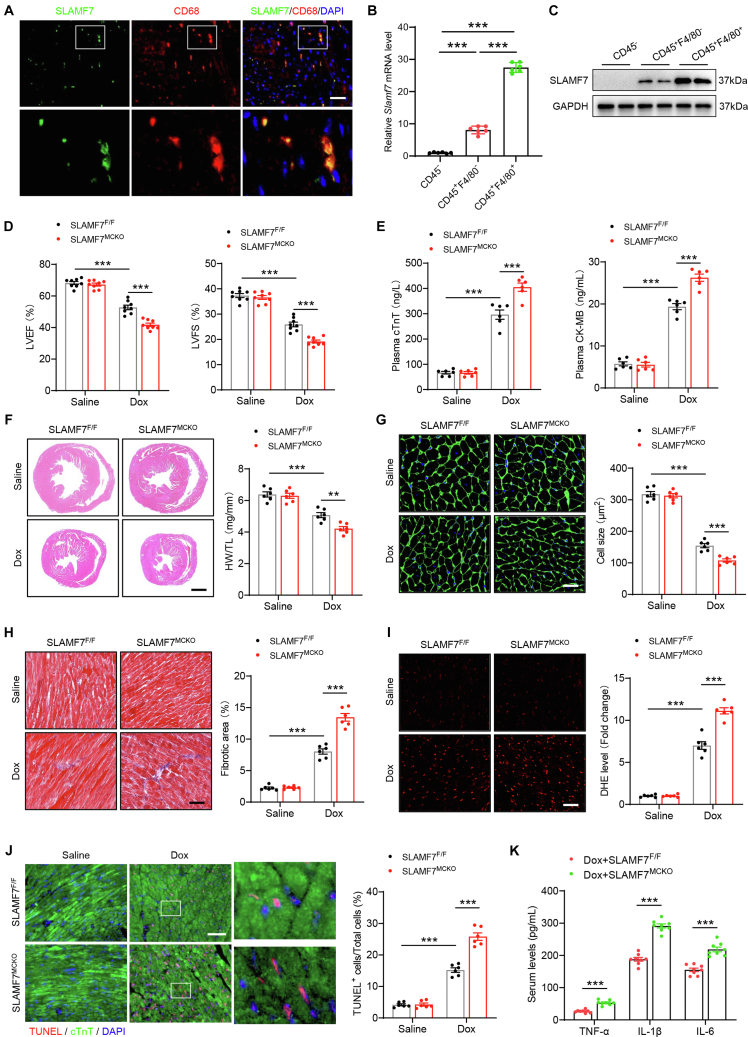
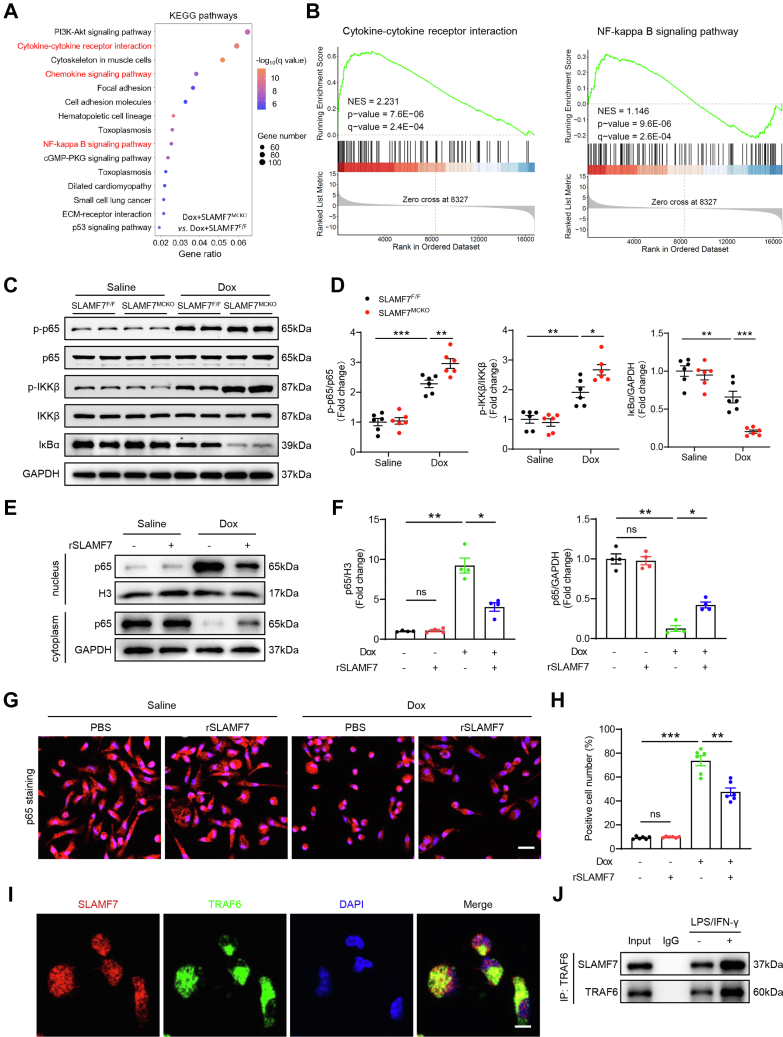
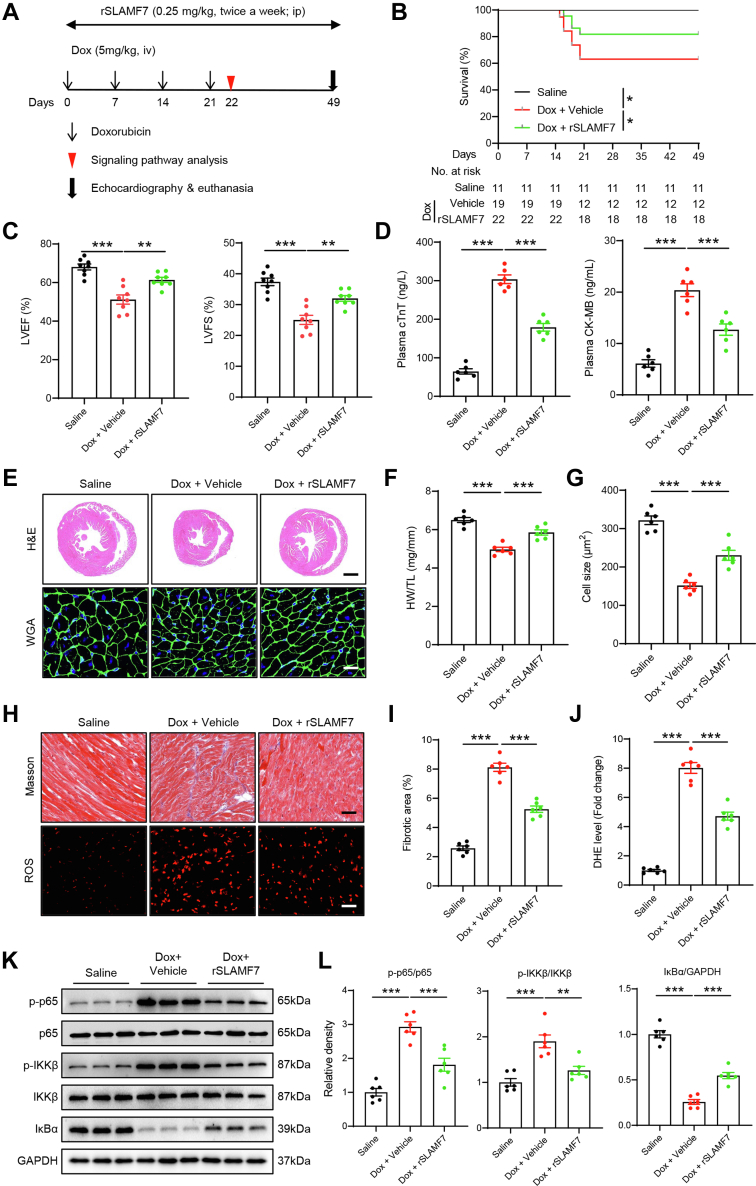
Doxorubicin-induced cardiotoxicity (DIC) poses a significant challenge in cancer treatment. This study investigated the role of SLAMF7 in DIC, particularly in macrophage-mediated inflammation. Using SLAMF7 knockout mice, we found that SLAMF7 deficiency exacerbates DIC and amplifies inflammatory responses. Mechanistically, SLAMF7 interacts with TNF receptor-associated factor 6 to attenuate nuclear factor κB signaling, reducing oxidative stress and proinflammatory cytokines. Notably, administering recombinant SLAMF7 protein effectively mitigated DIC. These findings underscore the critical role of SLAMF7 in protecting against DIC, positioning it as a promising therapeutic target.

Keywords: NF-κB; SLAMF7; TRAF6; cardiotoxicity; macrophage.


Conflict of interest statement

Funding Support and Author Disclosures This work was supported by the National Natural Science Foundation of China (T2288101, 82227803, 82071933, 82300292, and 82302213), National Key Research and Development Program of China (2021YFC2500500), and Natural Science Foundation of Shanghai (21ZR1413500, 20Y11912000, and 20JC1418400). The authors have reported that they have no relationships relevant to the contents of this paper to disclose.

Figures

None
Graphical abstract
Figure 1
Figure 1
Down-Regulation of SLAMF7 Expression in Doxorubicin-Induced Cardiotoxicity Hearts (A) Real-time qPCR analysis of SLAMs mRNA expression in a chronic doxorubicin-induced cardiotoxicity mouse model (n = 6 mice per group). (B and C) Western blot analysis (B) and quantification (C) of SLAMF7 levels in mouse cardiac tissue 4 weeks postsaline or doxorubicin (Dox) treatment (n = 8 mice per group). (D) Immunofluorescence images of SLAMF7 (red) and 4′,6-diamidino-2-phenylindole (DAPI) (blue) staining in cardiac tissue treated with saline or Dox. Negative control for SLAMF7 was included at the right of the image. Scale bar, 20 μm. (E) Serum SLAMF7 levels in Dox-treated mice and control groups (n = 8 mice per group). (F and G) Correlation analysis of serum SLAMF7 levels with cardiac troponin T (cTnT) and creatine kinase-MB (CK-MB) concentrations in a cohort of mice exposed to Dox for 4 weeks. Data are presented as means ± SEM. ∗P < 0.05, ∗∗P < 0.01, ∗∗∗P < 0.001. For statistical analyses, data in (A and E) were analyzed using a 2-tailed Student’s t-test; data in (C) were evaluated using the Mann-Whitney U test.
Figure 2
Figure 2
SLAMF7 Deficiency Aggravates Doxorubicin-Induced Cardiotoxicity (A) M-mode echocardiographic analysis showing left ventricular ejection fraction (LVEF) and fractional shortening (LVFS) in wild-type (WT) and SLAMF7 knockout (KO) mice after saline or Dox treatment (n = 8 mice per group). (B) Plasma levels of cTnT and CK-MB in WT and SLAMF7 KO mice after saline or Dox treatment (n = 6 mice per group). (C) Left: Representative hematoxylin and eosin (H and E) staining showing gross heart sizes from WT and SLAMF7 KO mice after saline or Dox treatment. Scale bar, 1,000 μm. Right: Heart weight to tibia length (HW/TL) ratio in WT and SLAMF7 KO mice after Dox treatment (n = 6 mice per group). (D) Left: Representative wheat germ agglutinin staining (WGA) showing cross-sectional area of cardiomyocytes in WT and SLAMF7 KO mice after saline or Dox treatment. Scale bar, 50 μm. Right: Quantification of myocyte cross-sectional area (n = 6 mice per group). (E) Left: Representative Masson’s trichrome staining for myocardial fibrosis in WT and SLAMF7 KO mice after saline or Dox treatment. Scale bar, 50 μm. Right: Quantification of myocardial fibrosis (n = 6 mice per group). (F) Left: Representative dihydroethidium (DHE) staining of reactive oxygen species (ROS) levels in the cardiac tissue of WT and SLAMF7 KO mice after saline or Dox treatment. Scale bar, 50 μm. Right: Quantification of ROS levels (n = 6 mice per group). Data are presented as means ± SEM. ∗P < 0.05, ∗∗P < 0.01, ∗∗∗P < 0.001. For statistical analyses, data in (A to F) were analyzed using a 2-way analysis of variance followed by Tukey’s post hoc analysis. Abbreviations as in Figure 1.
Figure 3
Figure 3
Macrophage-Specific Knockout of SLAMF7 Exacerbates Doxorubicin-Induced Cardiotoxicity in Mice (A) Immunofluorescence costaining for SLAMF7 (green) and CD68 (red) on cardiac sections from mice 4 weeks post-Dox treatment. Nuclei were counterstained with DAPI (blue). (B) Quantitative analysis of Slamf7 mRNA expression across 3 FACS-sorted cell populations (CD45, CD45+F4/80, and CD45+F4/80+) from the cardiac tissue of mice 4 weeks post-Dox treatment. Data are presented as the fold change relative to the CD45 group (n = 4 samples, with hearts from 4-5 mice pooled per sample). (C) Measurement of SLAMF7 protein levels in the 3 FACS-sorted cell populations. Cardiac tissues from 3 mice were used for sorting. (D) M-mode echocardiographic analysis showing LVEF and LVFS in SLAMFF/F and SLAMF7MCKO mice after saline or Dox treatment (n = 8 mice per group). (E) Plasma levels of cardiac injury markers, cTnT and CK-MB, in SLAMFF/F and SLAMF7MCKO mice post-saline or Dox treatment (n = 6 mice per group). (F) Left: Representative hematoxylin and eosin (H and E) staining showing gross heart sizes in SLAMFF/F and SLAMF7MCKO mice after saline or Dox treatment (scale bar, 1,000 μm). Right: Heart weight to tibia length (HW/TL) ratio in SLAMFF/F and SLAMF7MCKO mice postsaline or Dox treatment (n = 8 mice per group). (G) Left: Representative WGA staining showing cardiomyocyte cross-sectional area in SLAMFF/F and SLAMF7MCKO mice after saline or Dox treatment. Scale bar, 50 μm. Right: Quantification of myocyte cross-sectional area (n = 6 mice per group). (H) Left: Representative Masson’s trichrome staining for myocardial fibrosis in SLAMFF/F and SLAMF7MCKO mice after saline or Dox treatment. Scale bar, 50 μm. Right: Quantification of fibrotic area (n = 6 mice per group). (I) Left: Representative DHE staining showing ROS levels in the hearts of SLAMFF/F and SLAMF7MCKO mice after saline or Dox treatment. Scale bar, 50 μm. Right: Quantification of ROS levels (n = 6 mice per group). (J) Left: Representative terminal deoxynucleotidyl transferase dUTP nick-end labeling (TUNEL) staining showing the number of apoptotic cardiomyocytes in SLAMFF/F and SLAMF7MCKO mice after saline or Dox treatment. Scale bar, 50 μm. Right: Quantification of TUNEL+ cardiomyocytes (n = 6 mice per group). (K) Serum protein levels of inflammatory cytokines TNF-α (tumor necrosis factor-alpha), interleukin (IL)-1β (interleukin-1 beta), and IL-6 (interleukin-6) in SLAMFF/F and SLAMF7MCKO mice after saline or Dox treatment (n = 8 mice per group). Data are presented as means ± SEM. ∗P < 0.05, ∗∗P < 0.01, ∗∗∗P < 0.001. For statistical analyses, data in (B and K) were analyzed using a one-way analysis of variance followed by Tukey’s post hoc analysis; data in (D to J) were analyzed using a 2-way analysis of variance followed by Tukey’s post hoc analysis. Abbreviations as in Figures 1 and 2.
Figure 4
Figure 4
Effects of SLAMF7 Deletion on Macrophage Polarization in Doxorubicin-Induced Cardiotoxicity (A) Gene ontology (GO) analysis of differentially expressed genes between SLAMF7MCKO and SLAMF7F/F cardiac tissue post-Dox treatment, with top enriched categories highlighted. (B) Gene set enrichment analysis of 1-day postfinal Dox treatment RNA-seq data for SLAMF7MCKO and SLAMF7F/F mice. (C) Representative flow cytometry plots for the sorting of macrophages from cardiac tissues of the indicated groups. (D) Quantification of M2 macrophages based on flow cytometry analysis (n = 6 mice per group). (E and F) Immunostaining images (E) for iNOS (M1 marker) and CD68 (macrophage marker) and ratios (F) of M1 macrophages (iNOS+CD68+) in cardiac tissues of mice. Scale bar: 20 μm. (G and H) Immunostaining images (G) for Arg1 (M2 marker) and CD68 (macrophage marker) and ratios (H) of M2 macrophages (Arg1+CD68+) in cardiac tissues of mice. Scale bar: 20 μm. (I) Quantification of mRNA levels for M1 marker genes encoding IL-1β, IL-6, TNF-α, iNOS, and MMP9 in macrophages (n = 6 samples per group). (J) Quantification of mRNA levels for M2 marker genes encoding VEGF, ARG1, TGFB, MRC1, and CD36 in macrophages (n = 6 samples per group). Data are presented as means ± SEM. ∗P < 0.05, ∗∗P < 0.01, ∗∗∗P < 0.001. For statistical analyses, data in (D, F, and H to J) were analyzed using a 2-tailed Student’s t-test; data in (J) were evaluated using the Mann-Whitney U test. BP = biological process; CC = cellular component; MF = molecular function; NES = normalized enrichment score.
Figure 5
Figure 5
SLAMF7 Facilitates Macrophage M2 Polarization Through TRAF6/NF-κB Signaling (A) SLAMF7MCKO mice and their SLAMF7F/F littermates were subjected to Dox stimulation, and their hearts were collected for RNA-seq analysis. Kyoto Encyclopedia of Genes and Genomes (KEGG) analysis of differentially expressed genes. (B) Gene set enrichment analysis of RNA-seq data. (C) Representative immunoblotting images of nuclear factor κB (NF-κB) p-p65, NF-κB p65, p-IKKα/β, IKKα/β, and IκBα in SLAMF7F/F and SLAMF7MCKO cardiac tissues after saline or Dox treatment. (D) Quantification of panel C (n = 6 mice per group). E. Dox-treated bone marrow-derived macrophages (BMDMs) were stimulated with PBS or SLAMF7 recombinant proteins (rSLAMF7) for 24 hours; their cytoplasmic and nuclear fractions were isolated for western blotting assay. (F) Quantification of panel E (n = 4 samples per group). (G) Representative immunofluorescence images of NF-κB p65 (red) in BMDMs with or without rSLAMF7 treatment. Scale bars, 20 μm. (H) Quantification of panel G (n = 6 samples per group). (I) Confocal images showing the colocalization of SLAMF7 (red) and TRAF6 (green) in BMDMs Scale bar, 5 μm. (J) Coimmunoprecipitation assays confirming the interaction between SLAMF7 and TRAF6 in BMDMs Scale bar, 5 μm. Data are presented as means ± SEM. ∗P < 0.05, ∗∗P < 0.01, ∗∗∗P < 0.001. For statistical analyses, data in (D) were analyzed using a two-way analysis of variance followed by Tukey’s post hoc analysis; data in (F and H) were analyzed using a 1-way analysis of variance followed by Tukey’s post hoc analysis.
Figure 6
Figure 6
SLAMF7 Protects Against Doxorubicin-Induced Cardiotoxicity by Inhibiting Inflammation and Cardiac Injury (A) Schematic diagram illustrating the experimental strategy for SLAMF7 activation. (B) Survival analysis. (C) M-mode echocardiograms illustrating LVEF and LVFS in saline-treated WT and Dox-treated mice with or without rSLAMF7 (n = 8 mice per group). (D) Plasma levels of cTnT and CK-MB in saline-treated WT and Dox-treated mice with or without rSLAMF7 (n = 6 mice per group). (E) Representative H and E (scale bar, 1,000 μm) and WGA (scale bar, 50 μm) staining of saline-treated WT and Dox-treated mice with or without rSLAMF7. (F) HW/TL ratio (n = 6 mice per group). G. Quantification of myocyte cross-sectional area (n = 6 mice per group). (H) Representative Masson’s trichrome (scale bar, 50 μm) staining of myocardial fibrosis and DHE (scale bar, 50 μm) staining indicating ROS levels of saline-treated WT and Dox-treated mice with or without rSLAMF7. (I) Quantification of fibrotic area (n = 6 mice per group). (J) Quantification of ROS levels (n = 6 mice per group). (K) Representative immunoblotting images of NF-κB signaling in saline-treated WT and Dox-treated mice with or without rSLAMF7. (L) Quantification of K (n = 6 mice per group). Data are presented as means ± SEM. ∗P < 0.05, ∗∗P < 0.01, ∗∗∗P < 0.001. Statistical analyses for (C, D, F, G, I, J, and L) were analyzed using a one-way analysis of variance followed by Tukey’s post hoc analysis. Abbreviations as in Figures 2 and 3.
Figure 7
Figure 7
TRAF6 Inhibition Underlies the Beneficial Effects of SLAMF7 Activation in Doxorubicin-Induced Cardiotoxicity Mice (A) M-mode echocardiograms illustrating LVEF and LVFS in WT and doxorubicin-induced cardiotoxicity mice treated with vehicle or TRAF6 inhibitor C25-140, with or without rSLAMF7 (n = 8 mice per group). (B) Plasma cTnT and CK-MB levels in WT and DIC mice treated with vehicle or C25-140, with or without rSLAMF7 (n = 6 mice per group). (C) Representative hematoxylin and eosin (H and E) staining showing gross heart sizes in WT and DIC mice treated with vehicle or C25-140, with or without rSLAMF7. Scale bar, 1,000 μm. (D) HW/TL ratio in WT and DIC mice treated with vehicle or C25-140, with or without rSLAMF7 (n = 6 mice per group). (E) Quantification of fibrotic area in WT and doxorubicin-induced cardiotoxicity mice treated with vehicle or C25-140, with or without rSLAMF7 (n = 6 mice per group). (F) Representative dihydroethidium (DHE) staining indicating reactive oxygen species (ROS) levels in WT and DIC mice treated with vehicle or C25-140, with or without rSLAMF7. Scale bar, 50 μm. (G) Quantification of ROS levels (n = 6 mice per group). (H) Quantification of TUNEL+ cardiomyocytes (n = 6 mice per group). (I) Serum levels of inflammatory cytokines TNF-α, IL-1β, and IL-6 in WT and doxorubicin-induced cardiotoxicity mice treated with vehicle or C25-140, with or without rSLAMF7 (n = 8 mice per group). (J) Quantification of M1 macrophages based on flow cytometry analysis (n = 6 mice per group). (K) Representative immunoblotting images of NF-κB signaling in WT and doxorubicin-induced cardiotoxicity mice treated with vehicle or C25-140, with or without rSLAMF7. (L) Quantification of K (n = 6 mice per group). Data are presented as mean ± SEM. ∗P < 0.05, ∗∗P < 0.01, ∗∗∗P < 0.001. For statistical analyses, data in (A, B, D, E, G to J, and L) were analyzed using a 1-way analysis of variance followed by Tukey’s post hoc analysis. Abbreviations as in Figures 2 and 3.

References

    1. Wenningmann N., Knapp M., Ande A., et al. Insights into doxorubicin-induced cardiotoxicity: molecular mechanisms, preventive strategies, and early monitoring. Mol Pharmacol. 2019;96(2):219–232. - PubMed
    1. Mehta L.S., Watson K.E., Barac A., et al. Cardiovascular disease and breast cancer: where these entities intersect: a scientific statement from the american heart association. Circulation. 2018;137(8):e30–e66. - PMC - PubMed
    1. Zhang S., Liu X., Bawa-Khalfe T., et al. Identification of the molecular basis of doxorubicin-induced cardiotoxicity. Nat Med. 2012;18(11):1639–1642. - PubMed
    1. Lipshultz S.E., Franco V.I., Miller T.L., et al. Cardiovascular disease in adult survivors of childhood cancer. Annu Rev Med. 2015;66:161–176. - PMC - PubMed
    1. Dresdale A.R., Barr L.H., Bonow R.O., et al. Prospective randomized study of the role of N-acetyl cysteine in reversing doxorubicin-induced cardiomyopathy. Am J Clin Oncol. 1982;5(6):657–663. - PubMed

LinkOut - more resources