. 2025 May 15;74(7):204.
doi: 10.1007/s00262-025-04063-7.

ARHGDIB as a prognostic biomarker and modulator of the immunosuppressive microenvironment in glioma

Affiliations

ARHGDIB as a prognostic biomarker and modulator of the immunosuppressive microenvironment in glioma

Xuejun Yan et al. Cancer Immunol Immunother. .

Abstract

Background: Glioma, a prevalent malignant intracranial tumor, exhibits limited therapeutic efficacy due to its immunosuppressive microenvironment, leading to a poor prognosis for patients. ARHGDIB is implicated in the remodeling of the tumor microenvironment and plays a significant role in the pathogenesis of various tumors. However, its regulatory effect within the immune microenvironment of glioma remains unclear.

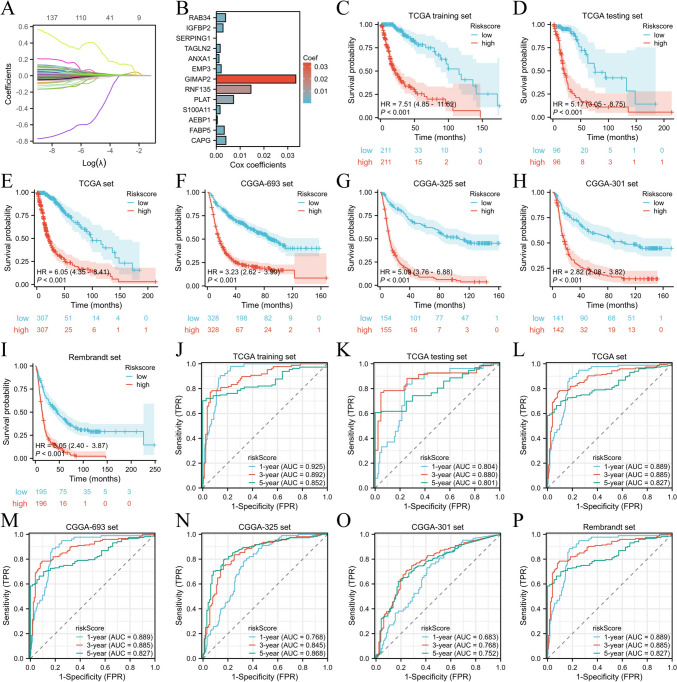
Methods: The mRNA expression pattern of ARHGDIB was analyzed using public databases, and its expression was further validated in our collected cohort through quantitative PCR (qPCR) and immunohistochemistry (IHC). Kaplan-Meier survival analysis and LASSO-Cox regression were employed to ascertain the clinical significance of ARHGDIB in glioma. Subsequently, we systematically evaluated the association between ARHGDIB expression and immune characteristics within the glioma microenvironment, as well as its potential to predict treatment response in glioma. Additionally, in vitro experiments were conducted to elucidate the role of ARHGDIB in remodeling the glioma microenvironment and promoting tumor malignancy progression.

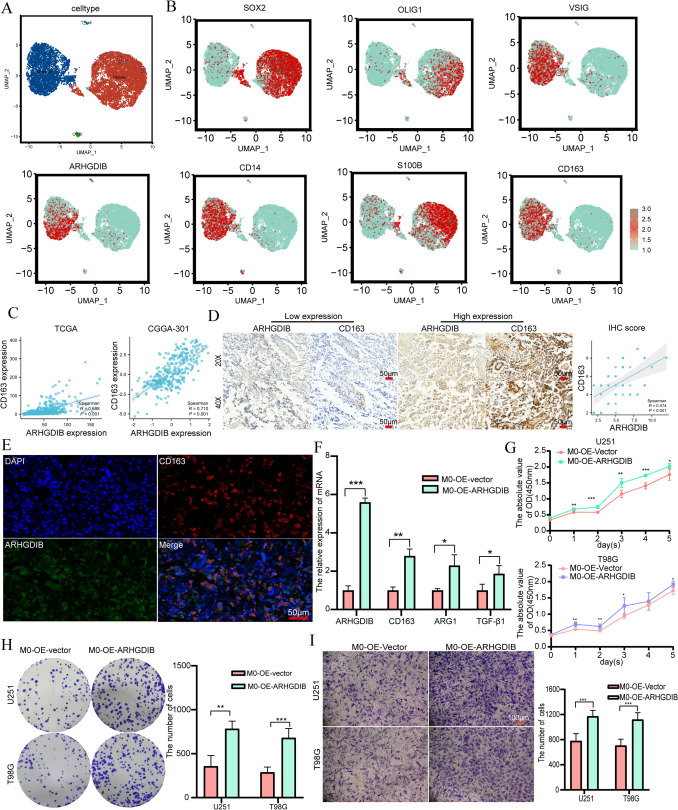
Results: Combined with bioinformatics analysis of public databases and validation with qPCR and IHC on our cohort, our findings indicate that ARHGDIB is markedly overexpressed in glioma and correlates with poor patient prognosis, thereby serving as a potential biomarker for adverse outcomes in glioma. Functional enrichment and immune infiltration analyses reveal that ARHGDIB is implicated in the recruitment of immunosuppressive cells, such as M2 macrophages and neutrophils, contributing to the alteration of the glioma immunosuppressive microenvironment and hindering the immune response. Further investigations through single-cell sequencing, immunohistochemistry, immunofluorescence, and in vitro experiments demonstrate that ARHGDIB exhibits an expression pattern akin to CD163, with its overexpression inducing M2 macrophage polarization and facilitating glioma cell proliferation and migration.

Conclusions: ARHGDIB emerges as a novel marker for tumor-associated macrophages, playing a crucial role in shaping the immunosuppressive microenvironment and representing a promising prognostic biomarker for glioma.

Keywords: ARHGDIB; Glioma; Immunosuppressive microenvironment; Prognosis; Tumor-associated macrophages.


Conflict of interest statement

Declarations. Conflict of interest: The authors declare that the research was conducted without any commercial or financial relationships that could be perceived as a potential conflict of interest. Ethical approval: All patients provided informed consent, and the ethics committee of XiangyaHospital, Central South University approved this study.

Figures

Fig. 1
Fig. 1
ARHGDIB is abnormally highly expressed in gliomas. AC The volcano plot shows differentially expressed genes (DEGs) in Our sequencing data, TCGA, and GSE16011 cohort. D The Venn diagram of upregulated genes intersects. E A pan-cancer analysis of ARHGDIB expression differences between normal samples and tumor tissues using the TCGA database. F and G The expression levels of ARHGDIB in normal tissues and glioma tissues were analyzed using the combining GTEx data with TCGA data, and the GSE16011 dataset. H The mRNA expression levels of ARHGDIB in normal tissues and glioma tissues were detected by qPCR in our own collected cohort. IK The protein expression levels of ARHGDIB in normal tissues and glioma tissues (I), gliomas of different WHO grades (J), and tissues with wild-type and mutant IDH1 (K) were detected by immunohistochemical staining. Differences between the two groups were assessed using Student’s t test, with P values indicated above each boxplot using asterisks (scale bar: 50 µm, *P < 0.05, **P < 0.01, ***P < 0.001)
Fig. 2
Fig. 2
ARHGDIB serves as an adverse prognostic biomarker in glioma. AF Kaplan–Meier curves illustrating the associations between ARHGDIB expression and overall survival (OS) in glioma patients across multiple datasets: TCGA (A), CGGA-693 (B), CGGA-301 (C), CGGA-325 (D), GSE16011 (E), and Rembrandt (F). G and H Kaplan–Meier curves demonstrating the associations between ARHGDIB expression and disease-specific survival (DSS) and progression-free interval (PFI) in TCGA cohort
Fig. 3
Fig. 3
ARHGDIB reshapes the immunosuppressive microenvironment in glioma. A The volcano plot illustrates the DEGs between the low-ARHGDIB and high-ARHGDIB groups in TCGA glioma cohort. B GSEA analysis was performed on gliomas with low and high ARHGDIB expression in TCGA cohort; the significance of the enrichment score (ES) was determined using thresholds of a nominal P < 0.05 and an FDR < 25%. (C-H) The ESTIMATE algorithm evaluates the stromal and immune scores in high- vs. low-ARHGDIB groups across multiple cohorts: C TCGA, D CGGA-325, E CGGA-301, F CGGA-693, G Rembrandt, H GSE16011. I and J Pan-cancer analysis of the correlation between ARHGDIB expression levels and immune cell infiltration using the CIBERSORT and ssGSEA algorithms. K and M The lollipop plot illustrates the correlation between ARHGDIB expression levels and the abundance of immune cell infiltration in glioma, based on CIBERSORT algorithms from TCGA (K), CGGA-301 (L), Rembrandt cohort (M). NS The ssGSEA algorithm was used to evaluate the levels of immune cell infiltration in gliomas of high- vs. low-ARHGDIB groups across multiple cohorts: N TCGA, O CGGA-693, P CGGA-301, Q CGGA-325, R Rembrandt, S GSEA10611. Differences between the two groups were assessed using Student’s t test, with P values indicated above each boxplot using asterisks (**P < 0.01, ***P < 0.001)
Fig. 4
Fig. 4
ARHGDIB impairs the immune response in glioma. A Variations in the expression levels of 122 immunomodulatory molecules (including chemokines, receptors, MHC molecules, and immune stimulators) between glioma samples with high and low ARHGDIB expression. B Differences in immune cell markers between the high-ARHGDIB and low-ARHGDIB groups in TCGA cohort. C Differences in the various stages of the cancer immunity cycle between gliomas with high ARHGDIB expression and those with low ARHGDIB expression in TCGA cohort. D The lollipop plot shows the correlation between the expression levels of 20 immune checkpoint molecules and the expression levels of ARHGDIB in TCGA cohort. E Differences in the enrichment scores of immunotherapy-related pathways between the high-ARHGDIB and low-ARHGDIB groups in the TCGA cohort. Differences between the two groups were assessed using Student’s t test, with P values indicated above each boxplot using asterisks (**P < 0.01, ***P < 0.001)
Fig. 5
Fig. 5
Construction, validation, and assessment of the ARHGDIB-associated risk score. A The distribution of partial likelihood deviance for the LASSO coefficient. B A compilation of 13 ARHGDIB-associated signatures derived from Cox regression coefficients. C–I Kaplan–Meier curves demonstrate the correlation between risk scores and overall survival in various cohorts: TCGA training set (C), TCGA internal validation set (D), entire TCGA set (E), CGGA-693 cohort (F), CGGA-301 (G), CGGA-325 (H), and Rembrandt (I). P values were determined using the log-rank test, with P < 0.05 as the significance threshold. JP Time-dependent ROC analysis for 1-year, 3-year, and 5-year survival demonstrated the predictive accuracy of the ARHGDIB-associated prognostic model across multiple cohorts: J TCGA training set, K TCGA internal validation set, L entire TCGA set, M CGGA-693 cohort, N CGGA-301, O CGGA-325, and P Rembrandt cohort
Fig. 6
Fig. 6
ARHGDIB induces M2 polarization of macrophages, thereby promoting the proliferation and migration of glioma cells. A single-cell sequencing analysis to identify four major cell types in glioma. B The distribution of ARHGDIB and markers of M2 macrophages and glioma cells in cell clusters. C Scatter plot showing the correlation of mRNA expression levels between ARHGDIB and CD163 in glioma samples from TCGA and CGGA-693 datasets. D The results of the immunohistochemical stain show the correlation of protein expression levels between ARHGDIB and CD163 in glioma tissues. E Immunofluorescence demonstrates the co-localization of ARHGDIB and CD163 in glioma tissues (scale bar: 50 µm). F qPCR analysis of M2 markers (CD163, ARG1, TGF-β) in M0 macrophages transfected with ARHGDIB or control vectors. GI Co-culture systems were used to evaluate the effects on the proliferation and migration abilities of T98G and U251 cells after co-culture with M0 cells transfecting with ARHGDIB expression vectors or control vectors: G proliferation: T98G and U251 glioma cells were co-cultured with ARHGDIB-overexpressing M0 macrophages, proliferation was measured by CCK-8 assay at 1, 2, 3, 4, and 5 days (n = 5 replicates), H colony formation: cells were fixed with 4% PFA and stained with 0.1% crystal violet after 14 days, I cell migration was quantified using Transwell chambers; membranes were fixed with 4% PFA and stained with 0.1% crystal violet (scale bar: 100 µm). Data are presented as mean ± SD, and differences between the two groups were assessed using Student’s t test, with P values indicated above each boxplot using asterisks (**P < 0.01, ***P < 0.001)

Similar articles

References

    1. Louis DN, Perry A, Reifenberger G, von Deimling A, Figarella-Branger D, Cavenee WK et al (2016) The 2016 world health organization classification of tumors of the central nervous system: a summary. Acta Neuropathol 131(6):803–820 - PubMed
    1. Okamoto Y, Di Patre PL, Burkhard C, Horstmann S, Jourde B, Fahey M et al (2004) Population-based study on incidence, survival rates, and genetic alterations of low-grade diffuse astrocytomas and oligodendrogliomas. Acta Neuropathol 108(1):49–56 - PubMed
    1. Wang L, Gu M, Zhang X, Kong T, Liao J, Zhang D et al (2025) Recent advances in nanoenzymes based therapies for glioblastoma: overcoming barriers and enhancing targeted treatment. Adv Sci (Weinh) 24:e2413367 - PMC - PubMed
    1. Stupp R, Mason WP, van den Bent MJ, Weller M, Fisher B, Taphoorn MJ et al (2005) Radiotherapy plus concomitant and adjuvant temozolomide for glioblastoma. N Engl J Med 352(10):987–996 - PubMed
    1. Martínez-Ricarte F, Mayor R, Martínez-Sáez E, Rubio-Pérez C, Pineda E, Cordero E et al (2018) Molecular diagnosis of diffuse gliomas through sequencing of cell-free circulating tumor DNA from cerebrospinal fluid. Clin Cancer Res 24(12):2812–2819 - PubMed

Substances