

Racial and Socioeconomic Disparities in California Ambulance Patient Offload Times
- PMID: 40372755
- PMCID: PMC12082368
- DOI: 10.1001/jamanetworkopen.2025.10325
Racial and Socioeconomic Disparities in California Ambulance Patient Offload Times
Abstract
Importance: Patient demographic and socioeconomic characteristics are associated with differential delays in access to emergency care. However, less is known about the association between demographic, socioeconomic, and emergency medical services (EMS) agency factors and ambulance patient offload times (APOT), a critical measure of timely access to emergency care.
Objective: To determine the association between ambulance offload times and demographic, socioeconomic, and EMS agency factors, uncover disparities in offload delays, and investigate factors associated with long APOT.
Design, setting, and participants: This retrospective cohort study was conducted using offload data from the California EMS Authority and local EMS agencies (LEMSA), population data from the US Census Bureau, and demographic and socioeconomic data from the Centers for Disease Control and Prevention's Social Vulnerability Index. California local EMS agencies participated from January 1, 2021, to June 30, 2023.
Exposure: A total of 30 community demographic, socioeconomic, and LEMSA factors were assessed.
Main outcomes and measures: The main outcome was weighted mean APOT, calculated from APOT measures obtained from the California Emergency Medical Services Authroity and LEMSAs. The association between APOT and area demographic and socioeconomic characteristics was assessed using linear regression.
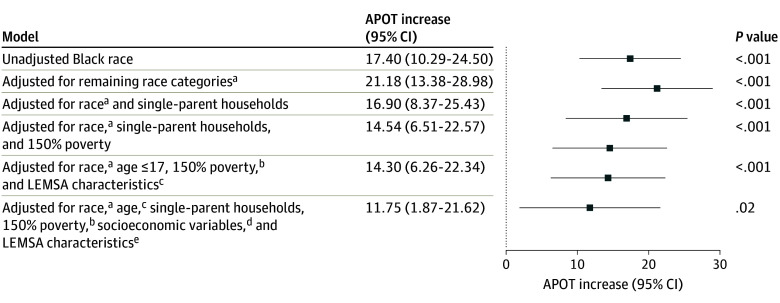
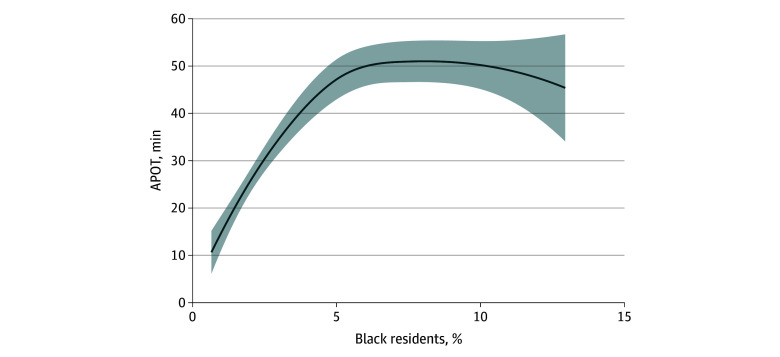
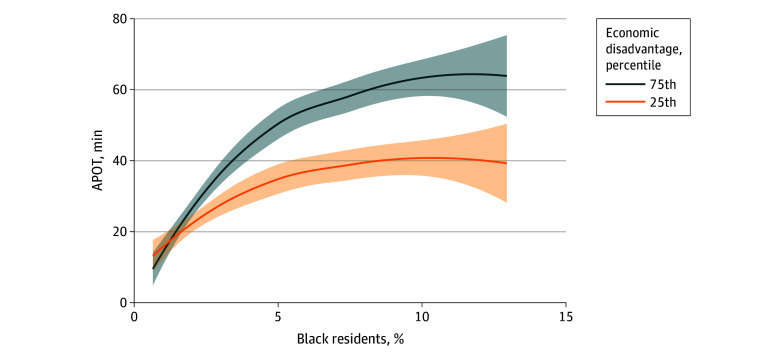
Results: In this retrospective study from January 1, 2021, to June 30, 2023, 5 913 399 offloads were observed across 34 California LEMSAs with median (IQR) of 0.3% (0.2%-0.4%) American Indian or Alaska Native residents, 7.1% (4.7%-1.5%) Asian residents, 2.2% (1.6%-4.9%) Black residents, 33.1% (22.5%-48.7%) Hispanic or Latino residents, 0.3% (0.2%-0.4%) Native Hawaiian or Pacific Islander residents, 4.1% (3.1%-4.9%) multiracial, and 0.4% (0.4%-0.5%) residents in the additional race category; 17.2% (14.7%-22.8%) residents living below 150% of the poverty line; and 15.7% (13.5%-20.1%) aged 65 years or older. The weighted mean (SD) APOT across California was 42.8 (27.3) minutes; the median (IQR) across LEMSAs was 27.0 (15.5-48.3) minutes. Sequential unadjusted linear regressions of the 30 characteristics revealed 11 that were significantly associated with APOT. Least absolute shrinkage and selection operator penalization identified Black race, being aged 65 years or older, and total offloads (all log-transformed) as the variables most associated with APOT. A 3.3% absolute increase in Black residents, from 1.6% (25th percentile) to 4.9% (75th percentile), was associated with an unadjusted 17.4-minute (95% CI 10.3-24.5) increase in APOT. This increase remained significant, at 11.75 (95% CI 1.9-21.6) minutes, after adjustments for demographic, socioeconomic, and LEMSA characteristics.
Conclusions and relevance: This cohort study of 5.9 million ambulance offloads found that the proportion of Black residents was the factor most significantly associated with longer APOT. These findings have direct implications for patients, EMS systems, and hospitals, as APOT may be an important component of health disparities in emergency care.
Conflict of interest statement
Figures
References
-
- Rasouli HR, Esfahani AA, Nobakht M, et al. Outcomes of crowding in emergency departments; a systematic review. Arch Acad Emerg Med. 2019;7(1):e52. https://www.ncbi.nlm.nih.gov/pmc/articles/PMC6785211/. - PMC - PubMed
-
- Kleindorfer DO, Lindsell CJ, Broderick JP, et al. Community socioeconomic status and prehospital times in acute stroke and transient ischemic attack: do poorer patients have longer delays from 911 call to the emergency department? Stroke. 2006;37(6):1508-1513. doi: 10.1161/01.STR.0000222933.94460.dd - DOI - PubMed
