. 2025 May 15:13:RP98257.
doi: 10.7554/eLife.98257.

Rudhira-mediated microtubule stability controls TGFβ signaling during mouse vascular development

Affiliations

Rudhira-mediated microtubule stability controls TGFβ signaling during mouse vascular development

Divyesh Joshi et al. Elife. .

Abstract

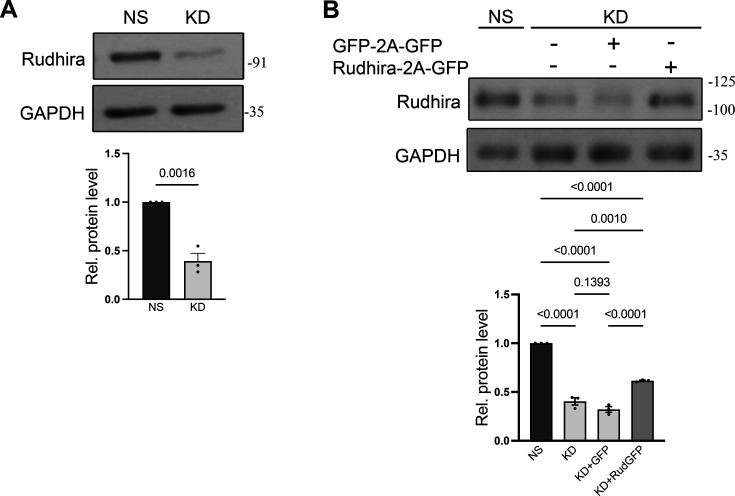
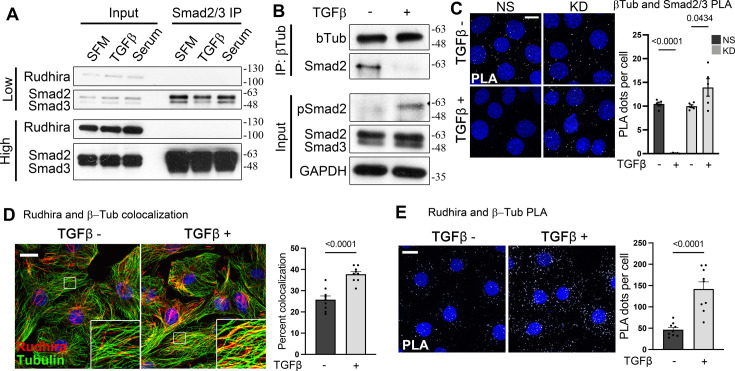
The transforming growth factor β (TGFβ) signaling pathway is critical for survival, proliferation, and cell migration, and is tightly regulated during cardiovascular development. Smads, key effectors of TGFβ signaling, are sequestered by microtubules (MTs) and need to be released for pathway function. Independently, TGFβ signaling also stabilizes MTs. Molecular details and the in vivo relevance of this cross-regulation remain unclear, understanding which is important in complex biological processes such as cardiovascular development. Here, we use rudhira/Breast Carcinoma Amplified Sequence 3 (Bcas3), an MT-associated, endothelium-restricted, and developmentally essential proto-oncogene, as a pivot to decipher cellular mechanisms in bridging TGFβ signaling and MT stability. We show that Rudhira regulates TGFβ signaling in vivo, during mouse cardiovascular development, and in endothelial cells in culture. Rudhira associates with MTs and is essential for the activation and release of Smad2/3 from MTs. Consequently, Rudhira depletion attenuates Smad2/3-dependent TGFβ signaling, thereby impairing cell migration. Interestingly, Rudhira is also a transcriptional target of Smad2/3-dependent TGFβ signaling essential for TGFβ-induced MT stability. Our study identifies an immediate early physical role and a slower, transcription-dependent role for Rudhira in cytoskeleton-TGFβ signaling crosstalk. These two phases of control could facilitate temporally and spatially restricted targeting of the cytoskeleton and/or TGFβ signaling in vascular development and disease.

Keywords: BCAS3; Rudhira; Smad2/3; TGFβ signaling; cell biology; developmental biology; microtubule cytoskeleton; mouse.


Conflict of interest statement

DJ, PJ, RS No competing interests declared, MI Reviewing editor, eLife

Figures

Figure 1.
Figure 1.. Rudhira depletion deregulates developmental endothelial transforming growth factor β (TGFβ) signaling.
(A) KEGG pathway map indicating TGFβ pathway genes from KEGG database that are deregulated upon rudhira depletion in mouse embryonic yolk sac, based on Shetty et al., 2018. Genes were mapped based on fold change in rudhira-/- yolk sacs in comparison to control to understand pathway regulation. Green: downregulated, red: upregulated. Blue circles indicate affected genes or processes known to be affected upon Rudhira depletion from earlier studies. (B) Non-silencing (NS) cells and knockdown (KD) saphenous vein endothelial cells (SVECs), transfected with constitutively active TGFBR1 for 24 hr, were analyzed for Smad2 phosphorylation by immunoblotting. Graph shows the quantitation of pSmad2/Smad2 levels (N=3 independent experiments). (C, D) Control (NS), rudhira KD, and rescued KD (KD+Rudhira-2A-GFP) cells were kept untreated or treated with TGFβ and used for various assays, as indicated. (C) Immunoblot for Smad2/3 and pSmad2. Graph shows the quantitation of pSmad2/Smad2 levels (N=3 independent experiments). (D) Quantitative RT-PCR (qRT-PCR) analysis of Mmp9 and Serpine, known Smad2/3 targets in endothelial cells (ECs) (N=3 independent experiments). (E, E’) Immunostaining for phosphorylated Smad2/3 in control and rudhira conditional knockout (Rudhira CKO) embryos at E10.5. Boxed region in the embryonic heart in (E) marking the endocardium and the myocardium is magnified in (E’) (N=3 embryos for each genotype). White dotted line indicates the endocardium. Graph shows the quantitation of pSmad2/3 levels (N=3 independent experiments). Statistical analysis was performed using two-way ANOVA (A, B, C, D) and Student’s t-test (E). Error bars indicate standard error of mean (SEM). *p<0.05, **p<0.01, ***p<0.001. Scale bar: (E) 100 µm; (E’) 20 μm.
Figure 1—figure supplement 1.
Figure 1—figure supplement 1.. Cell line validation.
(A, B) Validation of Rudhira knockdown and restoration in saphenous vein endothelial cells (SVECs) by immunoblotting. Statistical analysis was performed using one-sample t-test. Error bars indicate standard error of mean (SEM). *p<0.05, **p<0.01, ***p<0.001.
Figure 1—figure supplement 2.
Figure 1—figure supplement 2.. Rudhira acts downstream to transforming growth factor β (TGFβ) receptors.
(A) Quantitative RT-PCR (qRT-PCR) analysis of Tgfbr1 and Tgfbr2 in Rudhira knockdown (KD) endothelial cells (N=3 independent experiments). (B) TGFBR1 phosphorylation was analyzed using immunoblot technique in saphenous vein endothelial cell (SVEC) non-silencing (NS) and KD. Graph shows the quantitation of pTGFBR1/TGFBR1 levels (N=3 independent experiments). (C) NS cells and KD SVECs, transfected with constitutively active TGFBR1 for 24 hr, were analyzed for total TGFBR1 level by qRT-PCR. (D) SVEC control (NS) and KD cells were stimulated by BMP4 and used for immunoblotting of pSmad1/5/8. Graph shows the quantitation of pSmad1/5/8 by Smad1/5/8 levels (N=3 independent experiments). (E, E’) Immunostaining for total Smad2/3 in control and rudhira conditional knockout (Rudhira CKO) embryos at E10.5. Boxed region in the embryonic heart in (E) marking the endocardium and the myocardium is magnified in (E’) (N=3 embryos for each genotype). White dotted line indicates the endocardium. Graph shows the quantitation of Smad2/3 level (N=3 independent experiments). Statistical analysis was performed using one-sample t-test. Error bars indicate standard error of mean (SEM). *p<0.05, **p<0.01, ***p<0.001, ****p<0.0001. Scale bar: (E) 100 µm; (E’) 20 μm.
Figure 1—figure supplement 3.
Figure 1—figure supplement 3.. Rudhira specifically regulates transforming growth factor β (TGFβ)-dependent Smad2/3 activation.
(A) Saphenous vein endothelial cells (SVECs) treated with SB431542 (10 µM) for 2 hr and analyzed for Smad2 phosphorylation by immunoblotting. (B) Non-silencing (NS) and two KD SVEC lines (KD1 and KD2) were analyzed for microtubule (MT)-Smad interaction by proximity ligation assay (PLA) for β-Tubulin and Smad2/3 with or without TGFβ treatment (N=3 independent experiments). (C) Quantitative RT-PCR (qRT-PCR) analysis of negative regulators of TGFβ pathway (N=3 independent experiments). Statistical analysis was performed using one-way ANOVA. Error bars indicate standard error of mean (SEM). Scale bar (B): 20 μm. *p<0.05, **p<0.01, ***p<0.001.
Figure 2.
Figure 2.. Rudhira functions downstream of transforming growth factor β (TGFβ) receptor activation to promote TGFβ-dependent cell migration.
(A) Control (non-silencing [NS]), rudhira knockdown (KD), and rescued KD (KD+Rudhira-2A-GFP) cells were analyzed for migration rates with or without TGFβ using a transwell migration assay. Graph shows the extent of cell migration as measured by crystal violet absorbance (N=3 independent experiments). (B, C) HEK293 cells transfected with vector alone or Rudhira were analyzed for migration rates using a transwell migration assay in various conditions, as indicated. Graph shows the extent of cell migration as measured by crystal violet absorbance (N=3 independent experiments). Statistical analysis was performed using one-way ANOVA. Error bars indicate standard error of the mean (SEM). Scale bar: (A, B) 100 μm. *p<0.05, **p<0.01, ***p<0.001.
Figure 3.
Figure 3.. Rudhira is essential for the release of Smads from microtubules (MTs) for transforming growth factor β (TGFβ) pathway activation.
(A) Analysis of interaction between Rudhira, Smad2/3, and MTs by co-immunoprecipitation and immunoblotting, as indicated (N=3 independent experiments). (B) Loss of Smad-MT interaction on TGFβ stimulation in saphenous vein endothelial cells (SVECs) (N=3 independent experiments). (C) Non-silencing (NS) and knockdown (KD) cells were analyzed for MT and Smad2/3 interaction by proximity ligation assay (PLA) for Tubulin and Smad2/3 with or without TGFβ treatment. PLA dots represent Smad2/3 and β-Tubulin interaction. Graph shows the quantitation of PLA dots per cell (quantitation from >80 cells for two KD cell lines from N=3 independent experiments; also see Figure 1—figure supplement 3). (D, E) Association of Rudhira and MTs was analyzed by immunostaining (D) or PLA (E) for Rudhira and Tubulin with or without TGFβ stimulation in SVEC. PLA dots represent Rudhira and β-Tubulin interaction. Graph (D) shows the quantitation of colocalization percentage (quantitation from ~40 cells from 9 images each with or without TGFβ, respectively, from N=3 independent experiments) and graph (E) shows the quantitation of PLA dots per cell (quantitation from 86 or 68 cells from 9 images each with or without TGFβ, respectively, from N=3 independent experiments). Statistical analysis was performed using one-way ANOVA. Error bars indicate standard error of the mean (SEM). Scale bar: (C) 20 μm; (D, E) 10 µm. *p<0.05, **p<0.01, ***p<0.001.
Figure 4.
Figure 4.. Rudhira is a Smad2/3-dependent target of transforming growth factor β (TGFβ) signaling.
(A–C) TGFβ stimulation followed by quantitative RT-PCR (qRT-PCR) (A), immunoblot (B), or immunostaining (C) analysis (quantitation from 34 cells in each condition) of Rudhira levels in saphenous vein endothelial cells (SVECs). Graphs in (B) and (C) show the quantitation of Rudhira levels with or without TGFβ (N=3 independent experiments). (D) Analysis of Rudhira levels upon Smad2 or Smad3 knockdown in HEK293T cells by immunoblotting (N=3 independent experiments). Statistical analysis was performed using one-way ANOVA. Error bars indicate standard error of the mean (SEM). Scale bar: (C) 10 µm. *p<0.05, **p<0.01, ***p<0.001.
Figure 4—figure supplement 1.
Figure 4—figure supplement 1.. Transforming growth factor β (TGFβ) induces rudhira transcription for microtubule (MT) stability.
(A) Smad-binding element (SBE) matrix (Smad3, ID MA0795.1; Smad4, ID MA1153.1) and predicted binding sites in mouse (in red) and human (in blue) rudhira promoters, from JASPAR and PSCAN bioinformatics tool. (B) Transcription factor binding sites (TFBS) available from JASPAR and PSCAN bioinformatics tool. (C) Analysis of Rudhira levels and MT stability (marked by Glu-Tubulin) upon treatments, as indicated by immunoblotting (N=3 independent experiments). (D) Analysis of MT stability in serum-starved wild-type (WT) and knockdown (KD) cells kept untreated or treated with TGFβ or serum (N=3 independent experiments).
Figure 5.
Figure 5.. Transforming growth factor β (TGFβ)-dependent rudhira transcription stabilizes microtubules (MTs).
(A) Analysis of Rudhira levels and MT stability (marked by Glu-Tubulin) upon treatments as indicated by immunoblotting. Graphs show the quantitation of Rudhira or Glu-Tub levels (N=3 independent experiments). (B) Analysis of MT resistance to nocodazole-mediated depolymerization at indicated dosage and time (N=30 cells). (C) MT stability in serum-starved non-silencing (NS) cells or knockdown (KD) saphenous vein endothelial cells (SVECs) kept untreated or treated with TGFβ was analyzed by immunoblot for Glu-Tubulin. Graph shows the quantitation of Glu-Tub levels (N=3 independent experiments). (D) Immunostaining for Glu-Tubulin in control and rudhira conditional knockout (Rudhira CKO) embryos at E10.5. Endocardium in the heart is marked by PECAM1. Boxed region in the embryonic heart is magnified in the insets. Red arrowheads in the insets mark the PECAM1 positive cells (N=4 embryos for each genotype). Graph shows the quantitation of Glu-Tub fluorescence intensity in the endocardium. (E) Model depicting cellular and molecular response to TGFβ addition. Rudhira has an early and a late effect on MTs. Previously known information about Rudhira is shown in blue. Events identified in this study are shown in red or pink. Parallel lines indicate protein-protein interaction. Solid lines indicate direct effects. Dotted lines indicate effects that may be direct or indirect. Arrows indicate positive regulation. Bar-headed line indicates inhibition. Statistical analysis was performed using one-way ANOVA. Error bars indicate standard error of the mean (SEM). Scale bar: (B) 10 µm; (D) 100 µm. *p<0.05, **p<0.01, ***p<0.001.

Update of

  • doi: 10.1101/2024.04.23.590724
  • doi: 10.7554/eLife.98257.1
  • doi: 10.7554/eLife.98257.2
  • doi: 10.7554/eLife.98257.3

Similar articles

References

    1. Bagchi S, Fredriksson R, Wallén-Mackenzie Å. In situ proximity ligation assay (PLA) Methods in Molecular Biology. 2015;1318:149–159. doi: 10.1007/978-1-4939-2742-5_15. - DOI - PubMed
    1. Bärlund M, Monni O, Weaver JD, Kauraniemi P, Sauter G, Heiskanen M, Kallioniemi O-P, Kallioniemi A. Cloning of BCAS3 (17q23) and BCAS4 (20q13) genes that undergo amplification, overexpression, and fusion in breast cancer. Genes, Chromosomes & Cancer. 2002;35:311–317. doi: 10.1002/gcc.10121. - DOI - PubMed
    1. Bayless KJ, Johnson GA. Role of the cytoskeleton in formation and maintenance of angiogenic sprouts. Journal of Vascular Research. 2011;48:369–385. doi: 10.1159/000324751. - DOI - PMC - PubMed
    1. Cook TA, Nagasaki T, Gundersen GG. Rho guanosine triphosphatase mediates the selective stabilization of microtubules induced by lysophosphatidic acid. The Journal of Cell Biology. 1998;141:175–185. doi: 10.1083/jcb.141.1.175. - DOI - PMC - PubMed
    1. Devreotes P, Horwitz AR. Signaling networks that regulate cell migration. Cold Spring Harbor Perspectives in Biology. 2015;7:a005959. doi: 10.1101/cshperspect.a005959. - DOI - PMC - PubMed

LinkOut - more resources