. 2025 May 15;135(15):e186915.
doi: 10.1172/JCI186915. eCollection 2025 Aug 1.

Genetic variants predisposing to an increased risk of kidney stone disease

Affiliations

Genetic variants predisposing to an increased risk of kidney stone disease

Catherine E Lovegrove et al. J Clin Invest. .

Abstract

BACKGROUNDKidney stone disease (KSD) affects approximately 10% of adults, is heritable, and is associated with mineral metabolic abnormalities.METHODSGenetic variants and pathways increasing KSD risk via calcium and phosphate homeostasis were ascertained using GWAS, region-specific Mendelian randomization (MR), and genetic colocalization. The utility of pathway modulation was estimated via drug target MR, and the effects of variants on calcium-sensing receptor (CaSR) signaling were characterized.RESULTSSeventy-nine independent KSD-associated genetic signals at 71 loci were identified. MR identified 3 loci affecting KSD risk via increased serum calcium or decreased serum phosphate concentrations (ORs for genomic regions = 4.30, 11.42, and 13.83 per 1 SD alteration; P < 5.6 × 10⁻¹⁰). Colocalization analyses defined putative, noncoding KSD-causing variants estimated to account for 11%-19% of KSD cases in proximity to diacylglycerol kinase δ (DGKD), a CaSR signaling partner; solute carrier family 34 member 1 (SLC34A1), a renal sodium-phosphate transporter; and cytochrome P450 family 24 subfamily A member 1 (CYP24A1), which degrades 1,25-dihydroxyvitamin D. Drug target MR indicated that reducing serum calcium by 0.08 mmol/L via CASR, DGKD, or CYP24A1, or increasing serum phosphate by 0.16 mmol/L via SLC34A1 may reduce KSD relative risk by up to 90%. Furthermore, reduced DGKδ expression and KSD-associated DGKD missense variants impaired CaSR signal transduction in vitro, which was ameliorated by cinacalcet, a positive CaSR allosteric modulator.CONCLUSIONDGKD-, SLC34A1-, and CYP24A1-associated variants linked to reduced CaSR signal transduction, increased urinary phosphate excretion, and impaired 1,25-dihydroxyvitamin D inactivation, respectively, are common causes of KSD. Genotyping patients with KSD may facilitate personalized KSD risk stratification and targeted pharmacomodulation of associated pathways to prevent KSD.FUNDINGOxfordshire Health Services Research Committee (OHSRC, part of Oxford Hospitals Charity); Kidney Research UK (RP_030_20180306); The Urology Foundation; National Institute for Health Research (NIHR) Oxford Biomedical Research Centre (NF-SI-0514-10091); Wellcome Trust (204826/z/16/z and 106995/z/15/z); Medical Research Council (MRC) Clinical Research Training Fellowships (MR/W03168X/1 and MR/S021329/1); Wellcome Trust Clinical Career Development Fellowship; Sir Henry Dale Fellowship, with joint funding by the Wellcome Trust and the Royal Society (224155/Z/21/Z); St. Peter's Trust for Kidney Bladder and Prostate Research.

Keywords: Calcium signaling; Endocrinology; Genetic variation; Genetics; Nephrology; Urology.


Conflict of interest statement

Conflict of interest: MVH is an employee of 23andMe Inc. and holds stock in the company. RVT has received grants from Novo Nordisk, GSK, NPS Pharma, BMS, and Novartis for unrelated projects. DPG reports fees for consulting and presenting from Novartis, Alexion, Calliditas, Sanofi, Britannia, and Travere.

Figures

Figure 1
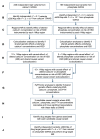
Figure 1. Study design to identify genetic variants predisposing to an increased risk of KSD.
(A and B) Independent (r2 < 0.1) genetic variants ± 500 kbp of the lead independent variants from serum albumin–adjusted calcium or phosphate GWAS significantly (P < 5 × 10⁻⁸) associated with serum albumin–adjusted calcium or phosphate concentrations were selected for use as IVs. (C) MR was performed using each of the identified IVs to instrument the effects of alterations in the biochemical exposure on the risk of KSD using UK Biobank, FinnGen, and UK Biobank-FinnGen meta-analysis KSD GWAS summary statistics. (D) Colocalization analyses were performed. (E) Regions with significant MR results (after P value adjustment using the FDR method) and evidence of colocalization were identified. (FH) HyPrColoc was undertaken to assess whether there was colocalization between KSD and serum albumin–adjusted serum calcium, phosphate, and PTH concentrations and identity candidate causal variants. (I) Drug targets from the genes associated with candidate causal variants were identified. (J) Drug target MR was performed to assess the potential utility of modulating drug targets to prevent KSD, selecting genetic variants for use as IVs within 300 kbp of genes of interest. *albumin-adjusted serum calcium concentration; IV comprising 3 or more genetic variants.
Figure 2
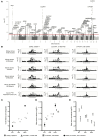
Figure 2. Genetic associations of KSD and serum calcium and phosphate concentrations.
(A) Meta-analysis of GWASs of data from the UK Biobank and FinnGen including data on 24,167 kidney stone cases and 876,673 controls. Manhattan plot shows genome-wide P values (–log10) plotted against the chromosomal position. Horizontal red line indicates the genome-wide significance threshold (5.0 × 10⁻⁸). Loci are labeled with the following primary candidate genes: CASZ1, ALPL, CLDN19, HORMAD1, PTGS2, SLC41A1, SLC30A10, GCKR, RBKS, CYP1B1, THADA, DGKD, COL7A1, WNT5A, HEG1, CASR, ADRAC2, ABCG2, UGT8, ISL1, PDE4D, TMEM171, SLC34A1, FLOT1, HLA-DQA, KCNK5, VEGFA, TFAP2B, PKHD1, RRAGD, ASCC3, L3MBTL3, TCF21, SLC22A2, HIBADH, AQP1, TRPV5, PRKAG2, TMEM252, TRPM6, AOPEP, PARD3, AMPD3, SIK, PRICKLE1, DGKH, CLDN10, PRKD1, AP4E1, PDE8A, UMOD, FTO, ZFPM1, MAP2K4, CDK12, ARHGAP27, ARL17B, SOX9, BCAS3, PTGER1, STAP2, GIPR, ZNF28, CYP24A1, NRIP1, CLDN14, GNAZ, H1-0, and CHADL. Thirty-three of the loci (underlined) have not previously been associated with KSD. (B) Locus zooms from GWASs of KSD and albumin-adjusted serum calcium, serum phosphate, and PTH concentrations at loci, with evidence from regional MR that the risk of KSD is increased via serum calcium and phosphate concentrations and where genetic associations of KSD and serum calcium, phosphate, and PTH concentrations colocalize. (CE) Associations of genotype with KSD (C), serum calcium concentration (D), and serum phosphate concentration (E) in the DiscovEHR cohort (n = 11,451 kidney stone cases and 86,294 controls). Mean serum calcium (D) and phosphate (E) measurements ± SEM adjusted for KSD case status. Note, in some cases, the SEM is small and obscured by the graphical icon. Associations of combinations of DGKD-, CYP24A1-, and SLC34A1- risk alleles were not assessed for serum phosphate due to a lack of directional concordance. These findings provide evidence that the variants rs838717, rs10051765, and rs6127099 are causal risk factors for KSD acting via reduced CaSR signal transduction, increased urinary phosphate excretion, and impaired vitamin D inactivation, respectively. Het, heterozygous; Hom, homozygous.
Figure 3
Figure 3. Drug target MR.
Forest plot of the predicted effects of modulating albumin-adjusted serum calcium concentrations via DGKD, CASR, or CYP24A1 or serum phosphate concentrations via SLC34A1. Gene positions are defined via Ensembl ± 300 kbp. There were insufficient genetic instruments to undertake analyses of modulating serum calcium or phosphate concentrations via DGKD or SLC34A1 using a threshold for genetic independence (r2) of 0.01. These data indicate that reducing serum calcium via DGKD, CASR, or CYP24A1, or increasing serum phosphate via SLC34A1 would decrease the risk of KSD.
Figure 4
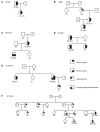
Figure 4. Family trees of DiscovEHR kindreds (A–F) were identified as harboring DGKD variants.
Squares represent male family members, circles female family members, and ? indicates missing data. Individuals’ ages (years) are shown below the symbols, and the age of the individual at the first record of a kidney stone episode is shown in parentheses.
Figure 5
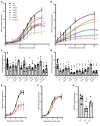
Figure 5. Functional characterization of kidney stone–associated DGKδ variants.
(A) CaSR-mediated SRE and (B) NFAT-RE responses to changes in extracellular calcium concentration [Ca2+]e in HEK-CaSR-DGK cells stably transfected with WT or the kidney stone–associated variants I91V, H190Q, I221N, T319A, V464I, R900H, or R1181W. Transfection with kidney stone–associated DGKD variants led to a reduction in SRE and NFAT-RE responses compared with cells transfected with WT DGKD. (C) Effect of 100 nM cinacalcet (cin) treatment on SRE responses at 3.5 mM [Ca2+]e and (D) NFAT-RE responses at 10 mM [Ca2+]e in HEK-CaSR-DGK cells transfected with the kidney stone–associated variants. Treatment with cinacalcet increased SRE-mediated responses of all variants but had no effect on NFAT-RE responses except for cells transfected with the R900H variant. (E) CaSR-mediated SRE and (F) NFAT-RE responses to changes in [Ca2+]e in HEK-CaSR cells following DGKδ KD (red), which led to a reduction in SRE responses without a change in NFAT-RE responses, compared with WT (black). (G) Effect of 5 nM cinacalcet treatment on SRE responses at 3.5 mM [Ca2+]e in HEK-CaSR cells following DGKδ KD. Treatment with cinacalcet rectified impaired SRE-mediated responses. Mean fold change responses ± SEM are shown for 4 biologically independent experiments. A 2-way ANOVA with Dunnett’s correction for multiple comparisons was used to compare points on the dose response curve with reference to WT. These data provide evidence that KSD is associated with impaired CaSR signal transduction, which can be ameliorated with cinacalcet. *P < 0.05, **P < 0.01, ***P < 0.001, and ****P < 0.0001 versus WT.
Figure 6
Figure 6. 3D modeling of kidney stone–associated DGKδ variants.
(A) Predicted structure of DGKδ isoform 2 (AF-Q16760-F1-mod; refs. , ; AlphaFold). Residue I91 lies in the pleckstrin homology domain (purple); residues H190 and I221 are located in the cysteine-rich domain (yellow); residue T319 is in the catalytic domain (pink); residue V464 is in a linker region; residue R900 is in the accessory catalytic domain (dark green); and R1181 is located in the SAM domain (blue) (86). (B) Location of R1181 (dark blue) in the oligomeric DGKδ SAM domain crystal structure (PDB 3BQ7; ref. 25). R1181 is predicted to form a polar contact (dashed black line) with D1183 on the adjacent DGKδ SAM domain (gray). (C) Location of W1181 (red) in the oligomeric DGKδ SAM domain crystal structure. W1181 is not predicted to form a polar contact with D1183 on the adjacent DGKδ SAM structure (gray).

Comment in

  • Genetic susceptibility to kidney stone disease: unveiling pathogenesis and potential therapeutic targets

References

    1. Abufaraj M, et al. Prevalence and trends in kidney stone among adults in the USA: analyses of national health and nutrition examination survey 2007-2018 Data. Eur Urol Focus. 2021;7(6):1468–1475. doi: 10.1016/j.euf.2020.08.011. - DOI - PubMed
    1. Goldfarb DS, et al. A twin study of genetic influences on nephrolithiasis in women and men. Kidney Int Rep. 2018;4(4):535–540. doi: 10.1016/j.ekir.2018.11.017. - DOI - PMC - PubMed
    1. Halbritter J. Genetics of kidney stone disease-Polygenic meets monogenic. Nephrol Ther. 2021;17S:S88–S94. doi: 10.1016/j.nephro.2020.02.003. - DOI - PubMed
    1. Sayer JA. Progress in understanding the genetics of calcium-containing nephrolithiasis. J Am Soc Nephrol. 2017;28(3):748–759. doi: 10.1681/ASN.2016050576. - DOI - PMC - PubMed
    1. Monico CG, Milliner DS. Genetic determinants of urolithiasis. Nat Rev Nephrol. 2011;8(3):151–162. doi: 10.1038/nrneph.2011.211. - DOI - PMC - PubMed