. 2025 May 27;44(5):115684.
doi: 10.1016/j.celrep.2025.115684. Epub 2025 May 13.

Live bacteria in gut microbiome dictate asthma onset triggered by environmental particles via modulation of DNA methylation in dendritic cells

Affiliations

Live bacteria in gut microbiome dictate asthma onset triggered by environmental particles via modulation of DNA methylation in dendritic cells

Mohankumar Ramar et al. Cell Rep. .

Abstract

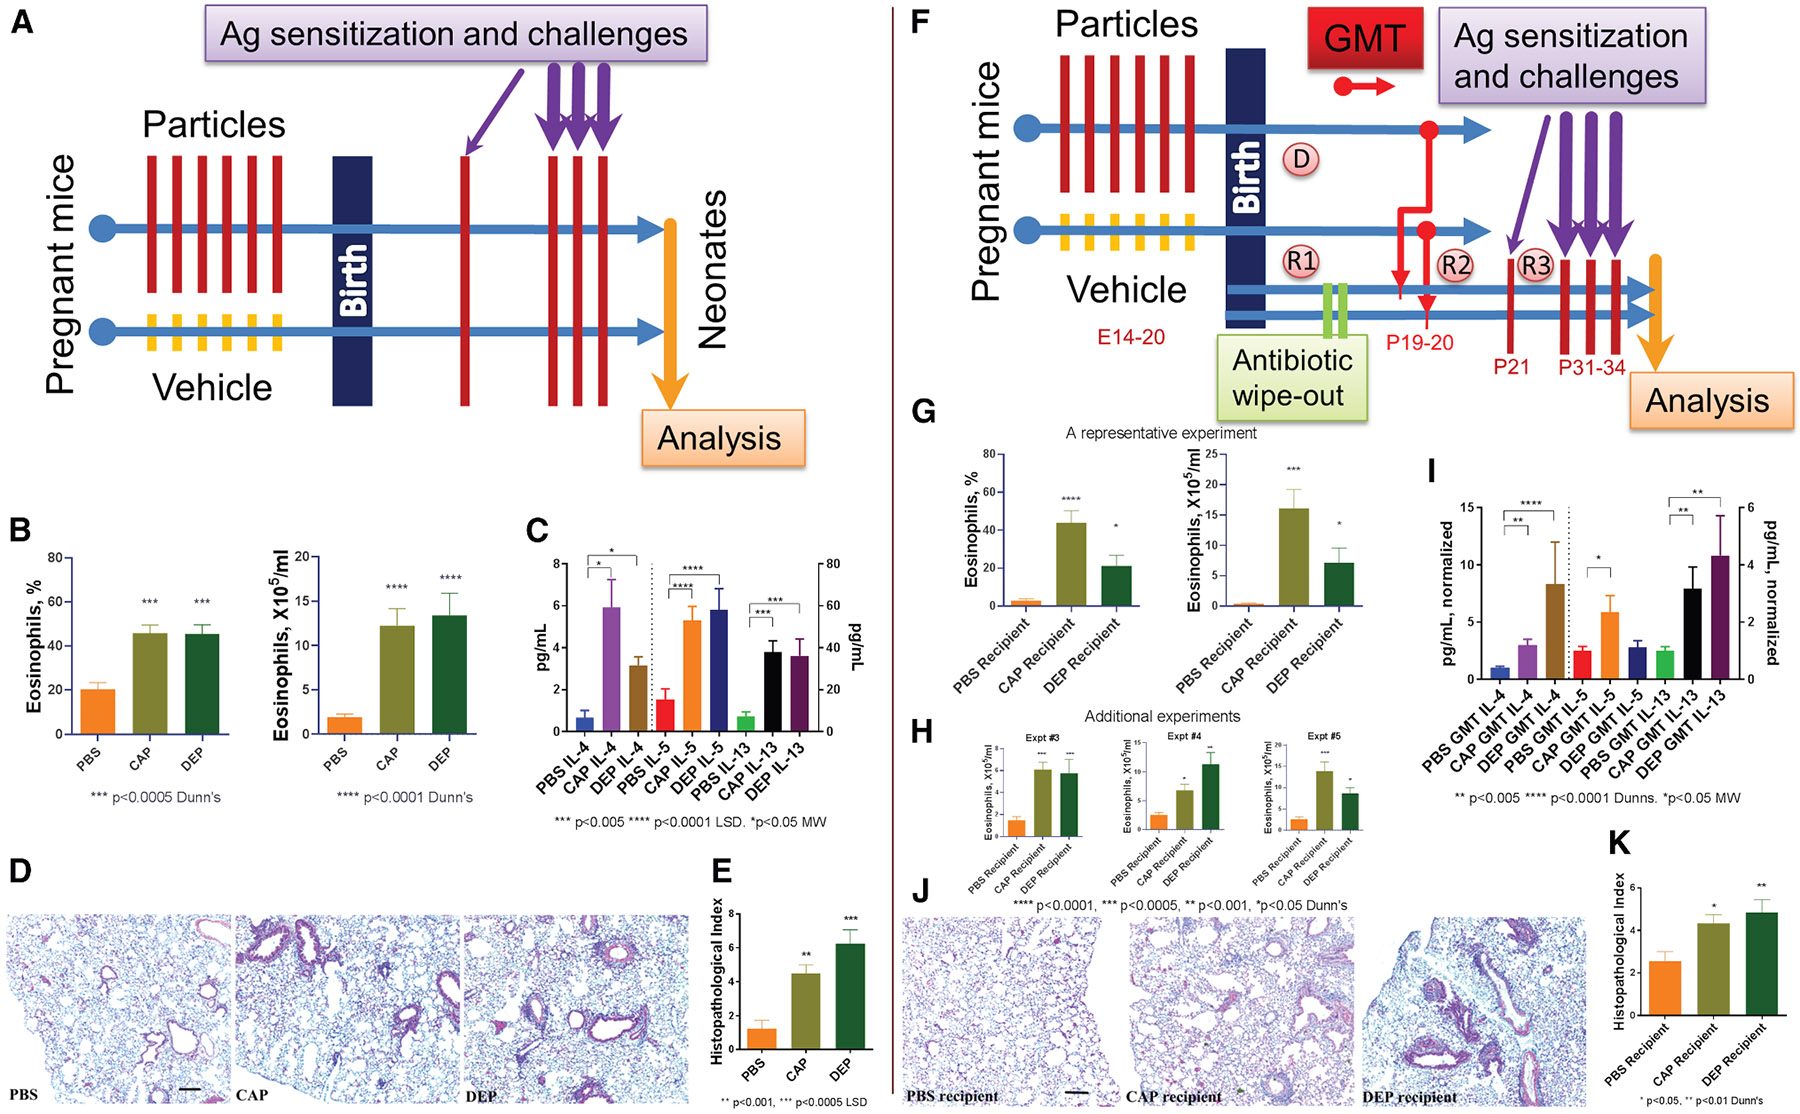
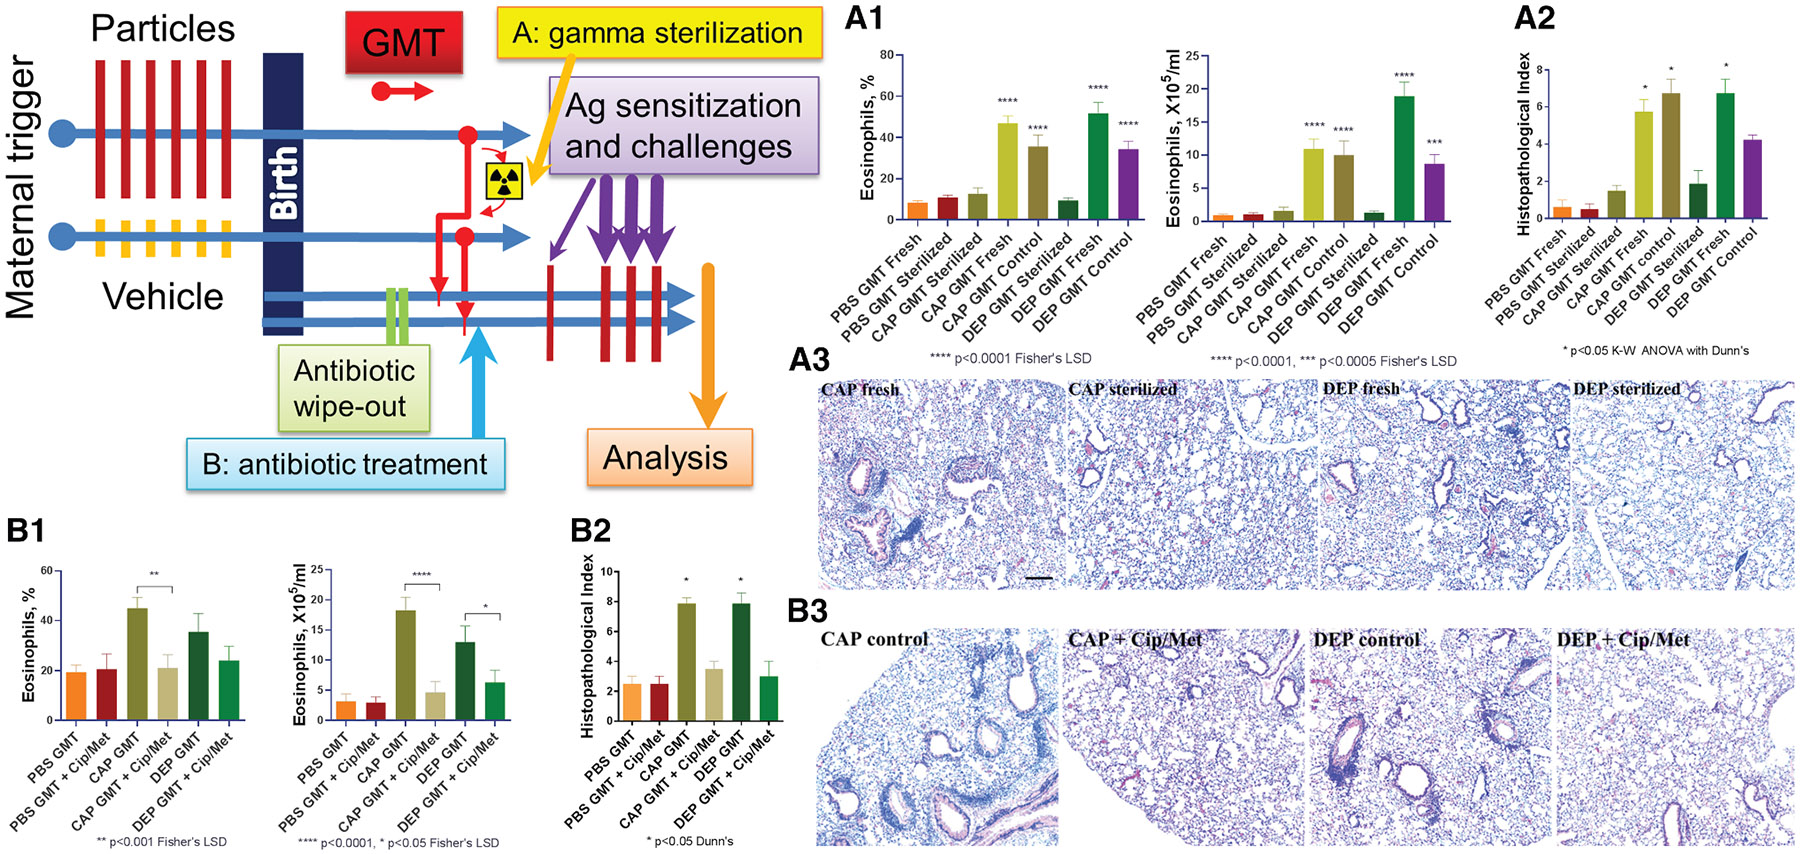
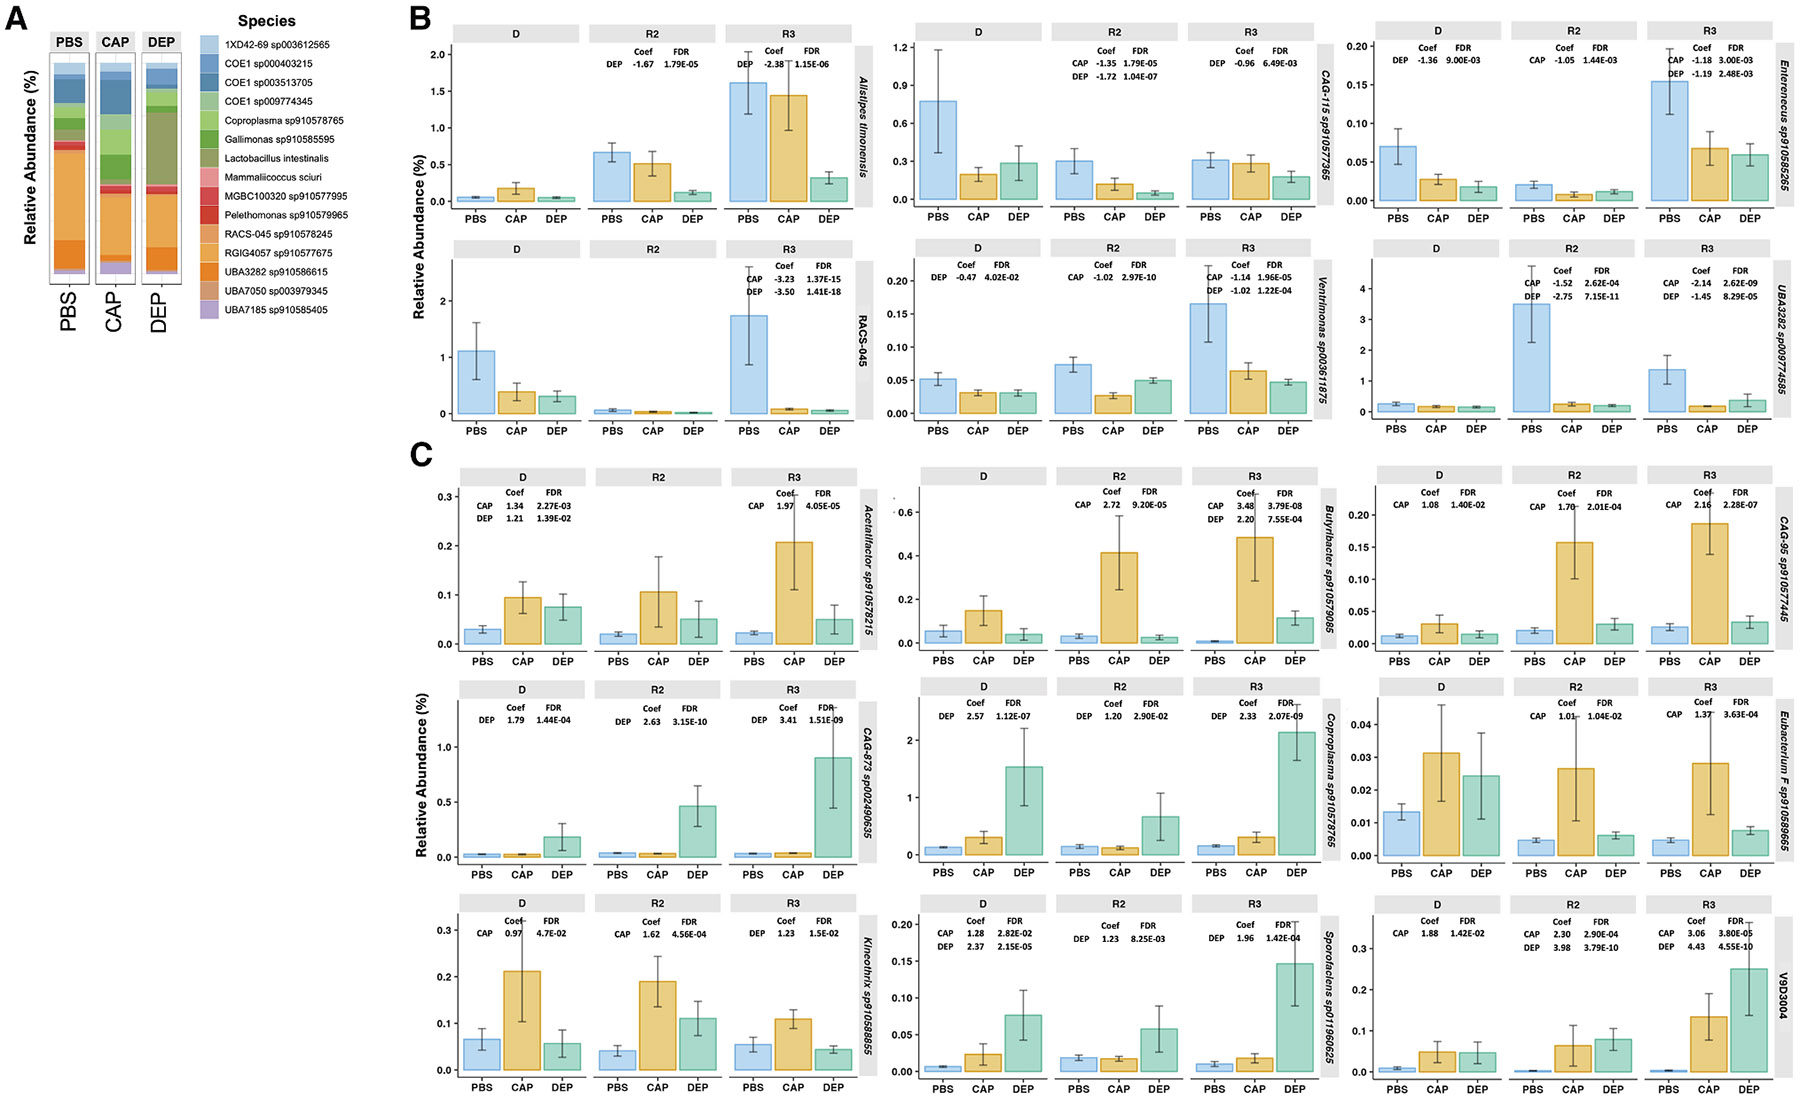
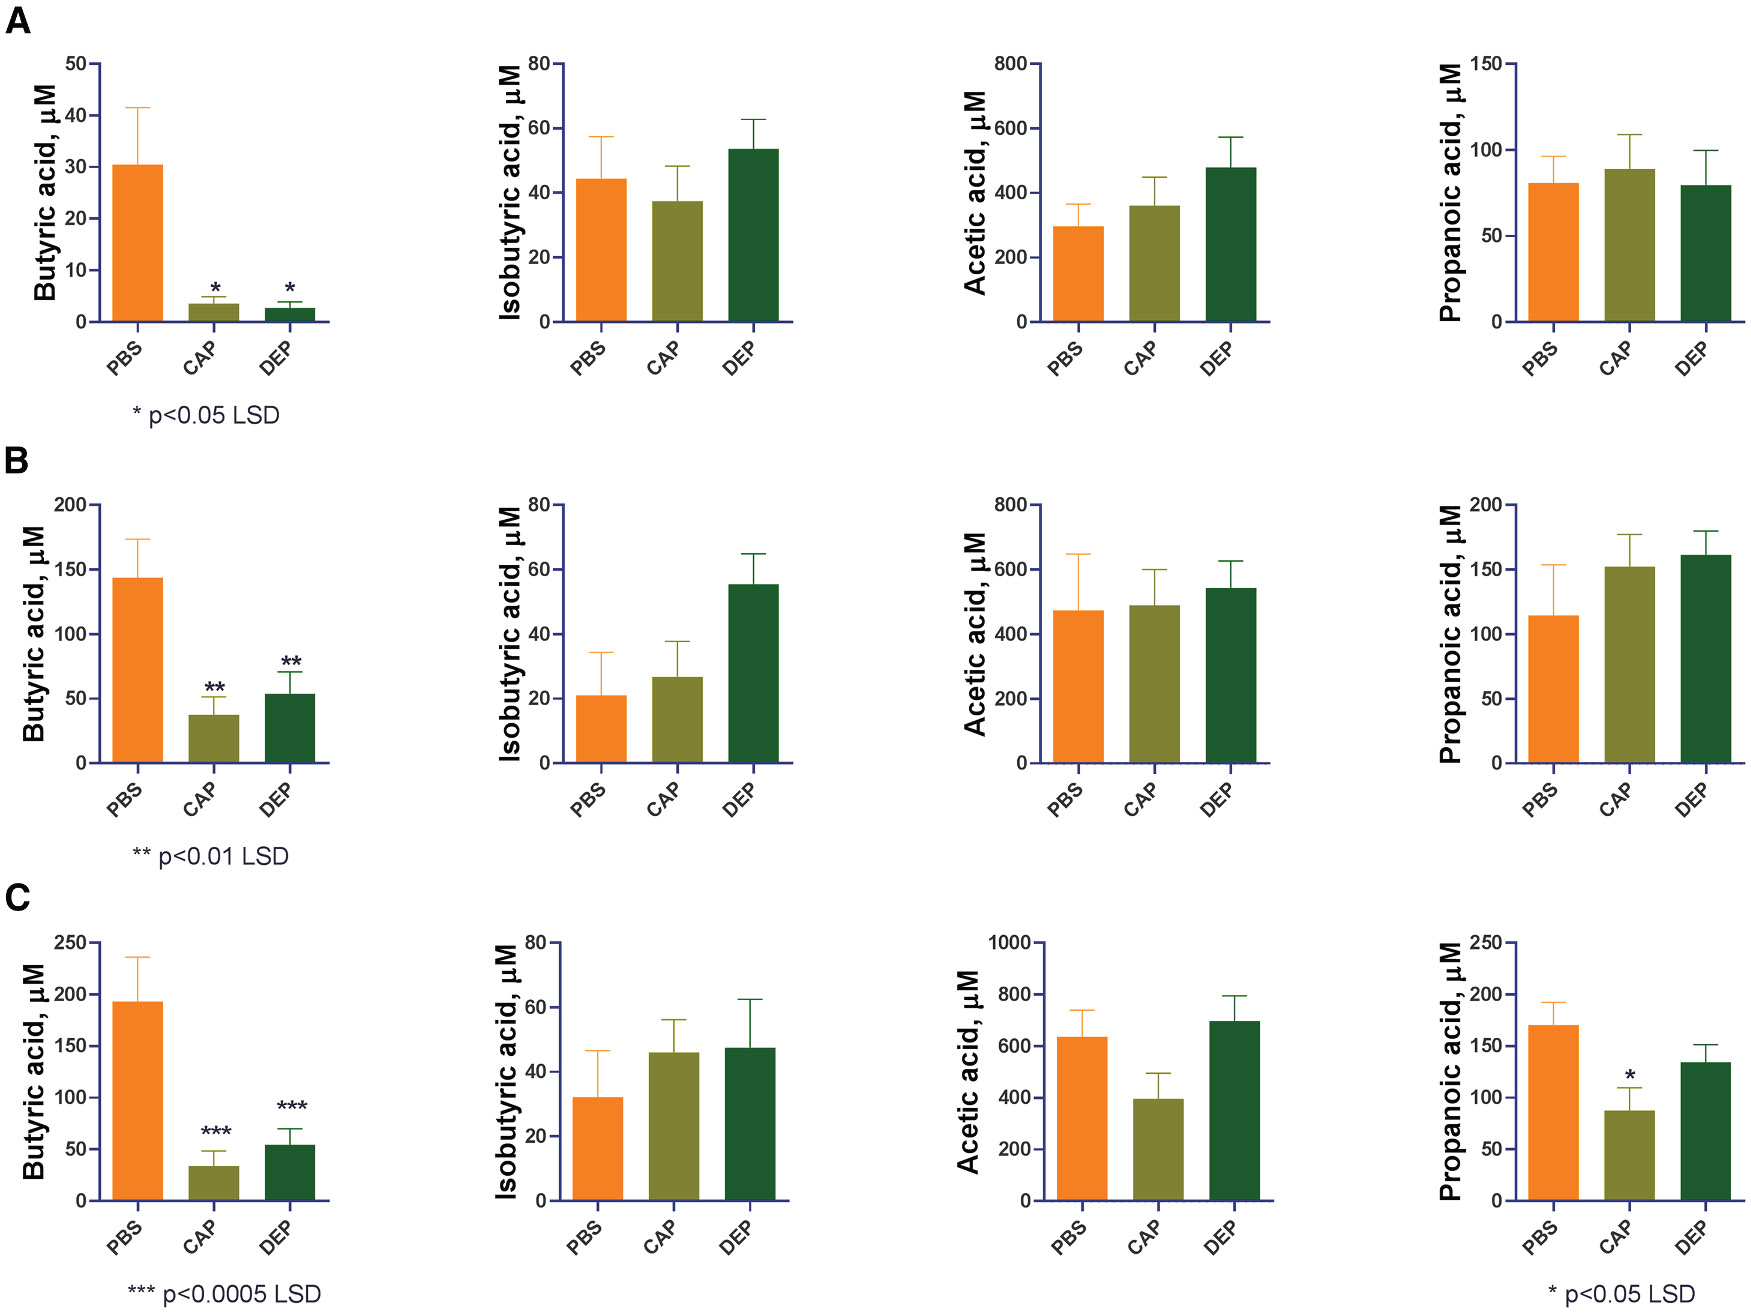
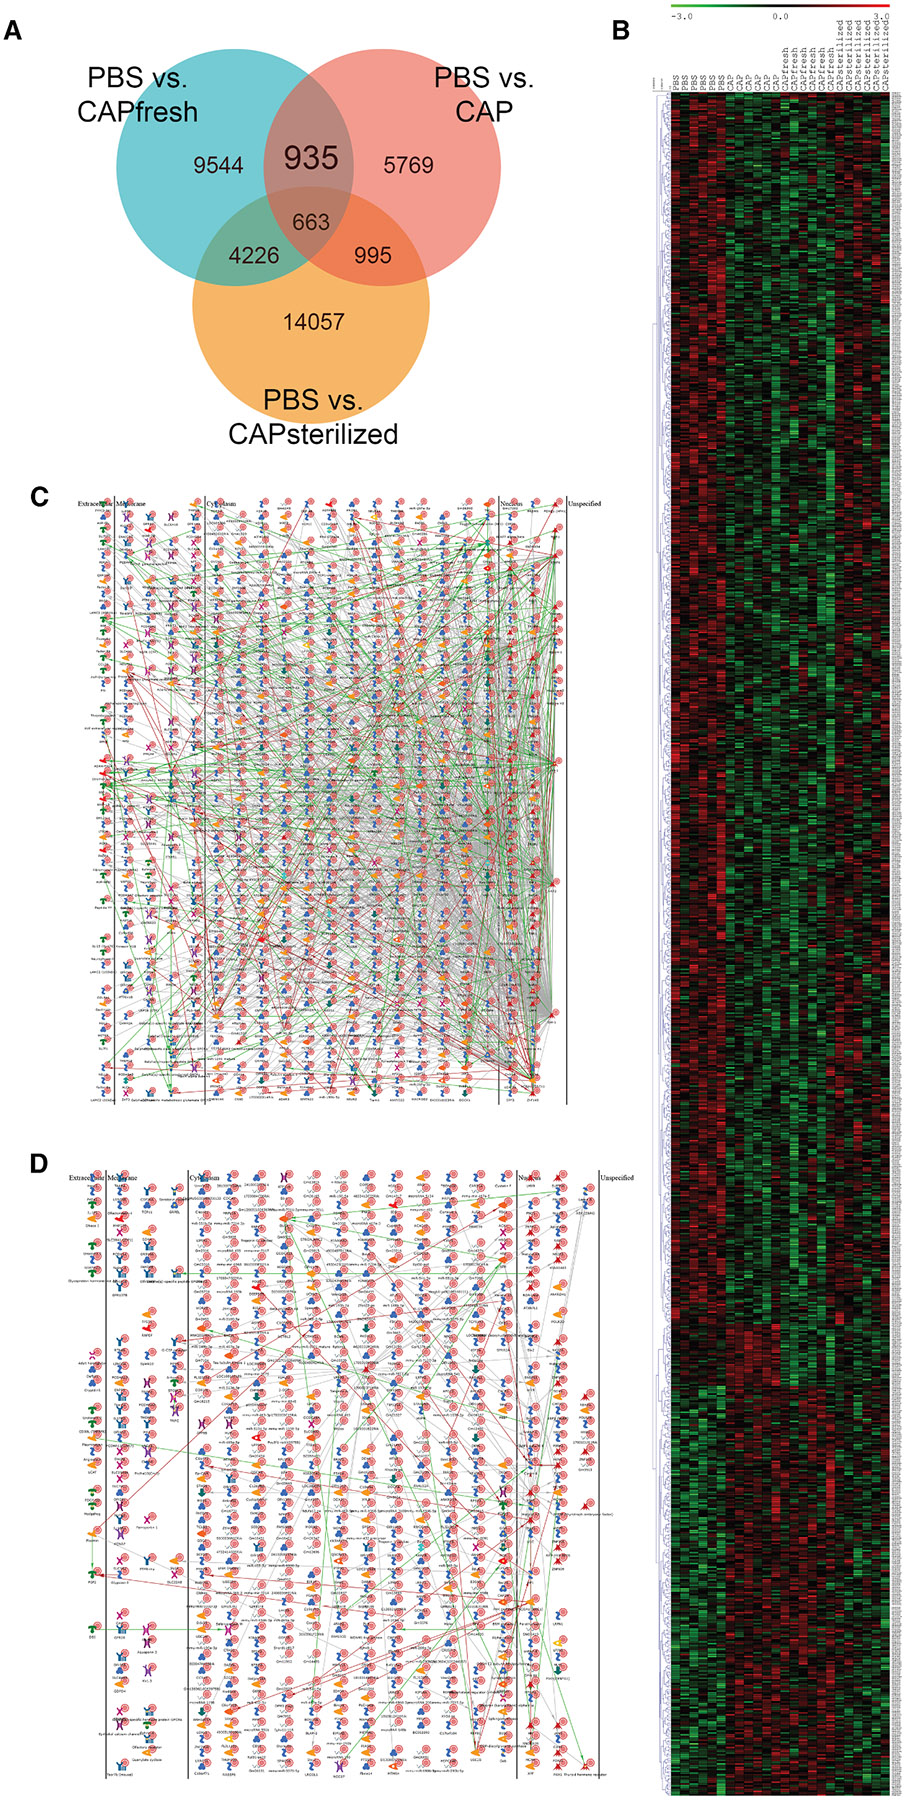
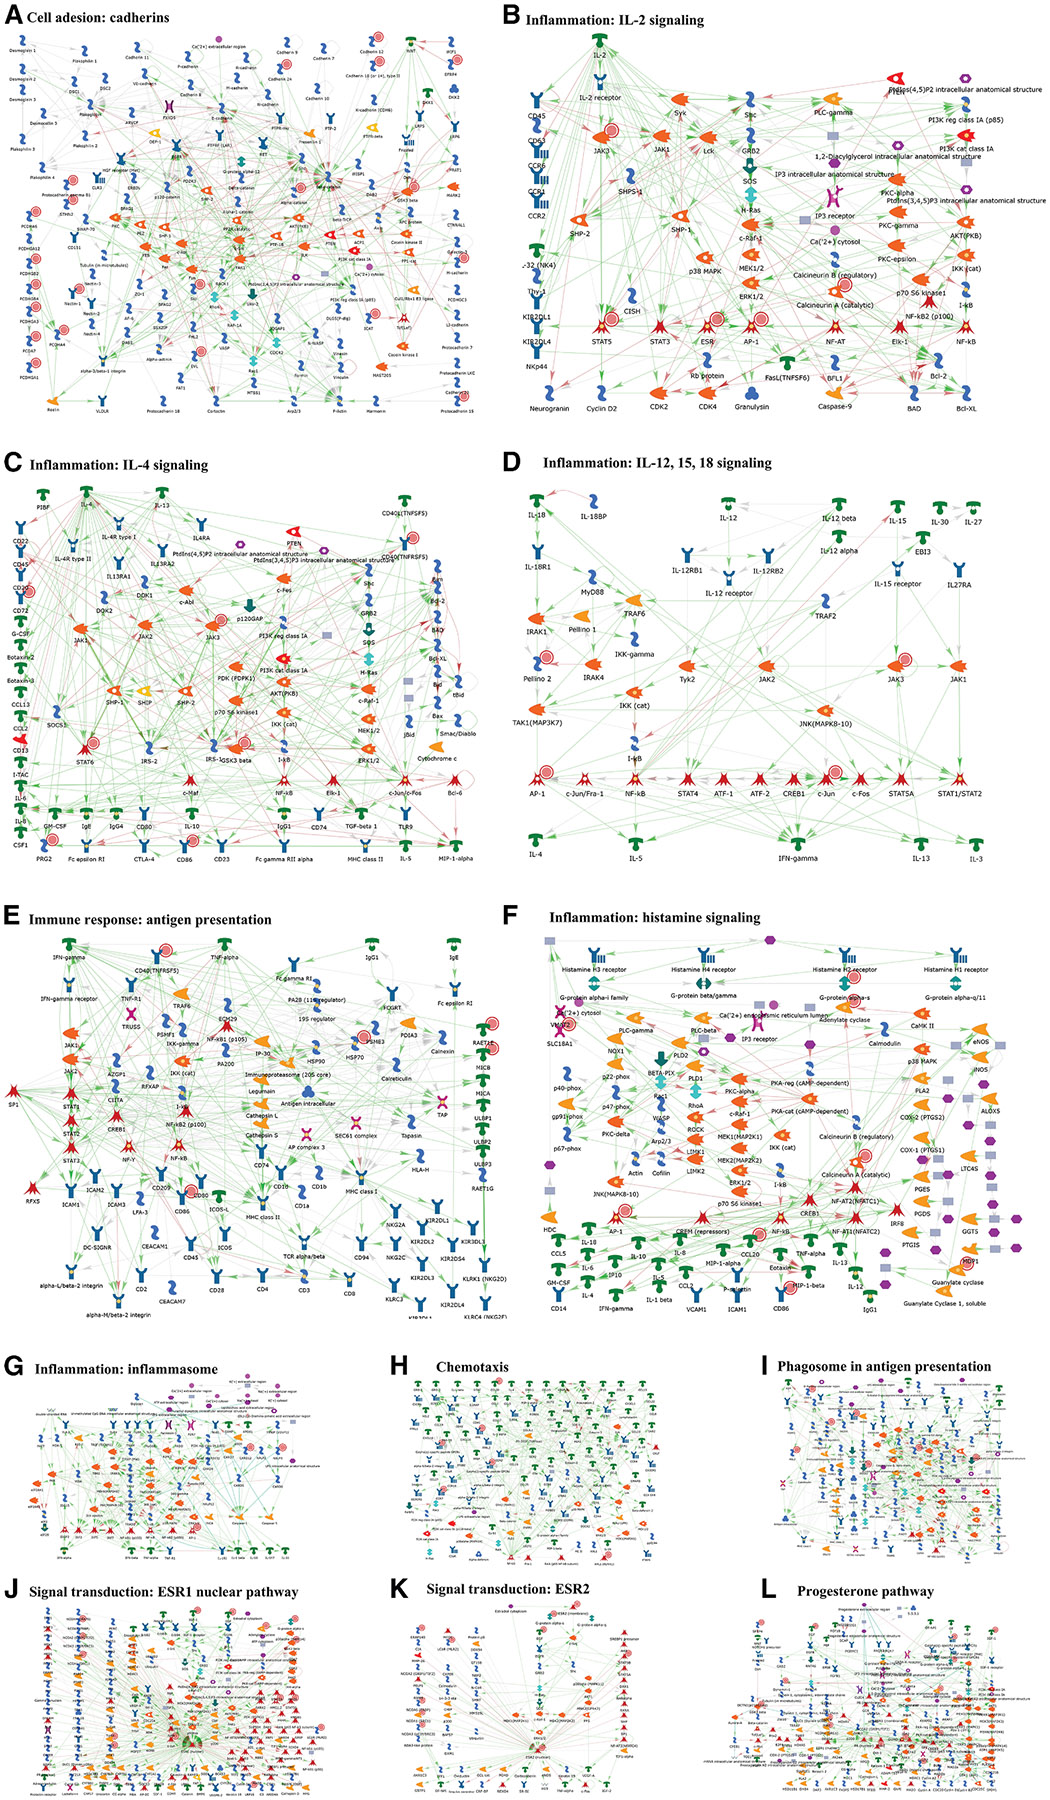
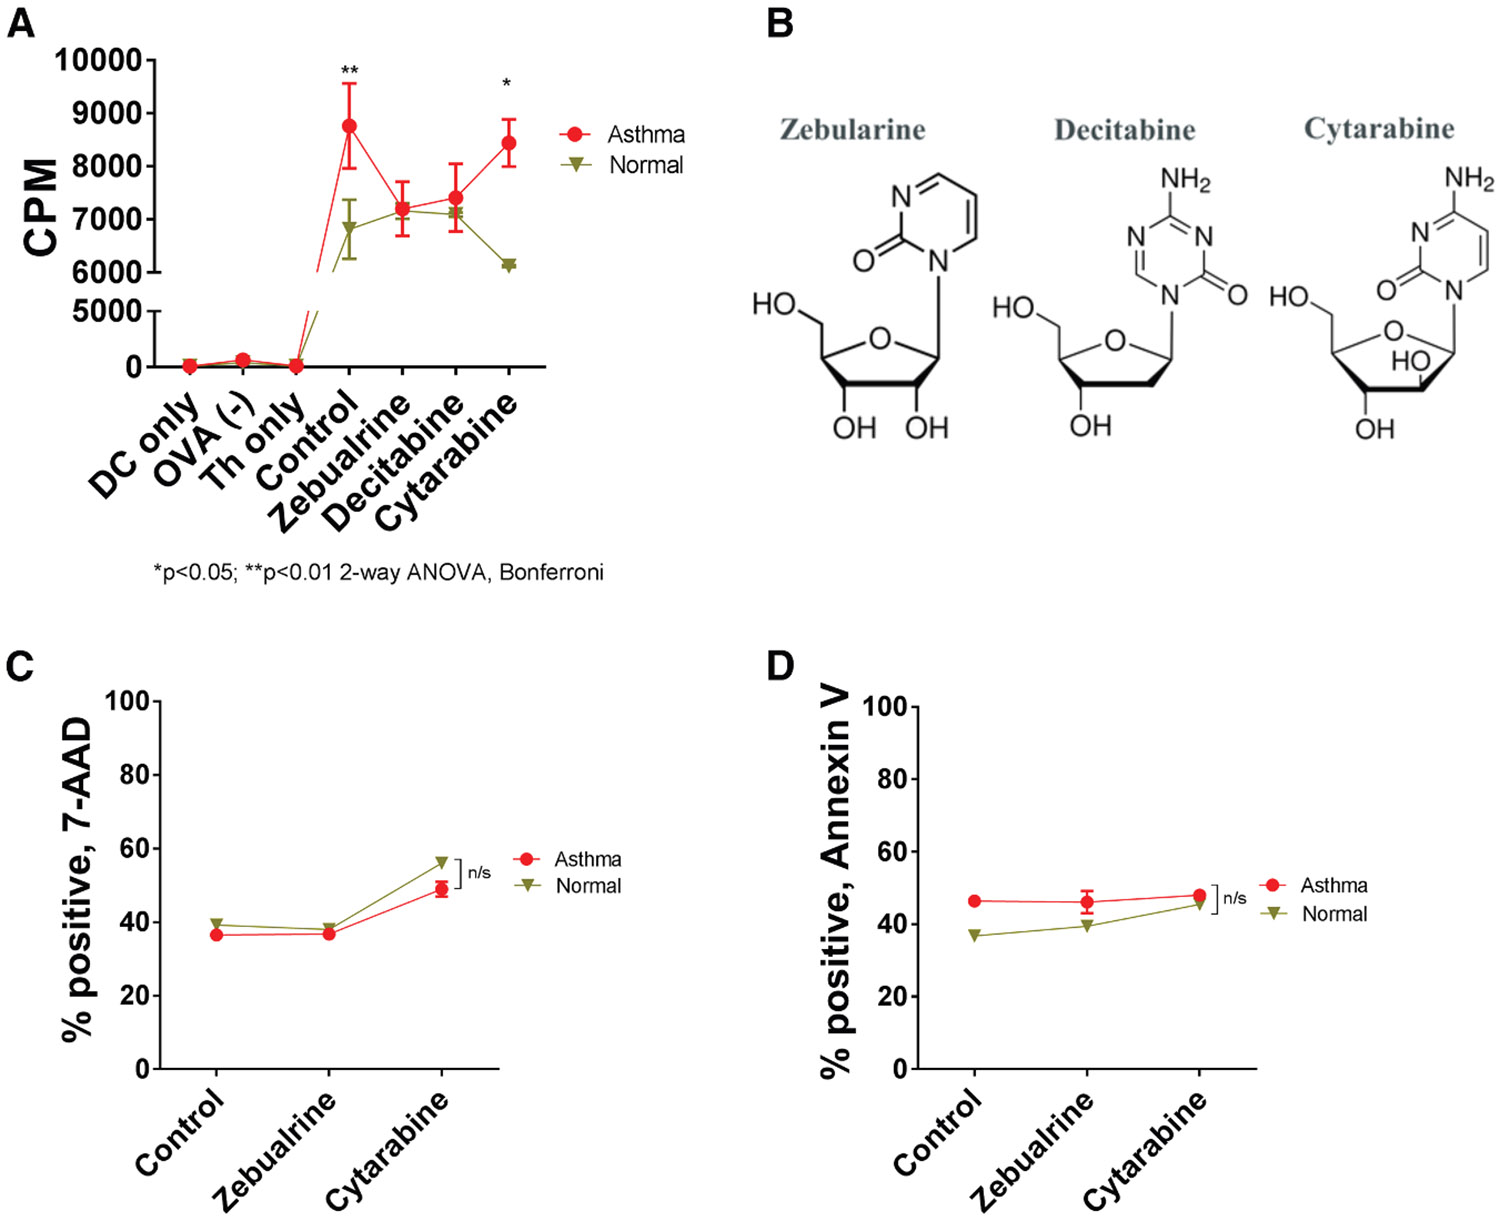
Despite broad knowledge of the pathogenesis, our understanding of the origin of allergy and asthma remains poor, preventing etiotropic treatments. The gut microbiome is seen to be altered in asthmatics; however, proof of causality of the microbiome alterations is lacking. We report on gut microbiome transplantation (GMT) from mice predisposed to asthma by maternal exposure to pro-allergy environmental particles into naive recipients. This GMT confers asthma predisposition, and the effect is abrogated by gamma sterilization of the transplant material or by co-administration of antibacterials, indicating that viable bacteria are mediating the effect. Metagenomics identifies key changes in the "pro-asthma" microbiome, and metabolomics links the identified species to altered production of butyrate known to act on immune cells and epigenetic mechanisms. We further show that transplant recipients develop DNA methylation alterations in dendritic cells. Finally, dendritic cells with an altered methylome present allergen to T cells, and this effect is abrogated by an epigenetically acting drug in vitro.

Keywords: CAP; CP: Immunology; CP: Microbiology; DEP; DNA methylation; GMT; allergy; antibiotics; asthma; concentrated urban air particles; dendritic cells; diesel exhaust particles; epigenetics; gut microbiome transplant; radiation sterilization.


Conflict of interest statement

Declaration of interests The authors declare no competing interests.

Figures

Figure 1.
Figure 1.. Direct and GMT-conferred asthma predisposition effect
(A–E) Direct effects. A maternal model was used to study asthma predisposition after environmental particle exposure (A). Dams are exposed at embryonic day 14 (E14)–E20 days of gestation to particles or vehicle (PBS). Neonates are tested in the “low-dose allergen (Ag, OVA) protocol” with a single intraperitoneal (i.p.) sensitization and 3 daily aerosol challenges (A), which results in lavage eosinophilia (B), cytokine increases (C), and lung tissue infiltration (D and E) (H&E staining, ×100) in neonates of mothers exposed to particulates but not the control. n = 36/experiment (1E n = 12). (F–J) GMT-conferred effects. (F) GMT model. Naive recipients after an antibiotic wipe-out receive GMT (post-natal day 19 [P19] and P20) from the offspring of dams exposed to CAPs, DEPs, or vehicle and are then tested in the low-dose Ag protocol with a single i.p. sensitization (P23) and 3 daily Ag aerosols (P31–P34). D, R1, R2, and R3: collection of microbiome samples for sequencing. (G–K) BAL eosinophils in a representative experiment (G) and the same in 3 additional experiments (H), showing fluctuations per animal cohort, (I) BAL cytokines (pooled data from 3 experiments), (J) representative lung infiltration (H&E staining, ×100; scale bar, 100 μm), and scoring (K). Data are represented as mean ± SEM. *p ≤ 0.05, **p ≤ 0.01, ***p ≤ 0.005, and ****p ≤ 0.0001 (ANOVA with Dunn’s or LSD, as detailed). n = 30–36/experiment.
Figure 2.
Figure 2.. “Live” vs. “dead” GMT effects: sterilization by gamma-radiation or antibacterials
(A) BAL eosinophilia (A1), lung histopathology scoring (A2), and lung tissue micrographs (H&E staining, ×100; scale bar, 100 μm) (A3) in recipients of fresh gut microbiome transplant material or control gut microbiome transplant material (stored overnight on ice) vs. gamma-sterilized gut microbiome transplant material from offspring of CAP- or DEP-exposed (or PBS vehicle control) mothers. (B) Co-administration of the antibiotics Cip/Met with the gut microbiome transplant: BAL eosinophilia (B1), lung histopathology scoring (B2), and lung tissue micrographs (H&E staining, ×100) (B3). *p ≤ 0.05, **p ≤ 0.01, ***p ≤ 0.005, and ****p ≤ 0.0001 (ANOVA with Dunn’s or LSD, as detailed). n = 20–30/experiment. Data are represented as mean ± SEM. See also Figure S1.
Figure 3.
Figure 3.. Pro-asthma GMT material leads to partial gut microbiome remodeling in mice
(A) Maternal microbiome: relative abundance of the top 15 species in the stool of pregnant dams exposed to PBS, CAPs, or DEPs. (B) Offspring microbiome: significantly changed bacterial species that show higher relative abundance in PBS group compared to the CAP and DEP groups. (C) Offspring microbiome: significantly changed species of bacteria that show higher relative abundance in the CAP and DEP groups compared to the PBS group. “D” samples are from donor neonates born to CAP- or DEP-exposed and control mothers, and “R2” and “R3” samples are from recipients after the transplantation (see Figure 1F). Also related to Figure S2.
Figure 4.
Figure 4.. Targeted metabolomic analysis of short chain fatty acids in stool samples of donors and recipients
(A–C) The metabolites tested were butyric acid, isobutyric acid, acetic acid, propanoic acid, isocaproic acid (below detection), and heptanoic acid (below detection). (A) Donor material. (B) R2 recipients. (C) R3 recipients. Butyric acid is depleted in pro-asthma gut microbiome transplant material and in the post-GMT established microbiome. *p ≤ 0.05, **p ≤ 0.01, ***p ≤ 0.0005, and (ANOVA with LSD). n = 30. Data are represented as mean ± SEM.
Figure 5.
Figure 5.. Effect of GMT on the epigenome of host’s DCs
Study groups included offspring born to CAP-exposed mothers (CAP) or PBS control mothers (PBS) and recipients of either a fresh gut microbiome transplant (CAPfresh) or gamma-sterilized gut microbiome transplant (CAPsterilized) from the offspring of CAP-exposed mothers. All mice were age matched and Ag naive. (A) Venn diagram detailing post-ANOVA contrasts. (B) Hierarchical clustering (Pearson, single linkage) of 935 DMLs significant after intersection ANOVA, where PBS vs. CAP and PBS vs. CAPfresh not PBS vs. CAPsterilized criteria were met. (C and D) Network analysis via Metacore, a direct interactions network. Shown are the actual gene list (C) and the control list of 935 random gene names (D). n = 24.
Figure 6.
Figure 6.. Process network enrichment illustrations for the most relevant of the 100 top significant processes that involve gene loci from the 935 DML list
(A–L) Each process network is pre-designed in Metacore; genes from the input list that fall onto a network are labeled with a red circle, which illustrates to what extent each pathway was affected.
Figure 7.
Figure 7.. Allergen presentation in vitro assay
DCs isolated from asthma-predisposed pups were co-cultured with OVA-TCR transgenic CD4+ T helper responders cells. (A) Proliferation of the T helpers was registered in OVA-stimulated co-culture using the radioactive tritium incorporation method and expressed as counts per minute (CPM). DCs from asthma-predisposed pups present OVA as antigen, eliciting increased proliferation of T-helpers, which is not seen with normal control DCs. In vitro pre-treatment with the epigenetically-acting DNMT inhibitors zebularine or decitabine abrogates this effect. (B) A control drug, cytarabine, that is structurally similar but does not have epigenetic action did not have an effect. (C and D) Zebularine (or decitabine, data not shown) did not affect DC viability, whereas cytarabine had a mild effect on both asthma-predisposed and normal DCs. *p ≤ 0.05 - **p ≤ 0.01, ANOVA with Bonferroni. n = 56. Data are represented as mean ± SEM.

Similar articles

References

    1. Masoli M, Fabian D, Holt S, and Beasley R; Global Initiative for Asthma GINA Program (2004). The global burden of asthma: executive summary of the GINA Dissemination Committee Report. Allergy 59, 469–478. 10.1111/j.1398-9995.2004.00526.x. - DOI - PubMed
    1. US CDC. Asthma Surveillance in the United States, 2001–2021. Presentation derived from https://www.cdc.gov/asthma/asthma-prevalence-us-2023-508.pdf on November/22/24. Data are derived from https://www.cdc.gov/asthma-data/about/index.html on 11/22/24.
    1. Roh EJ (2024). Comparison and review of international guidelines for treating asthma in children. Clin. Exp. Pediatr 67, 447–455. 10.3345/cep.2022.01466. - DOI - PMC - PubMed
    1. Meng J-F, and Rosenwasser LJ (2010). Unraveling the Genetic Basis of Asthma and Allergic Diseases. Allergy Asthma Immunol. Res 2, 215–227. 10.4168/aair.2010.2.4.215. - DOI - PMC - PubMed
    1. Dijk FN, Folkersma C, Gruzieva O, Kumar A, Wijga AH, Gehring U, Kull I, Postma DS, Vonk JM, Melén E, and Koppelman GH (2019). Genetic risk scores do not improve asthma prediction in childhood. J. Allergy Clin. Immunol 144, 857–860.e7. 10.1016/j.jaci.2019.05.017. - DOI - PubMed

Substances