Adipocyte metabolic state regulates glial phagocytic function
- PMID: 40372917
- PMCID: PMC12169346
- DOI: 10.1016/j.celrep.2025.115704
Adipocyte metabolic state regulates glial phagocytic function
Abstract
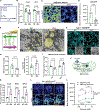
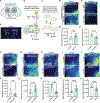
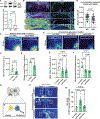
Excess dietary sugar profoundly impacts organismal metabolism and health, yet it remains unclear how metabolic adaptations in adipose tissue influence other organs, including the brain. Here, we show that a high-sugar diet (HSD) in Drosophila reduces adipocyte glycolysis and mitochondrial pyruvate uptake, shifting metabolism toward fatty acid oxidation and ketogenesis. These metabolic changes trigger mitochondrial oxidation and elevate antioxidant responses. Adipocyte-specific manipulations of glycolysis, lipid metabolism, or mitochondrial dynamics non-autonomously modulate Draper expression in brain ensheathing glia, key cells responsible for neuronal debris clearance. Adipocyte-derived ApoB-containing lipoproteins maintain basal Draper levels in glia via LpR1, critical for effective glial phagocytic activity. Accordingly, reducing ApoB or LpR1 impairs glial clearance of degenerating neuronal debris after injury. Collectively, our findings demonstrate that dietary sugar-induced shifts in adipocyte metabolism substantially influence brain health by modulating glial phagocytosis, identifying adipocyte-derived ApoB lipoproteins as essential systemic mediators linking metabolic state with neuroprotective functions.
Keywords: ApoB; CP: Metabolism; CP: Neuroscience; Drosophila; OxPhos; adipokine; glycolysis; high-sugar diet; injury-response; ketogenesis; lipid metabolism; mitochondria; neurodegeneration; pyronic sensor.
Copyright © 2025 The Author(s). Published by Elsevier Inc. All rights reserved.
Conflict of interest statement
Declaration of interests The authors declare no competing interests.
Figures


Update of
-
Adipocyte metabolic state regulates glial phagocytic function.bioRxiv [Preprint]. 2024 Sep 24:2024.09.24.614765. doi: 10.1101/2024.09.24.614765. bioRxiv. 2024. Update in: Cell Rep. 2025 May 27;44(5):115704. doi: 10.1016/j.celrep.2025.115704. PMID: 39386724 Free PMC article. Updated. Preprint.
Similar articles
-
Adipocyte metabolic state regulates glial phagocytic function.bioRxiv [Preprint]. 2024 Sep 24:2024.09.24.614765. doi: 10.1101/2024.09.24.614765. bioRxiv. 2024. Update in: Cell Rep. 2025 May 27;44(5):115704. doi: 10.1016/j.celrep.2025.115704. PMID: 39386724 Free PMC article. Updated. Preprint.
-
Diet-induced glial insulin resistance impairs the clearance of neuronal debris in Drosophila brain.PLoS Biol. 2023 Nov 7;21(11):e3002359. doi: 10.1371/journal.pbio.3002359. eCollection 2023 Nov. PLoS Biol. 2023. PMID: 37934726 Free PMC article.
-
Insulin-like Signaling Promotes Glial Phagocytic Clearance of Degenerating Axons through Regulation of Draper.Cell Rep. 2016 Aug 16;16(7):1838-50. doi: 10.1016/j.celrep.2016.07.022. Epub 2016 Aug 4. Cell Rep. 2016. PMID: 27498858 Free PMC article.
-
Glial phagocytosis in developing and mature Drosophila CNS: tight regulation for a healthy brain.Curr Opin Immunol. 2020 Feb;62:62-68. doi: 10.1016/j.coi.2019.11.010. Epub 2019 Dec 18. Curr Opin Immunol. 2020. PMID: 31862622 Review.
-
Adipocyte Mitochondria: Deciphering Energetic Functions across Fat Depots in Obesity and Type 2 Diabetes.Int J Mol Sci. 2024 Jun 18;25(12):6681. doi: 10.3390/ijms25126681. Int J Mol Sci. 2024. PMID: 38928386 Free PMC article. Review.
Cited by
-
The ABCs of lipid exposure in maintaining neural health.Trends Neurosci. 2025 Jul;48(7):461-463. doi: 10.1016/j.tins.2025.05.011. Epub 2025 Jun 5. Trends Neurosci. 2025. PMID: 40480929
-
Inter-organ communication in Drosophila: Lipoproteins, adipokines, and immune-metabolic coordination.Curr Opin Cell Biol. 2025 Jun;94:102508. doi: 10.1016/j.ceb.2025.102508. Epub 2025 Apr 4. Curr Opin Cell Biol. 2025. PMID: 40187050 Review.
References
MeSH terms
Substances
Grants and funding
LinkOut - more resources
Full Text Sources
Molecular Biology Databases
Miscellaneous

