. 2025 May 15;21(5):e1012885.
doi: 10.1371/journal.ppat.1012885. eCollection 2025 May.

Rev-RRE activity modulates HIV-1 replication and latency reactivation: Implications for viral persistence and cure strategies

Affiliations

Rev-RRE activity modulates HIV-1 replication and latency reactivation: Implications for viral persistence and cure strategies

Godfrey A Dzhivhuho et al. PLoS Pathog. .

Abstract

The HIV-1 Rev-RRE regulatory axis plays a crucial role in viral replication by facilitating the nucleo-cytoplasmic export and expression of viral mRNAs with retained introns. In this study, we investigated the impact of variation in Rev-RRE functional activity on HIV-1 replication kinetics and reactivation from latency. Using a novel HIV-1 viral vector with an interchangeable Rev cassette, we engineered viruses with two diverse Rev functional activities and demonstrated that higher Rev-RRE activity confers greater viral replication capacity while maintaining a constant level of Nef expression. In addition, a low Rev activity virus rapidly acquired a compensatory mutation in the RRE that significantly increased Rev-RRE activity and replication. In a latency model, proviruses with differing Rev-RRE activity levels varied in the efficiency of viral reactivation, affecting both initial viral release and subsequent replication kinetics. These results demonstrate that activity differences in the Rev-RRE axis among different viral isolates have important implications for HIV replication dynamics and persistence. Importantly, our findings indicate that bolstering Rev/RRE activity could be explored as part of latency reversal strategies in HIV cure efforts.


Conflict of interest statement

The authors have declared that no competing interests exist

Figures
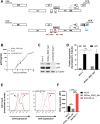
Fig 1
Fig 1. Construction and characterization of an HIV proviral clone with an interchangeable rev gene.
(A) Schematic of HIV proviral constructs. Upper panel: original NL4-3. Lower panel: modified NLRev_IRES_Nef. The native rev gene was silenced by start codon mutation (AUG to ACG) and stop codon introduction at position 23 (UAC to UAA). An NL4-3 rev cDNA cassette with an IRES was inserted upstream of nef, flanked by restriction sites for easy exchange. (B) SupT1 cells were infected with NL4-3 (black line) and NLRev_IRES_Nef (grey line) viruses at an MOI of 0.005. Viral replication was monitored by p24 ELISA of culture supernatants over time. (C) Representative Western blot analysis of p24 and Nef expression in SupT1 cells infected with NL4-3 or NLRev_IRES_Nef viruses at day 8 post-infection. Beta-tubulin was used as a loading control. (D) Quantification of Nef (grey bar) and p24 (black bar) expression from Western blot analysis. (E) Overlaid histograms of CD4 expression in SupT1 cells infected (day 8) with NL4-3 (black), NLRev_IRES_Nef (gray), or a Nef-negative NL4-3 control (red). Histograms are gated on p24 ⁺ cells, demonstrating the relative reduction in CD4 surface levels. (F) Quantification of CD4 downmodulation from (E). Bars represent mean ± SD from three independent experiments. Statistical significance was determined by an unpaired, two-tailed t-test with FDR correction (**p < 0.01, ***p < 0.001, ****p < 0.0001). Error bars in (B) represent mean ± SEM of three independent experiments, while error bars in (D) and (F) represent mean ± SD of three independent experiments.
Fig 2
Fig 2. Viruses with low Rev functional activity replicate poorly compared to viruses with high Rev functional activity.
(A) SupT1 cells were infected with 8-GRev_IRES_Nef (low Rev activity) (blue), 9-GRev_IRES_Nef (high Rev activity) (green), and NLRev_IRES_Nef (control) (grey) viruses at an MOI of 0.005. Viral replication was assessed by p24 ELISA of culture supernatants over time. (B) Western blot analysis of Nef and p24 expression in infected cells at day 8 post-infection. Beta-tubulin was used as a loading control. (C) Quantification of Nef and p24 expression from Western blot analysis in B, normalized to beta-tubulin. (D) Histograms of CD4 expression on SupT1 cells (day 8) infected with 8-GRev_IRES_Nef, 9-GRev_IRES_Nef, or NLRev_IRES_Nef, compared to a Nef-negative NL4–3 control. (E) Quantification of CD4 downmodulation from (D), relative to the Nef-negative control. (F) SupT1 cells were co-infected with 8-GRev_IRES_Nef and 9-GRev_IRES_Nef viruses at an MOI of 0.005 each. Left panel: Representative gel image showing PCR products of cellular DNA targeting Rev at days 1, 3, 5, and 7 post-infection. Right panel: PCR plasmid controls. (G) Quantification of relative proviral DNA levels from the competition assay. Bars represent the ratio of 9-GRev_IRES_Nef to 8-GRev_IRES_Nef proviral DNA at each time point. Error bars in (A) represent mean ± SEM of three independent experiments, while those in (C), (E), and (G) represent mean ± SD of three independent experiments. Statistical significance was calculated using an unpaired, two-tailed t-test with FDR correction (*p < 0.05, **p < 0.01, ***p < 0.001, ****p < 0.0001).
Fig 3
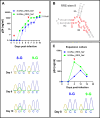
Fig 3. Extended passage of the low Rev activity 8-GRev_IRES_Nef virus selects for a single nucleotide change in the RRE that enhances viral replication.
(A) Extended replication kinetics of 8-GRev_IRES_Nef and 9-GRev_IRES_Nef viruses in SupT1 cells. Top: Replication curve showing p24 levels measured by ELISA over time. Red arrows indicate timepoints when the RRE was sequenced from the culture cells. Bottom: Sanger sequencing chromatograms of the RRE region from infected cells at days 1, 6, and 10 post-infection, revealing the emergence of the C7214T mutation. (B) Schematic representation of the HIV-1 RRE stem II region, highlighting the location of the C7214T mutation observed in the 8-GRev_IRES_Nef virus. This figure is adapted from Jayaraman et al. [34], (Fig 1—figure supplement 1B; https://doi.org/10.7554/eLife.04120.004) under the CC BY 4.0 license. The binding site of Rev is highlighted in red, and an arrow showing the position of the C7214T mutation has been added. (C) Characterization of the viral expansion stock. Top: Growth curve of the viral expansion stock in SupT1 cells, showing p24 levels measured by ELISA for 8-GRev_IRES_Nef and 9-GRev_IRES_Nef viruses. Bottom: Sanger sequencing chromatograms of the RRE region from SupT1 bulk culture cells used to produce viral expansion stocks at day 8 post-infection. Error bars in growth curves represent mean ± SEM of three independent experiments. Sequencing chromatograms are representative of three independent experiments.
Fig 4
Fig 4. The C7214T mutation in the RRE enhances Rev-RRE dependent viral gene expression and viral replication.
(A) 293T cells were co-transfected with a GFP reporter construct containing either the wild-type NL4-3 RRE or the C7214T mutant RRE, along with varying amounts of 8-G Rev expression plasmid. GFP mean fluorescence intensity (MFI) was measured by flow cytometry. (B) The Rev-RRE functional assay was performed as in (A) using 9-G Rev. (C) SupT1 cells were infected with 8-GRev_IRES_Nef and C7214T-mut8-GRev_IRES_Nef viruses at equal MOIs. Viral replication was monitored by p24 ELISA of culture supernatants over time. (D) Replication kinetics of 9-GRev_IRES_Nef and C7214T-mut9-GRev_IRES_Nef viruses were performed as in (C). (E) Comparison of replication kinetics between C7214T-mut8-GRev and 9-GRev_IRES_Nef viruses. SupT1 cells were infected with equal MOIs of each virus. Viral replication was monitored by p24 ELISA of culture supernatants over time. Error bars in panels A and B represent mean ± SD from three independent experiments. Statistical analysis was performed using unpaired, two-tailed t-test with FDR correction for multiple comparisons (**p < 0.01, ***p < 0.001, ****p < 0.0001).
Fig 5
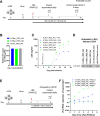
Fig 5. The high Rev-RRE activity viruses exhibits enhanced reactivation from latency and increased viral release compared to low Rev-RRE activity virus.
(A) Schematic of the latency model and reactivation experiment. Resting primary CD4 + T cells were infected with 8-GRev_IRES_Nef, 9-GRev_IRES_Nef, or NLRev_IRES_Nef viruses. On day 3 post-infection, cells were treated with latency reversing agents (LRA: PHA + IL-2) or left untreated. Culture supernatants were collected through day 17 post-infection. (B) Quantification of integrated provirus in infected resting CD4 + T cells 24 hours post-infection, measured by Alu-gag PCR. (C) Viral reactivation kinetics following LRA treatment. P24 levels in culture supernatants were measured by ELISA over time. Plotted p24 values represent corrected concentrations that account for the residual 50 µ L of supernatant left behind after each media change. (D) Confirmation of integrated provirus in non-reactivated cells. A gel-based Alu-LTR PCR followed by LTR-RU5 amplification was used to qualitatively confirm the presence of integrated HIV-1 in cells that did not receive LRA at day 17 post-infection. This semi-quantitative assay indicates that cells remained latently infected without reactivation. (E) Schematic of the reactivation experiment without reinfection. Resting CD4 + T cells were infected with 8-GRev_IRES_Nef or 9-GRev_IRES_Nef viruses, treated with LRA or vehicle at day 3, and AZT was added to prevent reinfection. (F) Viral RNA copies/mL were measured by qRT-PCR using a standard curve derived from known amounts of NL4-3 RNA. Data represents mean ± SD from three independent experiments for panel B, mean ± SD from two independent experiments for panel C, and panel F. A and E were created in BioRender (Dzhivhuho, G., 2025; https://BioRender.com/ak85scu).

Update of

References

    1. Bray M, Prasad S, Dubay JW, Hunter E, Jeang KT, Rekosh D, et al.. A small element from the Mason-Pfizer monkey virus genome makes human immunodeficiency virus type 1 expression and replication Rev-independent. Proc Natl Acad Sci U S A. 1994;91(4):1256–60. doi: 10.1073/pnas.91.4.1256 - DOI - PMC - PubMed
    1. Rekosh D, Hammarskjold ML. Intron retention in viruses and cellular genes: Detention, border controls and passports. Wiley Interdisciplinary Reviews RNA. 2018;9(3):e1470. - PMC - PubMed
    1. Hadzopoulou-Cladaras M, Felber BK, Cladaras C, Athanassopoulos A, Tse A, Pavlakis GN. The rev (trs/art) protein of human immunodeficiency virus type 1 affects viral mRNA and protein expression via a cis-acting sequence in the env region. J Virol. 1989;63(3):1265–74. doi: 10.1128/JVI.63.3.1265-1274.1989 - DOI - PMC - PubMed
    1. Hammarskjöld ML, Heimer J, Hammarskjöld B, Sangwan I, Albert L, Rekosh D. Regulation of human immunodeficiency virus env expression by the rev gene product. J Virol. 1989;63(5):1959–66. doi: 10.1128/JVI.63.5.1959-1966.1989 - DOI - PMC - PubMed
    1. Malim MH, Hauber J, Le SY, Maizel JV, Cullen BR. The HIV-1 rev trans-activator acts through a structured target sequence to activate nuclear export of unspliced viral mRNA. Nature. 1989;338(6212):254–7. doi: 10.1038/338254a0 - DOI - PubMed

MeSH terms

Substances