. 2025 May 15;20(5):e0323513.
doi: 10.1371/journal.pone.0323513. eCollection 2025.

Microglia remodeling in the visual thalamus of the DBA/2J mouse model of glaucoma

Affiliations

Microglia remodeling in the visual thalamus of the DBA/2J mouse model of glaucoma

Jennifer L Thompson et al. PLoS One. .

Abstract

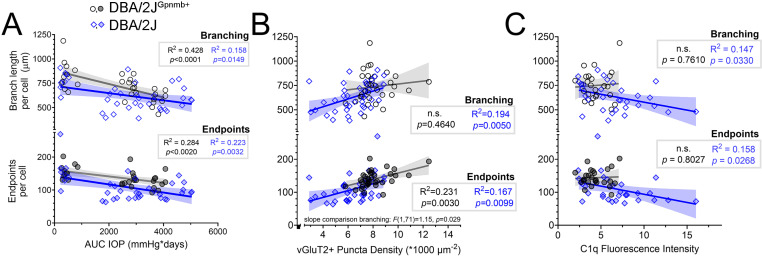
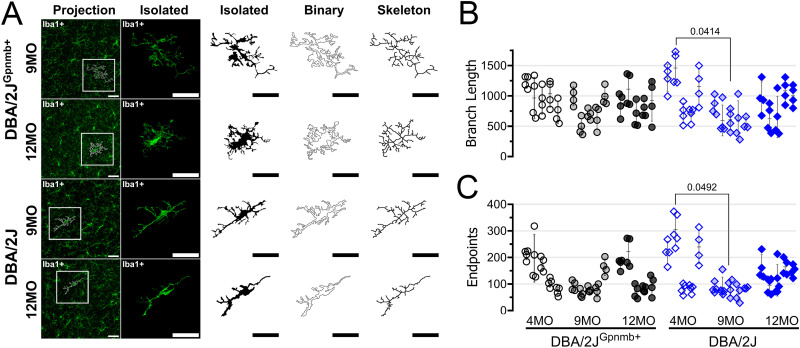
Microglia are the resident immune cells of the central nervous system and mediate a broad array of adaptations during disease, injury, and development. Typically, microglia morphology is understood to provide a window into their function and microglia have the capacity to adopt a broad spectrum of functional phenotypes characterized by numerous morphologies and gene expression profiles. Glaucoma, which leads to blindness from retinal ganglion cell (RGC) degeneration, is commonly associated with elevated intraocular pressure (IOP) and triggers microglia responses within the retinal layers, at the optic nerve head, and in retinal projection targets in the brain. The goal of this study was to determine the relationship of microglia morphology to intraocular pressure and the loss of RGC output synapses in the dorsolateral geniculate nucleus (dLGN), a RGC projection target in the thalamus that conveys information to the primary visual cortex. We accomplished this by analyzing microglia morphologies in dLGN sections from DBA/2J mice, which develop a form of inherited glaucoma, at 4, 9, and 12 months of age, representing distinct time points in disease progression. Microglia morphology was analyzed using skeletonized Iba1 fluorescence images and fractal analyses of individually reconstructed microglia cells. We found that microglia in older DBA/2J mice adopted simplified morphologies, characterized by fewer endpoints and less total process length per microglia cell. There was an age-dependent shift in microglia morphology in tissue from control mice (DBA/2JGpnmb+) that was accelerated in DBA/2J mice. Measurements of microglia morphology correlated with cumulative IOP, immunofluorescence labeling for complement component C1q, and vGluT2-labeled RGC axon terminal density. Additionally, fractal analysis revealed a clear distinction between control and glaucomatous dLGN, with microglia from ocular hypertensive DBA/2J dLGN tissue showing an elongated rod-like morphology. RNA-sequencing of dLGN showed an upregulation of immune system-related genes. These results suggest that microglia in the dLGN alter their physiology to respond to RGC degeneration in glaucoma, potentially contributing to CNS adaptations to neurodegenerative vision loss.


Conflict of interest statement

The authors have declared that no competing interests exist.

Figures

Fig 1
Fig 1. Intraocular pressure measurements in DBA/2J mice.
(A) Experimental design indicating timing of IOP measurements and tissue collection. (B) IOP measured in individual eyes (left and right) from mice included in the present study. (C) Group data of final left eye IOP measurements taken before tissue collection. The p-values represent pairwise Tukey’s multiple comparison tests following two-way ANOVA. (D) Scatter plot and linear regression of integrated IOP [AUC(IOP)] from left and right eyes. Shaded region represents 95% confidence interval.
Fig 2
Fig 2. Eye pressure-associated loss of vGluT2+ puncta in the DBA/2J dLGN.
(A) 2-photon microscopy images of vGluT2+ RGC axon terminals from dLGN core and detected puncta. vGluT2+ dLGN TC neuron somas are more apparent with decline in punctate RGC axon terminal staining in 9- and 12-month-old DBA/2J images. Scale bar = 100 μm. (B) Group data of mean vGluT2+ densities factored by age and strain along with the results of significant (p < 0.05) pairwise Šidák’s multiple comparison test comparisons. (C) Scatter plot of vGluT2+ puncta densities as a function of AUC(IOP) for each strain. Simple linear regressions were used to test associations between plotting factors and slopes from each genotype differed. Shaded area around regression line represents the 95% confidence interval. (D) Maximum intensity projections of dLGN sections showing neurons labeled using anti-NeuN immunolabeling from 12mo DBA/2J and DBA/2JGpnmb+. (E) Group data of NeuN-labeled cell density analysis showing there was no detectable difference between groups (p = 0.55, unpaired t-test).
Fig 3
Fig 3. C1q intensity increases as a function of age and eye pressure in DBA/2J dLGNs.
(A) Representative images of anti-C1q immunostaining of dLGN tissue obtained from 4-, 9-, and 12-month-old DBA/2J and DBA/2JGpnmb+ mice (scale bar = 20 μm). (B) Bar graph factoring age and strain into peak C1q fluorescence intensities that were measured within the highest-expressing plane of C1q-stained dLGN volumetric images. Bar height and error bar represent the mean±SD. Sample size (number of mice) for each condition are located within bars. Significant (p < 0.05) pair-wise comparisons (two-tailed, Šidák-corrected multiple comparison tests) are shown with p-values. (C) Individual C1q intensities plotted against their corresponding IOP integrals for each strain, overlaid with line fits and 95% confidence intervals resulting from simple linear regressions and follow-up slope comparisons. (D) Scatterplot of C1q intensity as a function of vGluT2+ puncta density in DBA/2J and DBA/2JGpnmb+ dLGNs with linear regression outputs and follow-up slope comparison results.
Fig 4
Fig 4. Morphology of DBA/2J dLGN-resident microglia at glaucoma-relevant time points.
(A) Representative maximum intensity projections of 2-photon-acquired image stacks (z-depth: 40 μm) for visualizing dLGN-resident microglia (Iba1 immunostained) in 4-, 9-, and 12-month-old DBA/2J and DBA/2JGpnmb+ controls. Scale bar: = 100 µm. (B) Group data showing the number of microglia contained within each volumetric dLGN image stack for 39 DBA/2J (blue, diamonds) and 36 DBA/2JGpnmb+ (gray, circles) mice. Pairwise comparisons are p-values from Šidák-corrected multiple comparison tests. (C) Illustrative workflow showing skeletonization of Iba1 images and analysis of total microglia branch lengths and quantification of endpoints to investigate microglia morphology. (D) Group data of microglia branch length from the skeleton analysis. Pairwise comparisons are p-values from Šidák-corrected multiple comparison tests. (E) Group data of microglia endpoints from the skeleton analysis. Pairwise comparisons are p-values from Šidák-corrected multiple comparison tests.
Fig 5
Fig 5. DBA/2J glaucoma is accompanied by age- and eye pressure-associated changes to microglia morphology within the visual thalamus.
(A) Scatterplots and linear regressions of microglia branch length and endpoints per cell from skeleton analysis plotted against AUC(IOP). Shaded area represents the 95% confidence interval. Black circles: DBA/2JGpnmb+ controls. Blue diamonds: DBA/2J. (B) Scatterplots and linear regressions, as in A of microglia skeleton parameters plotted against vGluT2 puncta density. (C) Scatterplots and linear regressions of microglia parameters plotted against C1q fluorescence intensity.
Fig 6
Fig 6. Reconstruction of individual microglia morphology.
(A) Example images and reconstruction of randomly-selected Iba1 immunolabeled microglia from 9- and 12-month old (MO) dLGN sections from DBA/2JGpnmb+ and DBA/2J mice. (B & C) Skeleton analysis of branch length and endpoints of four individual microglia cells per mouse. Each column of data points contains four cells from a single animal. Pairwise comparisons represent significant (p < 0.05) p-values from Šidák-corrected multiple comparison tests.
Fig 7
Fig 7. Fractal analysis of microglia morphology reveals a shift toward rod-like microglia morphology in aged DBA/2J mice.
(A) Plot of microglia perimeter (# pixels) output of the FracLac analysis from four randomly selected and manually-reconstructed microglia cells per mouse of DBA/2JGpnmb+ controls (black circles) and DBA/2J mice (blue diamonds) at 4, 9, and 12 months of age. Each column of data points corresponds to measurements from a single animal. (B) Scatterplot and simple linear regression of microglia perimeter measurements averaged from individual animals plotted against AUC(IOP). Shaded area represents the 95% confidence intervals. (C & D) Similar to A and B, plotting the FracLac parameter “Fractal Dimension” (Df). Pairwise comparisons represent significant (p < 0.05) results of Šidák multiple comparison tests following a nested one-way ANOVA (p < 0.0001). (E–H) Similar analyses as A-D for FracLac parameters “Span Ratio” and “Circularity Index”.
Fig 8
Fig 8. Alterations in gene expression in the dLGN of DBA/2J mice revealed by RNA sequencing.
(A) Intraocular pressure measurements from DBA/2JGpnmb+ (n = 18 eyes, 9 mice) and DBA/2J (n = 30 eyes,15 mice. (B) Volcano plot of 33,064 genes showing 77 that were significantly upregulated and 7 that were significantly downregulated in the 9 month-old DBA/2J dLGN relative to the age-matched controls. Significantly up- or down-regulated genes were identified by criteria of a 1.5-fold change and false discovery rate-corrected p-value < 0.05. dLGN tissue from three mice was pooled for each sample (DBA/2J: 5 samples, 15 mice; DBA/2JGpnmb+: 3 samples, 9 mice) (C) Up- and down-regulated genes with involvement in immune- and neurotrophin-related processes. (D) Gene ontology enrichment analysis of differentially expressed genes. (E) Kyoto Encyclopedia of Genes and Genomes (KEGG) enrichment analysis.

Similar articles

References

    1. Flaxman SR, Bourne RRA, Resnikoff S, Ackland P, Braithwaite T, Cicinelli MV, et al.. Global causes of blindness and distance vision impairment 1990-2020: a systematic review and meta-analysis. Lancet Glob Health. 2017;5(12):e1221–34. doi: 10.1016/S2214-109X(17)30393-5 - DOI - PubMed
    1. Lommatzsch C, van Oterendorp C. Current Status and Future Perspectives of Optic Nerve Imaging in Glaucoma. J Clin Med. 2024;13(7):1966. doi: 10.3390/jcm13071966 - DOI - PMC - PubMed
    1. Quigley HA, Broman AT. The number of people with glaucoma worldwide in 2010 and 2020. Br J Ophthalmol. 2006;90(3):262–7. doi: 10.1136/bjo.2005.081224 - DOI - PMC - PubMed
    1. Tham Y-C, Li X, Wong TY, Quigley HA, Aung T, Cheng C-Y. Global prevalence of glaucoma and projections of glaucoma burden through 2040: a systematic review and meta-analysis. Ophthalmology. 2014;121(11):2081–90. doi: 10.1016/j.ophtha.2014.05.013 - DOI - PubMed
    1. Weinreb RN, Aung T, Medeiros FA. The pathophysiology and treatment of glaucoma: a review. JAMA. 2014;311(18):1901–11. doi: 10.1001/jama.2014.3192 - DOI - PMC - PubMed

LinkOut - more resources