. 2025 May 9;37(5):koaf121.
doi: 10.1093/plcell/koaf121.

LIPID DROPLET PROTEIN OF SEEDS is involved in the control of lipid droplet size in Arabidopsis seeds and seedlings

Affiliations

LIPID DROPLET PROTEIN OF SEEDS is involved in the control of lipid droplet size in Arabidopsis seeds and seedlings

Nathan M Doner et al. Plant Cell. .

Abstract

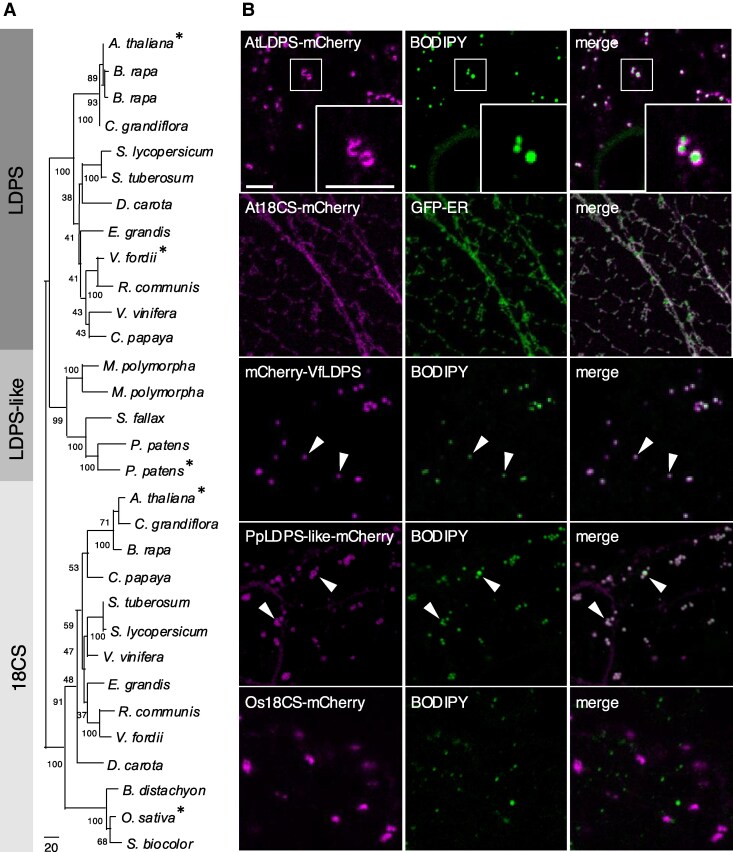
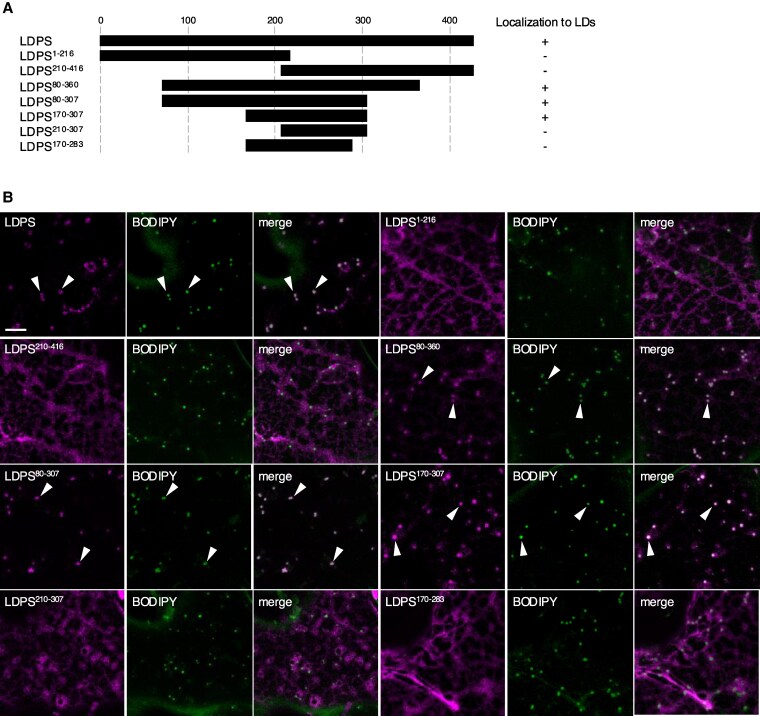
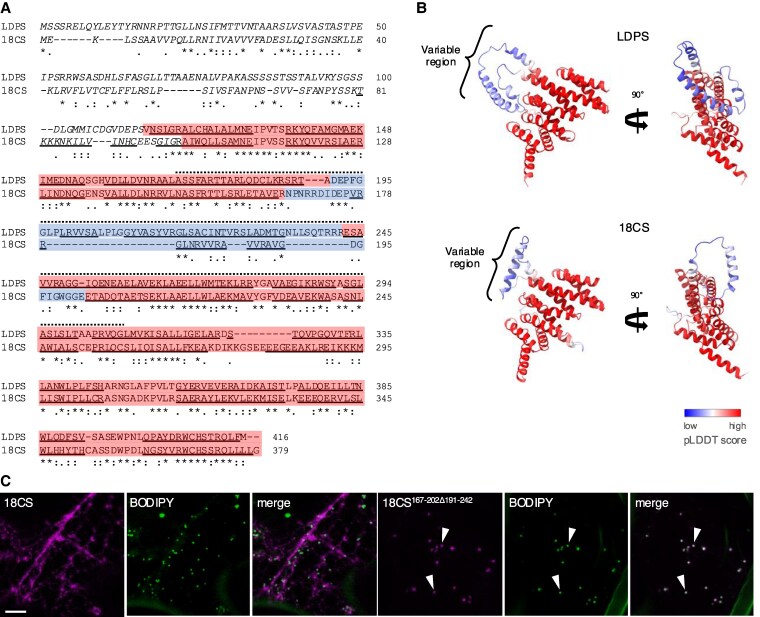
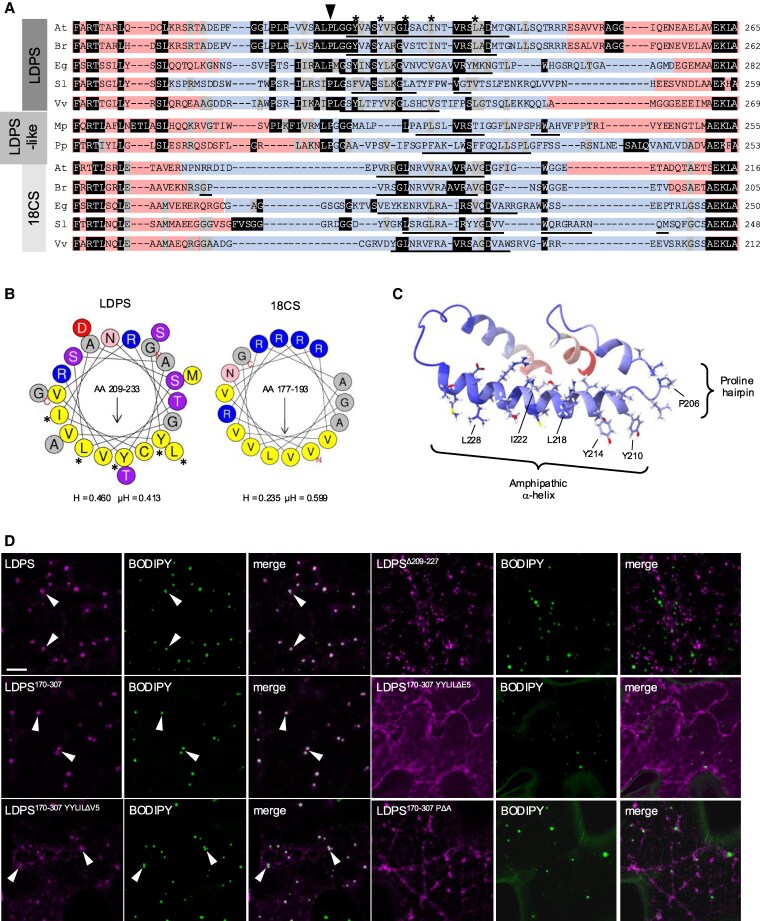
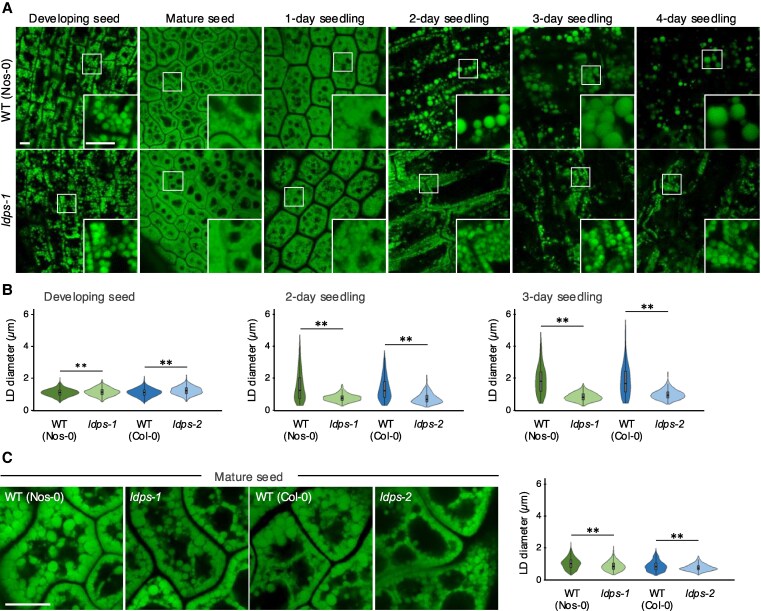
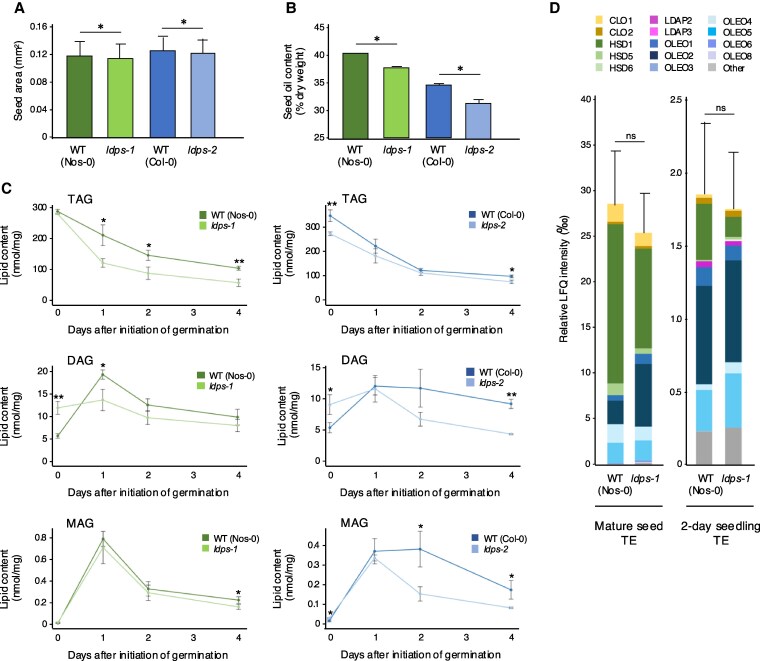
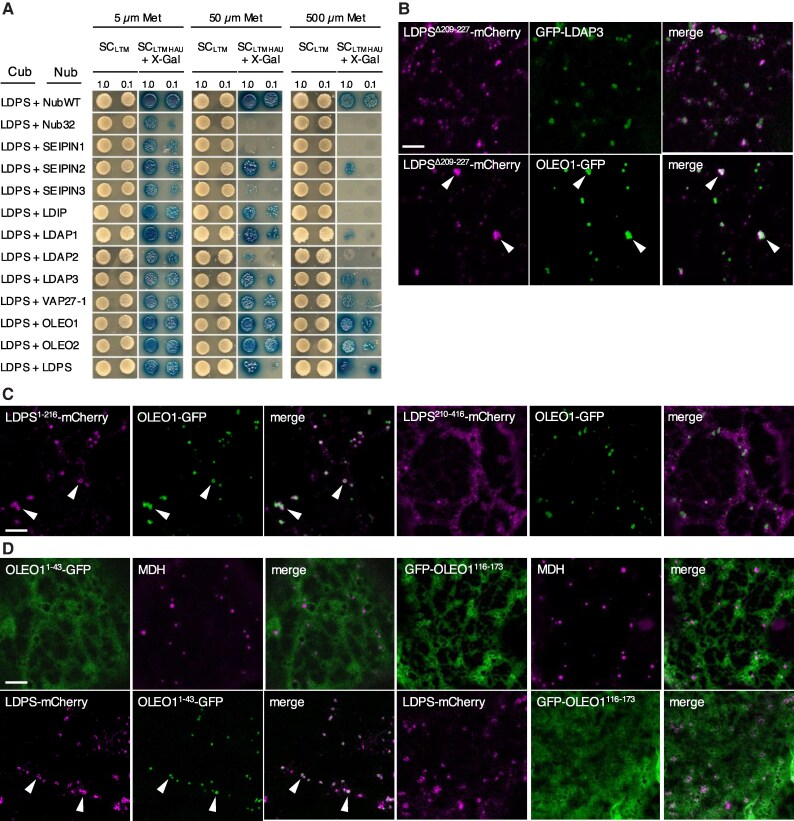
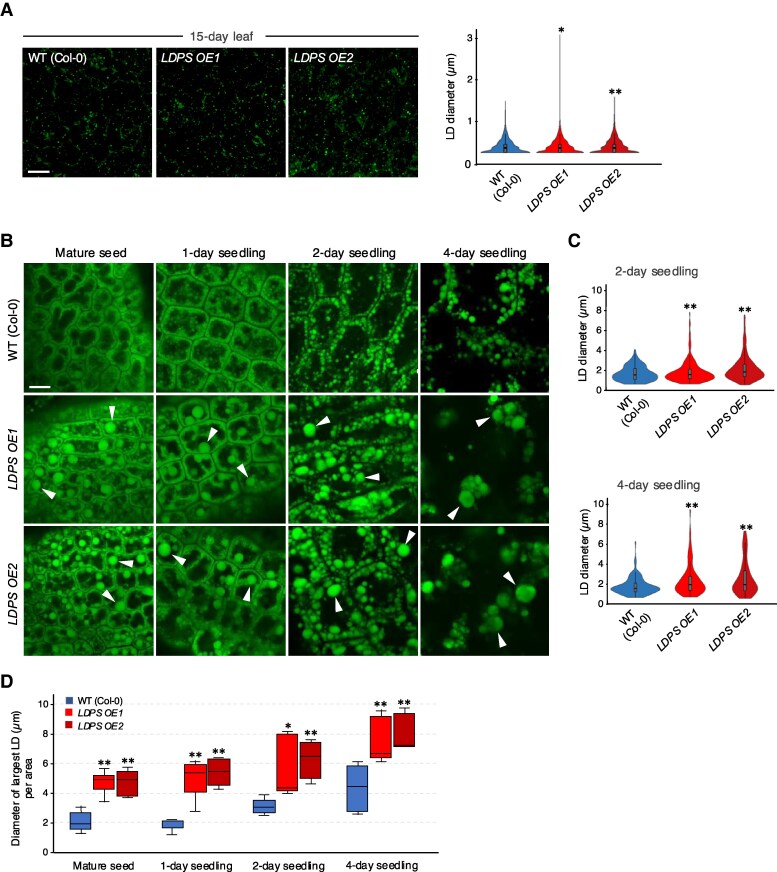
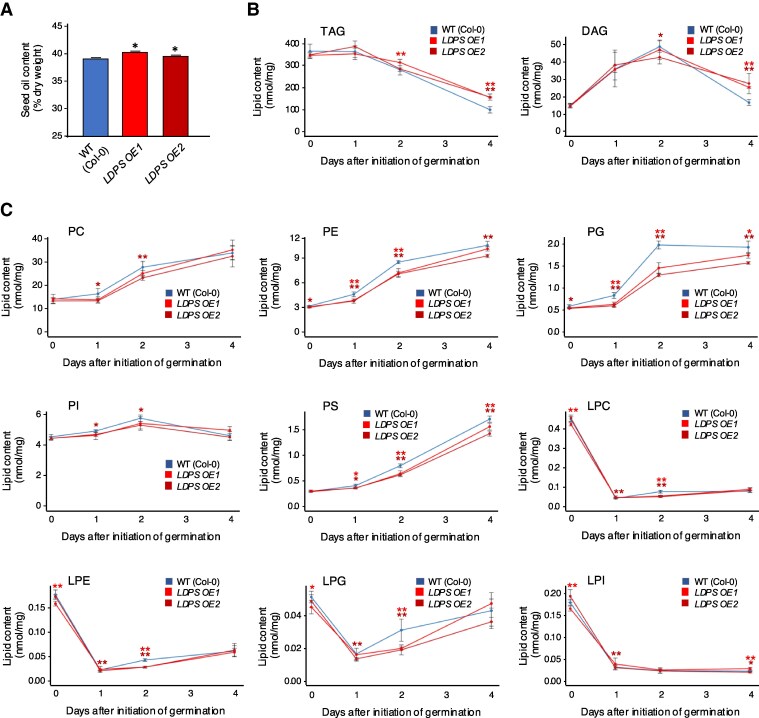
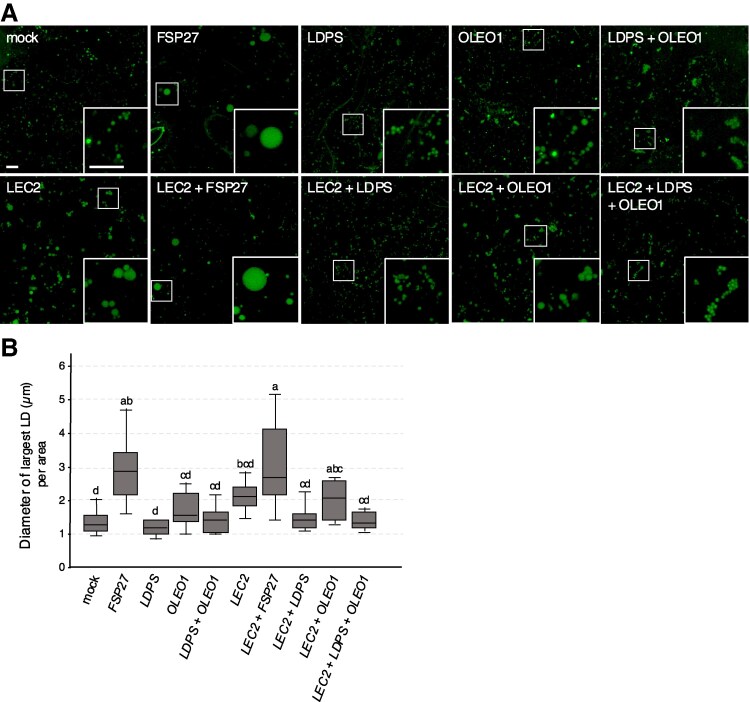
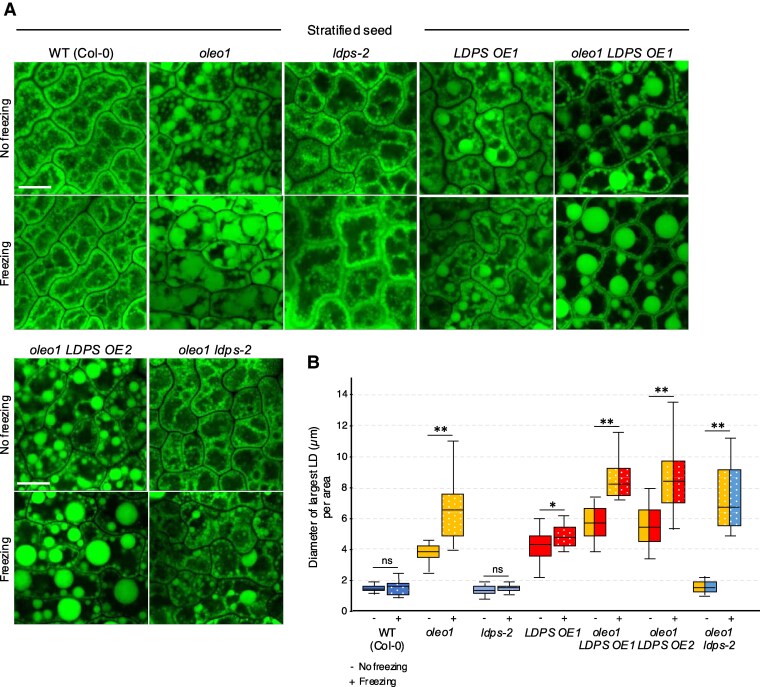
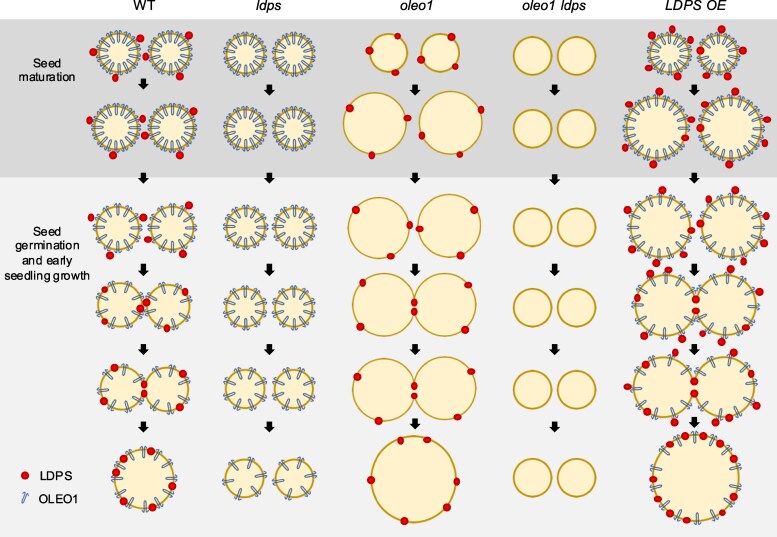
In oilseeds, energy-rich carbon is stored as triacylglycerols in organelles called lipid droplets (LDs). While several of the major biogenetic proteins involved in LD formation have been identified, the full repertoire of LD proteins and their functional roles remains incomplete. Here, we show that the low-abundance, seed-specific LD protein LIPID DROPLET PROTEIN OF SEEDS (LDPS) contains an amphipathic α-helix and proline hairpin motif that serves as an LD-targeting signal and a separate region that binds to the LD protein OLEOSIN 1 (OLEO1). Loss of LDPS function results in smaller LDs and less seed oil in comparison with wild type, while overexpression of LDPS results in an increase in LD size and seed oil content. Loss of LDPS function also results in an inability of LDs to undergo fusion during postgerminative seedling growth. Analysis of oleo1 and ldps single- and double-mutant seeds and freeze-thaw treatment of seeds revealed that OLEO1 suppresses the ability of LDPS to promote larger LDs. Collectively, our results identify LDPS as an important player in LD biology that functions together with OLEO1 to determine LD size in Arabidopsis (Arabidopsis thaliana) seeds and seedlings through a process that involves LD-LD fusion.


Conflict of interest statement

Conflict of interest statement. None declared.

Figures

Figure 1.
Figure 1.
Phylogenetic analysis and intracellular localization of LDPS homologs. A) Phylogenetic tree depicting the relationship of selected LDPS, LDPS-like, and 18CS homologs from various plant species, including eudicots, monocots, and seedless plants; refer to Supplementary Fig. S1 for the full phylogenetic tree based on all the LDPS protein homologs currently available at the Phytozome database (Goodstein et al. 2012). Included also in the tree is the LDPS homolog from tung tree (V. fordii), based on annotations of the tung tree transcriptome (Cui et al. 2018). Bootstrap values are indicated beside each branch point, and the scale bar represents the number of amino acid substitutions per site. Each protein is labeled with the respective genus and species. Phytozome transcript identifier numbers and sequences for all LDPS protein homologs analyzed in this tree are listed in Supplementary Data Sets 6 and 7. Proteins examined for their intracellular localization in (B) are indicated with asterisks. The 3 major clades of proteins were labeled LDPS, LDPS-like, or 18CS. B) Representative CLSM images of N. benthamiana leaf epidermal cells transiently transformed (as indicated with labels) with mCherry-tagged Arabidopsis LDPS (AtLDPS-mCherry), Arabidopsis 18CS (At18CS-mCherry), GFP-ER (serving as an ER marker protein), V. fordii LDPS (mCherry-VfLDPS), P. patens LDPS-like (PpLDPS-like-mCherry), or O. sativa 18CS (Os18CS-mCherry). LDs were stained with BODIPY. Shown also are the corresponding merged images. The boxes in the images in the top row represent the portion of the cell shown at higher magnification in the insets. Arrowheads indicate examples of mCherry-VfLDPS and PpLDPS-like LDPS localized to BODIPY-stained LDs. Bars = 5 μm and applies to all images and insets in the panel.
Figure 2.
Figure 2.
Intracellular localization of various Arabidopsis LDPS truncation mutants in N. benthamiana leaf cells. A) Schematic representation of full-length LDPS and various LDPS truncation mutants and their corresponding localization to LDs (+) or not (−) in N. benthamiana leaf epidermal cells. Refer to (B) for representative CLSM images of leaf cells transiently transformed with each construct shown in (A) and the corresponding BODIPY-stained LDs. Numbers above the illustration of full-length LDPS represent positions of specific amino acid residues, and the numbers next to the name of each construct denote the amino acids in LDPS that were fused to mCherry; note that the C-terminal-appended mCherry moiety is not depicted in the illustrations or construct names. B) Representative CLSM images of N. benthamiana leaf epidermal cells transiently transformed (as indicated with labels) with mCherry-tagged (B) full-length or truncated versions of Arabidopsis LDPS (refer to illustrations in A). The numbers in the name of each construct denote the amino acids in LDPS that were fused to mCherry; note that the C-terminal-appended mCherry moiety is not included in the construct labels. LDs were stained with BODIPY, and shown also are the corresponding merged images. Arrowheads indicate examples of full-length LDPS and certain mutants (i.e. LDPS80-360, LDPS80-307, and LDPS170-307) that localized to BODIPY-stained LDs. Bars = 5 μm and applies to all images in the panels.
Figure 3.
Figure 3.
Identification of a discrete internal region in Arabidopsis LDPS that is required for LD targeting. A) Deduced polypeptide sequence alignment of Arabidopsis LDPS and 18CS. Identical and similar amino acid residues are indicated with asterisks and colons or periods, respectively. Numbers to the right of each row of sequences represent specific amino acids for each protein. The structures of each protein were predicted using AlphaFold (refer to B). Sequences corresponding to internal “variable” regions of each protein (i.e. amino acids 191 to 242 in LDPS and 167 to 202 in 18CS), whose structures were predicted with lower confidence by AlphaFold, are highlighted in blue, while sequences corresponding to the high-confidence portion of the AlphaFold structure are shown in red; refer also to internal “variable” regions of other selected LDPS protein homologs in Supplementary Fig. S5. Sequences predicted by AlphaFold to form α-helices in each protein are underlined and the N-terminal sequences in both proteins (residues 1 to 114 in LDPS and 1 to 96 in 18CS) that are not shown in the AlphaFold-derived 3D models presented in (B) are italicized and not highlighted; the 3D structures of these N-terminal regions were not predicted with high confidence. Also, the sequence corresponding to amino acids 170 to 307 in LDPS, which is the minimally sufficient region for LD localization (refer to Fig. 2), and the corresponding sequence in 18CS (i.e. amino acids 150 to 258) are indicated with stippled lines above. B) 3D structures of a portion of Arabidopsis LDPS and 18CS, as predicted by AlphaFold. Amino acids in both proteins are colored based on their AlphaFold pLDDT score, with blue representing low model quality and red representing high model quality, as indicated in the key. The RMSD of differences in atomic positions between 219 pruned atom pairs of LDPS and 18CS proteins calculated by ChimeraX Matchmaker (Pettersen et al. 2021) is 0.885 Å. As indicated in (A), the low-confidence-structure, N-terminal regions of LDPS and 18CS (residues 1 to 114 and 1 to 96, respectively) were removed for visualization. Note also that the LD targeting information of LDPS is located within a polypeptide sequence that includes the variable blue region. Refer to Supplementary Fig. S6 for additional examples of the AlphaFold-based structures of LDPS, LDPS-like, and 18CS proteins (and their corresponding RMSD values compared to Arabidopsis LDPS) from selected plant species. C) Representative CLSM images of N. benthamiana leaf epidermal cells transiently transformed with mCherry-tagged Arabidopsis (full-length) 18CS and the mutant 18CS167-202Δ191-242, consisting of the internal “variable” region in 18CS (amino acid residues 167 to 202) replaced with the internal “variable” region in Arabidopsis LDPS (amino acid residues 191 to 242). The C-terminal-appended mCherry moiety is not included in the construct labels. LDs were stained with BODIPY and shown also are the corresponding merged images. Arrowheads indicate examples of colocalization of 18CS167-202Δ191-242-mCherry and BODIPY-stained LDs. Bar = 5 μm and applies to all images in the panel.
Figure 4.
Figure 4.
A predicted amphipathic α-helix and proline hairpin sequence in Arabidopsis LDPS function as an LD targeting signal. A) Alignment and Boxshade analysis of deduced polypeptide sequences of the internal “variable” regions in LDPS, LDPS-like, and 18CS proteins from selected plant species. Proteins are labeled with the abbreviation for their respective genus and species (e.g. At, Arabidopsis thaliana; Br, Brassica rapa, etc.), and correspond to those shown in the phylogenetic tree in Fig. 1A; refer also to the full-length polypeptide sequence alignment in Supplementary Fig. S5 and the AlphaFold protein structures presented in Supplementary Fig. S6. Amino acids that are identical or similar in 50% or more of the aligned sequences are indicated with black and gray shading, respectively. Numbers to the right of each row of sequences represent specific amino acids for each protein. The sequences corresponding to the internal “variable” regions of each protein (e.g. amino acids 191 to 242 in Arabidopsis LDPS) and those predicted with higher confidence by AlphaFold (refer to Fig. 3B and Supplementary Fig. S6), are highlighted in blue and red, respectively. The sequences in the variable region of each protein that are predicted by AlphaFold to form an amphipathic α-helix are underlined. The conserved proline at position 206 (P206) in Arabidopsis LDPS and the large hydrophobic residues in the predicted amphipathic α-helix in Arabidopsis LDPS (i.e. Y210, Y214, L218, I222, and L228) are indicated above the sequences with an arrowhead and asterisks, respectively; refer also to the helical wheel projection of the amphipathic α-helix in Arabidopsis LDPS in (B), as well as the three-dimensional model of the internal variable region of Arabidopsis LDPS shown in (C). B) Helical wheel projections of the predicted amphipathic α-helix in the “variable” region in Arabidopsis LDPS and 18CS. Shown are the α-helical wheel projections (based on HeliQuest) of the sequences in the “variable” regions of Arabidopsis LDPS (residues 209 to 233) and 18CS (residues 177 to 193). Hydrophobic amino acid residues are colored yellow, small-sized residues are gray, polar residues are pink or purple, and charged residues are red or blue. Asterisks denote the 5 conserved, large hydrophobic residues in the predicted α-helix in Arabidopsis LDPS (i.e. Y210, Y214, L218, I222, and L228) that were mutated to glutamic acids or valines; refer to the localization of the LDPS170-307-based mutant constructs shown in (D), as well as (A) and (C). Note the overall enrichment of large hydrophobic residues (i.e. I, L, Y, F, and M) on one side of the α-helical wheel for LDPS compared with 18CS, and the similar differences in the distribution of large hydrophobic residues in the α-helical wheel projections for selected LDPS and LDPS-like proteins compared with those for 18CS proteins in Supplementary Fig. S7. The arrow within each helical wheel projection corresponds to the direction of the hydrophobic moment, and the numbers shown represent the specific amino acids corresponding to the predicted α-helix in each protein, as depicted (underlined) also in (A). Shown also for both helical wheels are the corresponding hydrophobicity (H) and hydrophobic moment (μH) scores, based on HeliQuest; note the relatively higher hydrophobicity score for LDPS compared with 18CS and, likewise, for selected LDPS and LDPS-like proteins compared with 18CS proteins in Supplementary Fig. S7. C) 3D protein structure of the internal “variable” region in Arabidopsis LDPS (residues 191 to 242), as predicted by AlphaFold. The conserved proline at position 206 (P206) in the predicted proline hairpin structure and the 5 large hydrophobic residues located on the same face of the predicted amphipathic α-helix (i.e. Y210, Y214, L218, I222, and L228) are indicated. Note that the proline residue in the predicted proline hairpin structure in Arabidopsis LDPS is conserved in other LDPS and LDPS-like proteins (see [A]). D) Representative CLSM images of N. benthamiana leaf epidermal cells transiently transformed with mCherry-tagged full-length or truncated/mutated versions of Arabidopsis LDPS, including LDPSΔ209-227, which lacks residues 209 to 227, LDPS170-307 (consisting of residues 170 to 307 in LDPS, which is minimally sufficient for targeting to LDs; see Fig. 2) or LDPS170-307 with the large hydrophobic residues in the predicted amphipathic sequence replaced with either valines (LDPS170-307YYLILΔV5) or glutamic acids (LDPS170-307YYLILΔE5), or the conserved proline (P206) replace with an alanine (LDPS170-307PΔA); refer also to (A) to (C). Note that the C-terminal-appended mCherry moiety is not included in the construct labels. LDs were stained with BODIPY, and shown also are the corresponding merged images. Arrowheads denote examples of protein localization to BODIPY-stained LDs. Bar = 5 μm and applies to all images in the panel.
Figure 5.
Figure 5.
Disruption of LDPS expression influences LD size in Arabidopsis seeds and seedlings. A) Representative CLSM images of BODIPY-stained LDs in hypocotyl or cotyledon cells from WT (Nos-0) and ldps-1 embryos at various developmental stages, including (as indicated with labels) developing seeds from siliques at 10 to 12 d after flowering, mature (dry) seeds, and seedlings 1, 2, 3, and 4 d after the initiation of germination. Boxes in images represent the portion of the cells shown at higher magnification in the insets. Refer to Supplementary Fig. S9A for the corresponding CLSM images of WT (Col-0) and ldps-2 embryos at the same developmental stages. Bars = 5 μm and applies to all images and insets in the panel. B) Quantification of LD sizes in WT and ldps embryos in developing seeds and seedlings 2 and 3 d after the initiation of germination. Diameters of BODIPY-stained LDs were measured using ImageJ (refer to “Materials and methods” for details) and values shown in violin plots represent those obtained from 3 biological replicates, with each replicate consisting of 6 to 8 seed or seedling samples per plant line and 2 micrographs per sample, including those shown in (A) for WT (Nos-0) and ldps-1 and in Supplementary Fig. S9A for WT (Col-0) and ldps-2. Single and double asterisks represent statistically significant differences at P ≤ 0.05 and P ≤ 0.01 related to the corresponding WT and ldps plant lines, respectively, as determined by a two-tailed Student's t test. C) LD sizes in embryos of WT and ldps mature seeds based on imaging with an Airyscan CLSM. Shown on the left are representative images of BODIPY-stained LDs in cotyledon cells from (as indicated with labels) WT (Nos-0 and Col-0) and corresponding ldps-1 and ldps-2 embryos in mature seeds. Images shown were obtained using high-resolution Airyscan CLSM (rather than regular CLSM, as in (A) and for all other micrographs shown in this study) to better distinguish closely appressed, individual LDs in cells in mature seeds. Bar = 10 μm and applies to all images in the panel. Quantifications of LD diameters are shown in the violin plots on the right. LD diameters were measured using ImageJ and values shown represent those obtained from a data set of 10 micrographs per plant line, including those shown in the panel. Statistically significant differences of at least P ≤ 0.05, as denoted by asterisks, were determined by a two-tailed Student's t test. A summary of the statistical analysis for (B) and (C) is given in Supplementary Table S4.
Figure 6.
Figure 6.
LDPS influences Arabidopsis seed size, seed oil content, and the proportion of DAG in seeds, but is not involved in bulk LD coat protein turnover during postgerminative growth. A) Comparison of WT and ldps seed size. Mature (dry) seeds of each plant line (as indicated) were imaged using a document scanner, and the area of individual seeds was measured using ImageJ. Values represent the mean ± SD from 400 to 600 seeds from 8 plants for each plant line, and asterisks represent statistically significant differences (P ≤ 0.01) between ldps mutant plant lines and their respective WT controls, as determined by a two-tailed Student's t test. B) Comparison of WT and ldps seed oil content. Oil content as a percentage of dry weight in mature seeds from each plant line (as indicated) was determined using NMR. Values shown represent the means ± SD of 3 replicates of 50 mg of seeds for each line. Asterisks indicate statistically significant differences (P ≤ 0.05) between ldps mutant plant lines and their respective WT controls, as determined by a two-tailed Student's t test. C) Content of TAG, DAG, and MAG in WT and corresponding ldps mutant seeds and seedlings. Total lipids were extracted from mature seeds (indicated as 0 d) and seedlings harvested at 1, 2, and 4 d after the initiation of germination and analyzed by LC-MS/MS; refer to “Materials and methods” for additional details. Values represent the mean ± SD of the sum of individual lipid molecular species (in nmol/mg dry weight) for, as indicated with labels, TAGs, DAGs, and MAGs, identified from analysis of 4 biological replicates. The molecular species of each lipid class (Mol percentage) are shown in Supplementary Figs. S12 to S14. Single and double asterisks represent statistically significant differences at P ≤ 0.05 and P ≤ 0.01 related to the corresponding WT and ldps plant lines, respectively, as determined by a two-tailed Student's t test. D) Total abundance of LD coat proteins in proteomes derived from total protein extracts (TE) of WT (Nos-0) and ldps-1 seeds and seedlings. Proteins were isolated from total homogenates (and from corresponding LD-enriched fractions; see Supplementary Fig. S16A) of WT and ldps-1 mature (rehydrated) seeds and seedlings at 2 d after the initiation of germination. Total label-free quantification (LFQ) intensities of all proteins were summed from the LC-MS/MS data; refer to “Materials and methods” for details and Supplementary Data Sets 1 to 5 for the values and enrichment ratios for all proteins identified in all samples. All proteomics data are available also through the ProteomeXchange Consortium via the PRIDE partner repository (accession no. PXD041506); refer to Supplementary Table S3. Values shown in bar graphs are the mean ± SD per mille of total LFQ intensities for known Arabidopsis LD coat proteins, based on Ischebeck et al. (2020), in the TE (and in corresponding LD-enriched factions; refer to Supplementary Fig. S16A) from 5 biological replicates (i.e. 5 separate total protein extractions and LD isolations per plant line); refer to the PCA plot of the TE and LD-enriched protein groups from the 5 replicates of each stage presented in Supplementary Fig. S16B. Each class of LD coat proteins, including CLOs, HSDs, LDAPs, and OLEOs, as well as other LD proteins that were plotted together (referred to as “Other”), is colored according to the key. No statistically significant differences were found in the total abundance of LD coat proteins in the TE of WT and ldps-1 seeds and 2-day-old seedlings, based on two-tail Student's t test (i.e. P ≥ 0.05); ns, not significant. CLO, caleosin; HSD, hydroxysteroid dehydrogenase (steroleosin); LDAP, LD-associated protein; OLEO, oleosin. Refer also to Supplementary Data Set 1 for additional results for individual protein abundance, including known LD coat proteins, summed from LC-MS/MS data. A summary of the statistical analysis for (A) to (D), as well as the allied results presented Supplementary Fig. S16, is given in Supplementary Table S4.
Figure 7.
Figure 7.
Characterization of LDPS protein–protein interactions and identification of regions within LDPS and OLEO1 required for their colocalization at LDs. A) mbSUS analysis of LDPS and various known Arabidopsis LD biogenetic proteins in yeast. LDPS-Cub, serving as “bait” and consisting of full-length Arabidopsis LDPS fused to the C-terminal half of ubiquitin (Cub), as well as the transcriptional reporter protein complex ProteinA-LexA-VP1, was cotransformed into yeast (Saccharomyces cerevisiae) cells along with various “prey” proteins, including: NubWT, consisting of the native sequence for the N-terminal half of ubiquitin (Nub), which has high affinity for Cub and serves as a positive control with the “bait” (i.e. LDPS-Cub); Nub32, which contains a point mutation in the Nub sequence that results in low affinity for Cub and serves as a negative control with LDPS-Cub; or Nub32 fused to various full-length Arabidopsis LD biogenetic proteins, as indicated. Refer to Supplementary Fig. S18 for western blot analysis of total proteins extracted from each yeast strain, confirming expression of each Nub and Cub construct. Yeast cells were plated as serial dilutions of 1.0 or 0.1 OD600 on both low- and high-stringency conditions (i.e. synthetic complete [SC]-LWM and SC-LWMHAU), the latter of which requires protein–protein interactions for yeast growth. Both sets of plates also contained 5, 50, or 500 μM methionine (Met), which allows for control of LDPS-Cub expression via its Met-repressible promoter. Selection plates also included X-Gal (SC-LWMHAU + X-Gal), which provided an additional qualitative measure of protein–protein interaction; refer to Materials and methods for additional details on mbSUS assays. Plasmid combinations are shown to the left, and the images of the corresponding serial dilutions are shown on the right. Note the appearance of growth (and blue coloration) on higher selection media of yeast expressing LDPS-Cub and NubWT, but no growth when LDPS-Cub was coexpressed with Nub32, indicating the lack of autoactivation. The results are representative of at least 5 separate cotransformations of yeast with each plasmid combination. Representative CLSM images of N. benthamiana leaf epidermal cells transiently (co)transformed with (as indicated with labels) B) LDPSΔ209-227-mCherry and GFP-tagged Arabidopsis LDAP3 (GFP-LDAP3) or OLEO1 (OLEO1-GFP), C) LDPS1-216-mCherry or LDPS210-416-mCherry with OLEO1-GFP, or D) OLEO11-43-GFP or GFP-OLEO1116-173 without or with LDPS-mCherry; refer to topology model of Arabidopsis OLEO1 in Supplementary Fig. S19C. Shown also are the corresponding merged images. In (D), LDs were stained with MDH, and arrowheads in (B) to (D) indicate examples of protein colocalization at LDs. Note that OLEO1-GFP expressed on its own localizes to LDs, as expected (refer to Supplementary Fig. S19B), and that the localization of LDAP3 to LDs in N. benthamiana cells has been reported elsewhere (Pyc et al. 2021). Bars in (B) to (D) = 5 μm and applies to all images in the panels.
Figure 8.
Figure 8.
Constitutive overexpression of LDPS influences LD size in seeds and seedlings, in Arabidopsis. A) LD sizes in leaves of Arabidopsis WT and LDPS OE plant lines. Shown on the left are representative CLSM images of BODIPY-stained LDs in leaf epidermal cells of 15-day-old WT (Col-0) and LDPS OE1 and LDPS OE2 plants, as indicated with labels. Bar = 10 µm and applies to all the images in the panel. Quantifications of LD diameters are shown in the violin plots on the right. LD diameters were measured using ImageJ, and values shown represent those obtained from 3 biological replicates, with each replicate consisting of 6 to 8 leaf samples per plant line and 2 micrographs per leaf sample, including those shown in the panel. Single and double asterisks represent statistically significant differences at P ≤ 0.05 and P ≤ 0.01 related to the corresponding WT and LDPS OE plant lines, respectively, as determined by a two-tailed Student's t test. B) Representative CLSM images of BODIPY-stained LDs in hypocotyl or cotyledon cells from Arabidopsis WT (Col-0) and LDPS OE1 and OE2 embryos at various developmental stages, including (as indicated with labels) mature seeds, and seedlings 1, 2, and 4 d after the initiation of germination. Arrowheads indicate examples of “supersized” LDs in LDPS OE seeds and seedlings that are absent in WT. Bar = 10 μm and applies to all images in the panel. C) Quantification of LD sizes in WT and LDPS OE embryos in seedlings 2 and 4 d after the initiation of germination. LD diameters were measured using ImageJ, and values shown in violin plots represent those obtained from 3 biological replicates, with each replicate consisting of 6 to 8 leaf samples per plant line and 2 micrographs per leaf sample, including those shown in (B). Double asterisks represent statistically significant differences at P ≤ 0.01 related to the corresponding WT and LDPS OE plant lines, respectively, as determined by a two-tailed Student's t test. D) Quantification of the largest LDs in cells of WT and LDPS OE seeds and seedlings. Values shown represent the diameters (in μm) of the largest LDs per area for each line, based on the same data set (i.e. micrographs) in (B) and (C). Data are summarized in a boxplot with the following details: center line, median; box limits, upper and lower quartiles; whiskers, 1.5 × interquartile range. Single and double asterisks represent statistically significant differences at P ≤ 0.05 and P ≤ 0.01 related to the corresponding WT and LDPS OE plant lines, respectively, as determined by a two-tailed Student's t test. Refer to key for the corresponding color and plant line. A summary of the statistical analysis for (A), (C), and (D) is given in Supplementary Table S4.
Figure 9.
Figure 9.
Overexpression of LDPS influences Arabidopsis seed oil content and the content and composition of TAG, DAG, and phospholipids during postgerminative growth. A) Comparison of Arabidopsis WT (Col-0) and LDPS OE seed oil content. Oil content as a percentage of dry weight in mature seeds from each plant line (as indicated with labels) was determined using NMR. Values represent the means ± SD of 3 replicates of 50 mg of seeds for each plant line. Asterisks indicate statistically significant differences (P ≤ 0.05) between LDPS OE plant lines and WT, as determined by a two-tailed Student's t test. B) and C) Content of TAG, DAG, and polar lipids in Arabidopsis WT (Col-0) and LDPS OE seeds and seedlings. Total lipids were extracted from, as indicated by the keys, WT and LDPS OE1 and OE2 mature seeds (indicated as 0 d) and seedlings harvested at 1, 2, and 4 d after the initiation of germination and analyzed by LC-MS/MS. Values represent the mean ± SD of the sum of individual lipid molecular species (in nmol/mg dry weight) in B) TAGs and DAGs and C) various phospholipids, identified from analysis of 5 biological replicates. The individual molecular species of TAG and DAG (Mol percentage) are shown in Supplementary Figs. S21 and S22. Single and double asterisks represent statistically significant differences at P ≤ 0.05 and P ≤ 0.01 related to WT and LDPS OE plant lines, as determined by a two-tailed Student's t test. A summary of the statistical analysis for (A) to (C) is given in Supplementary Table S4. LPC, lysophosphatidylcholine; LPE, lysophosphatidylethanolamine: LPG, lysophosphatidylglycerol; LPI, lysophosphatidylinositol; PC, phosphatidylcholine; PE, phosphatidylethanolamine PG, phosphatidylglycerol, PI, phosphatidylinositol; PS, phosphatidylserine.
Figure 10.
Figure 10.
Influence of ectopic expression of FSP27, LDPS, and/or OLEO1 in N. benthamiana leaves on LD size, with or without coexpressed LEC2. A) Representative CLSM images of N. benthamiana leaf epidermal cells transiently transformed (as indicated with labels) with P19 alone (i.e. “mock” transformation) and mCherry, serving as a cell transformation marker, and also nontagged FSP27, LDPS, and/or OLEO1, including in the absence of LEC2 (top row of images) or in the presence of LEC2 (bottom row of images). LDs were stained with BODIPY. The boxes represent the portion of the cells shown at higher magnification in the insets. Bar = 5 μm and applies to all images and insets in the panel. B) Quantification of the largest LDs in N. benthamiana leaf cells transformed, as in (A), with P19 and mCherry, nontagged FSP27, LDPS, and/or OLEO1, and with or without LEC2. Values shown represent the maximum diameters (in μm) of the largest LDs per area from 3 biological replicates (i.e. transformations) of 5 images per construct(s), based on measurements of the dataset, including those in (A), using ImageJ. Data are summarized in a boxplot with the following details: center line, median; box limits, upper and lower quartiles; whiskers, 1.5 × interquartile range. Significant differences are indicated at least at P ≤ 0.05, as determined by a one-way ANOVA followed by Tukey's post hoc multiple comparison test, and letters above the bars indicate the results of those tests. A summary of the statistical analysis is given in Supplementary Table S4.
Figure 11.
Figure 11.
Freezing treatment prior to seed stratification reveals that LDPS and OLEO1 function together to influence LD size in Arabidopsis seeds. A) Representative CLSM images of BODIPY-stained LDs in hypocotyl cells in stratified seeds from (as indicated with labels) WT (Col-0), oleo1, ldps-2, LDPS OE1, oleo1 LDPS OE1 and OE2, and oleo1 ldps-2 plant lines that were either exposed or not exposed to a freezing treatment (i.e. −25 °C for 24 h) prior to seed stratification, according to Shimada et al. (2008). Refer also to Supplementary Fig. S25 for corresponding results for 3-day-old seedlings from the same plant lines exposed or not exposed to freezing treatment prior to seed stratification. Bars = 10 μm and applies to all images in the panel. B) Quantification of the largest LDs in WT, oleo1, ldps-2, LDPS OE1, oleo1 LDPS OE1 and OE2, and oleo1 ldps-2-stratified seeds with (+) and without (−) freezing treatment prior to seed stratification. Values shown represent the maximum diameters (in μm) of the largest LDs per area from 3 biological replicates (i.e. transformations) of 8 images per plant line, based on measurements of the dataset (i.e. micrographs), including those shown in (A), using ImageJ. Data are summarized in a boxplot with the following details: center line, median; box limits, upper and lower quartiles; whiskers, 1.5× interquartile range. Single and double asterisks represent statistically significant differences at P ≤ 0.05 and P ≤ 0.01; ns, not significant (i.e. P ≥ 0.05), corresponding to each plant line with or without freezing treatment, as determined by a two-tailed Student's t test. A summary of the statistical analysis is given in Supplementary Table S4.
Figure 12.
Figure 12.
Model for the roles of LDPS and OLEO1 in modulating LD size in seeds and young seedlings in Arabidopsis. In WT seeds, LDs are coated primarily with OLEOs, including, as shown, OLEO1, as well as LDPS, which is a low-abundance protein that localizes to LDs using 2 potential mechanisms: an amphipathic α-helix and proline hairpin motif that binds directly to the LD surface or its N-terminal region that associates with LD-associated OLEO1. When OLEO1 concentration is high, LDPS associates with LDs primarily through interaction with OLEO1. When OLEO1 concentration is low, LDPS binds directly to the LD surface. In doing so, LDPS promotes the fusion of LDs in a process that likely requires another hitherto unknown seed-specific protein(s) or molecular component(s), since the expression of LDPS on its own in leaves is not sufficient for inducing robust LD–LD fusion. During seed maturation in WT (left side of top panel), OLEO1 concentration is high, and although LDPS accessibility to the LD surface is limited, it still contributes to a small amount of LD–LD fusion. This activity is supported by observations of LDs in ldps-maturing seeds, which lack LDPS resulting in slightly smaller, but statistically significant differences in comparison with WT. In oleo1 maturing seeds, OLEO1 is absent and LDPS has increased access to the LD surface, resulting in enhanced LD–LD fusion and increased LD size relative to WT. By contrast, LDs do not increase in size in oleo1 ldps double-mutant maturing seeds, since LDPS (and OLEO1) is absent, and no LD–LD fusion takes place. In maturing seeds of LDPS OE lines, OLEO1 concentration is similar to WT, but the higher relative concentration of LDPS increases competitive binding for the LD surface, which stimulates LD–LD fusion and growth. During seed germination and early seedling growth (bottom panel of figure), OLEO1 concentration is reduced via the PUX10-mediated pathway, which increases the opportunity for LDPS to bind to the LD surface. This increased binding of LDPS promotes LD–LD fusion and the enlargement of LDs observed at 2 to 4 d postgermination. The relative concentration of LDPS is also likely enhanced by gene expression, which is known to be highest for LDPS at earliest stages of postgerminative seedling growth. In ldps mutant seedlings, LDs remain small during postgerminative growth, despite a reduction in OLEO1 concentration, because LDPS is absent and unable to promote LD–LD fusion. In oleo1 mutant plants, on the contrary, the larger LDs observed in mature seeds continue to grow in size, because LDPS is present and promotes further LD–LD fusion. In oleo1 ldps double-mutant seedlings, LDs remain small, since LDPS is absent and unable to promote LD–LD fusion. Lastly, in the LDPS OE seedlings, the large LDs present in mature seeds continue to grow in size, since LDPS concentration is high, resulting in continued LD–LD fusion and growth. Additional support for an unknown, seed-specific factor/component(s) in LDPS-promoted LD–LD fusion is the lack of any obvious changes in LD size in LDPS OE leaves. See the main text for additional details on potential LDPS activity.

Similar articles

Cited by

References

    1. Abell BM, Hahn M, Holbrook LA, Moloney MM. Membrane topology and sequence requirements for oil body targeting of oleosin. Plant J. 2004:37(4):461–470. 10.1111/j.1365-313X.2003.01988.x - DOI - PubMed
    1. Abell BM, High S, Moloney MM. Membrane protein topology of oleosin is constrained by its long hydrophobic domain. J Biol Chem. 2002:277(10):8602–8610. 10.1074/jbc.M103712200 - DOI - PubMed
    1. Abell BM, Holbrook LA, Abenes M, Murphy DJ, Hills MJ, Moloney MM. Role of the proline knot in oleosin endoplasmic reticulum topology and oil body targeting. Plant Cell. 1997:9(8):1481–1493. 10.1105/tpc.9.8.1481 - DOI - PMC - PubMed
    1. Barneda D, Planas-Iglesias J, Gaspar ML, Mohammadyani D, Prasannan S, Dormann D, Han G-S, Jesch SA, Carman GM, Kagan V, et al. The brown adipocyte protein CIDEA promotes lipid droplet fusion via a phosphatidic acid-binding amphipathic helix. eLife. 2015:4:e07485. 10.7554/eLife.07485 - DOI - PMC - PubMed
    1. Baud S, Santos Mendoza M, To A, Harscoët E, Lepiniec L, Dubreucq B. WRINKLED1 specifies the regulatory action of LEAFY COTYLEDON2 toward fatty acid metabolism during seed maturation in Arabidopsis. Plant J. 2007:50(5):825–838. 10.1111/j.1365-313X.2007.03092.x - DOI - PubMed

MeSH terms

Substances