. 2025 Aug;37(8):e70046.
doi: 10.1111/jne.70046. Epub 2025 May 15.

Maternal high fat and high sugar diet impacts on key DNA methylation enzymes in offspring brain in a sex-specific manner

Affiliations

Maternal high fat and high sugar diet impacts on key DNA methylation enzymes in offspring brain in a sex-specific manner

Kahyee Hor et al. J Neuroendocrinol. 2025 Aug.

Abstract

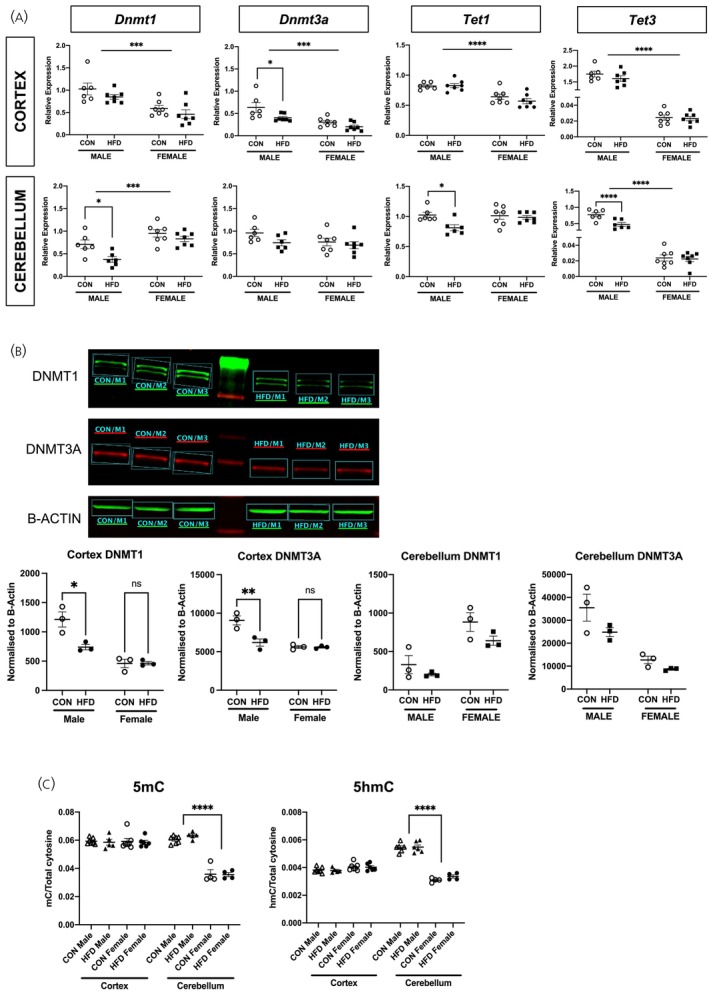
Maternal obesity associates with an increased risk of offspring neurodevelopmental disorders. Although the underlying mechanism(s) remain unclear, evidence suggests a role for altered DNA methylation. We utilized a murine model of diet-induced obesity to investigate the impact of maternal obesity on the offspring brain transcriptome and DNA methylation. C57Bl/6 dams were fed high-fat high-sugar (HFD, n = 7) or control (CON, n = 7) diets. Maternal obesity/hyperglycemia associated with offspring growth restriction, with brain-sparing specifically in females. Postnatal hypoglycemia was seen in HFD males, but not females. The 3' RNA-sequencing revealed perturbations in metabolic and cell differentiation pathways in neonatal male and female offspring frontal cortex and cerebellum. Compared with controls, HFD males, but not females, had lower cortical and cerebellar DNMT gene and protein expression, and reduced cerebellar TET enzyme mRNA. Whilst female offspring had lower cerebellar 5-methylcytosine (5mC) and 5-hydroxymethylcytosine (5hmC) than males, there were no effects of HFD on 5mC/5hmC in cortex or cerebellum in either sex. Our data suggest that maternal obesity has sex-specific effects on fetal neurodevelopment, including enzymes involved in DNA methylation/demethylation. These mechanisms may play a role in the increased risk of neurodevelopmental disorders following obese/diabetic pregnancies, including increased male susceptibility to these disorders.

Keywords: DNA methylation; epigenetics; neurodevelopment; obesity; pregnancy.


Conflict of interest statement

The authors declare no conflicts of interest.

Figures

FIGURE 1
FIGURE 1
Mouse model of high‐fat high‐sugar diet (HFD)‐induced obesity. N = 7 in each diet group, and offspring from the second mating cycle were retrieved for dissection and further analysis. aBreeding cycle 1 confirmed dam breeding ability. bOnly dams that successfully fell pregnant in breeding cycle 1 were included in breeding cycle 2 (proven breeders). #Offspring from breeding cycle 1 was killed on postnatal day 1. §Offspring from breeding cycle 2 were retrieved on postnatal day 1 for downstream experiments (Created using BioRender).
FIGURE 2
FIGURE 2
Effects of HFD on dams and offspring. (A–C) Dam characteristics. (A) Repeated measures ANOVA showed that HFD dams (black squares) were consistently heavier than CON dams (blank circles) during the pre‐mating, gestational and postnatal period (F(6,69) = 4.754, p = .0004). (B) HFD dams were more hyperglycemic than CON (repeated measures ANOVA, F(4,57) = 1.505, p = .213). (C) HFD dams had higher plasma insulin than CON (unpaired t‐test, p = .004). (D–G) Offspring characteristics at postnatal day 1. (D) In both male and female offspring, HFD offspring were lighter than CON (Male CON 1.44 ± 0.02 g, HFD 1.24 ± 0.03 g, p = .0006; Female CON 1.39 ± 0.04 g, HFD 1.20 ± 0.03 g, p = 012. F(1,24) = 41.03, p < .0001). (E) There were no differences in brain weight between HFD versus CON offspring (Male CON 0.088 ± 0.003 g, HFD 0.085 ± 0.002 g, p = .767; Female CON 0.086 ± 0.003 g, HFD 0.084 ± 0.002 g, p = .943. F(1,24) = 0.3688, p = .549). (F) There were no differences in brain:body weight ratio between HFD versus CON male offspring (CON 0.061 ± 0.002 g, HFD 0.069 ± 0.002 g, 0.074). However, HFD female offspring had a higher brain:body weight ratio than CON (CON 0.062 ± 0.002 g, HFD 0.070 ± 0.002 g, p = .039). (G) HFD male offspring had a lower blood glucose than CON, however this difference was not observed among female offspring (Male CON 3.36 ± 0.014 mmol/L, HFD 2.40 ± 0.27 mmol/L, p = .035. Female CON 3.50 ± 0.18 mmol/L, HFD 2.99 ± 0.39 mmol/L, p = .332). All values are mean ± SEM and statistical analyses were performed with repeated measures two‐way ANOVA, followed by post hoc analysis with Šidák test where applicable (*p < .05, **p < .01, ***p < .001, ****p < .0001).
FIGURE 3
FIGURE 3
Transcriptomic analysis of offspring cortex and cerebellum. (A) PCA plots of HFD versus CON male and female cortex and cerebellum. There was no clustering between biological replicates within each gender and diet group (purple dots, CON; blue dots, HFD). (B–E) Gene Set Enrichment Analysis of HFD versus CON male (B) and female (C) cortex, and male (D) and female (E) cerebellum. The top 10 upregulated and downregulated pathways have been displayed, except in the female cortex (C) where there were no upregulated pathways. (F, G) Venn diagram demonstrating genes with upregulated (up‐reg DEG) and downregulated (down‐reg DEG) log2 fold change in HFD versus CON male and female cortex (F) and cerebellum (G) (included genes with p‐value <.05). (H–K) Transcription factor (TF) analysis demonstrating transcription factors with increased log2fold change in male (H) and female (I) cerebellum. TFs with increased (J) and decreased (K) log2 fold change in male cortex.
FIGURE 4
FIGURE 4
Offspring DNMT and TET enzyme, and 5mC/5hmC levels. (A) RT‐qPCR of Dnmt1, Dnmt3a, Tet1, and Tet3 in HFD versus CON male and female cortex and cerebellum. In the cortex, gene expression of Dnmt1 (F(1,23) = 21.05, p = .0001), Dnmt3a (F(1,23) = 20.81, p = .0001), Tet1 (F(1,23) = 31.44, p < .0001), and Tet3 (F(1,23) = 744.7, p < .0001) in female offspring was lower than males (indicated by horizontal bar). Exposure to HFD did not impact on the expression of these genes in offspring cortex (Dnmt1, F(1,23) = 2.947, p = .99; Tet1, F(1,23) = 0.754, p = .394; Tet2, F(1,23) = 1.398, p = .249), except in males where Dnmt3a expression was lower in HFD vs. CON offspring (p = .022, indicated by bracket). In the cerebellum, Dnmt1 expression was higher in female offspring when compared with males (F(1,22) = 20.98, p = .0001), whereas Tet3 expression was lower in females than in males (F(1,22) = 221.9, p < .0001) (indicated by horizontal bars). Exposure to maternal HFD associated with reduced expression of Dnmt1 (p = .038), Tet1 (p = .038), and Tet3a (p = .0003) in male (indicated by bracket), but not female, offspring cerebellum (n = 6/diet group in males, n = 7/diet group in females). (B) Protein expression of both DNMT1 (p = .026) and DNMT3A (p = .019) was reduced in HFD male cortex when compared with controls (n = 3/diet group). There were no differences in DNMT1 and DNMT3A protein expression in HFD versus CON female cortex, as well as cerebellum in both males and females. (C) Global 5mC and 5hmC levels. There were no differences in 5mC and 5hmC levels between diet groups (F(1,37) = 0.057, p = .813). However, in the cerebellum, 5mC and 5hmC concentration was greater in male vs. female offspring (5mC, F(1,37) = 118.5, p < .0001; 5hmC, F(1,37) = 150.2, p < .0001. Indicated by brackets). Unless otherwise stated, repeated measures ANOVA testing was performed.

Similar articles

Cited by

References

    1. Kelly T, Yang W, Chen CS, Reynolds K, He J. Global burden of obesity in 2005 and projections to 2030. Int J Obes (Lond). 2008;32(9):1431‐1437. doi: 10.1038/ijo.2008.102 - DOI - PubMed
    1. Wang YC, McPherson K, Marsh T, Gortmaker SL, Brown M. Health and economic burden of the projected obesity trends in the USA and the UK. The Lancet. 2011;378(9793):815‐825. doi: 10.1016/S0140-6736(11)60814-3 - DOI - PubMed
    1. Ng M, Fleming T, Robinson M, et al. Global, regional, and national prevalence of overweight and obesity in children and adults during 1980–2013: a systematic analysis for the global burden of disease study 2013. The Lancet. 2014;384(9945):766‐781. doi: 10.1016/S0140-6736(14)60460-8 - DOI - PMC - PubMed
    1. Kanagalingam MG, Forouhi NG, Greer IA, Sattar N. Changes in booking body mass index over a decade: retrospective analysis from a Glasgow Maternity Hospital. BJOG. 2005;112(10):1431‐1433. doi: 10.1111/j.1471-0528.2005.00685.x - DOI - PubMed
    1. Deputy NP, Dub B, Sharma AJ. Prevalence and trends in prepregnancy normal weight—48 states, New York City, and District of Columbia, 2011–2015. Morbidity and Mortality Weekly Report (MMWR). 2018;66:1402‐1407. - PMC - PubMed

LinkOut - more resources