. 2025 Aug:74:303-318.
doi: 10.1016/j.jare.2025.05.031. Epub 2025 May 13.

NSP6 regulates calcium overload-induced autophagic cell death and is regulated by KLHL22-mediated ubiquitination

Affiliations

NSP6 regulates calcium overload-induced autophagic cell death and is regulated by KLHL22-mediated ubiquitination

Xingyu Tao et al. J Adv Res. 2025 Aug.

Abstract

Introduction: Severe acute respiratory syndrome coronavirus 2 (SARS-CoV-2) poses a substantial global threat. SARS-CoV-2 nonstructural proteins (NSPs) are essential for impeding the host replication mechanism while also assisting in the production and organization of new viral components. However, NSPs are not incorporated into viral particles, and their subsequent fate within host cells remains poorly understood. Additionally, their role in viral pathogenesis requires further investigation.

Objectives: This study aimed to discover the ultimate fate of NSP6 in host cells and to elucidate its role in viral pathogenesis.

Methods: We investigated the effects of NSP6 on cell death and explored the underlying mechanism; moreover, we examined the degradation mechanism of NSP6 in human cells, along with analysing its correlation with coronavirus disease 2019 (COVID-19) severity in patient peripheral blood mononuclear cells (PBMCs).

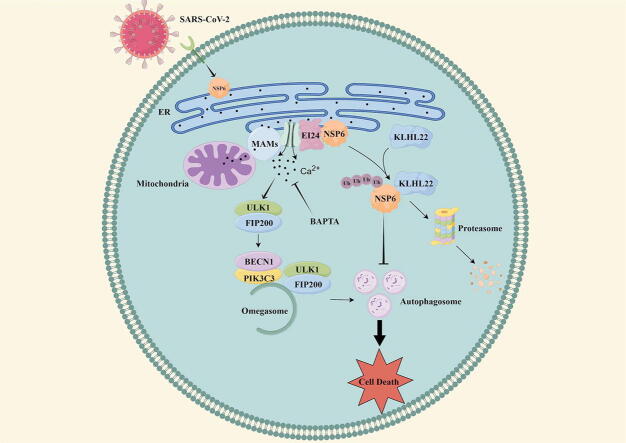
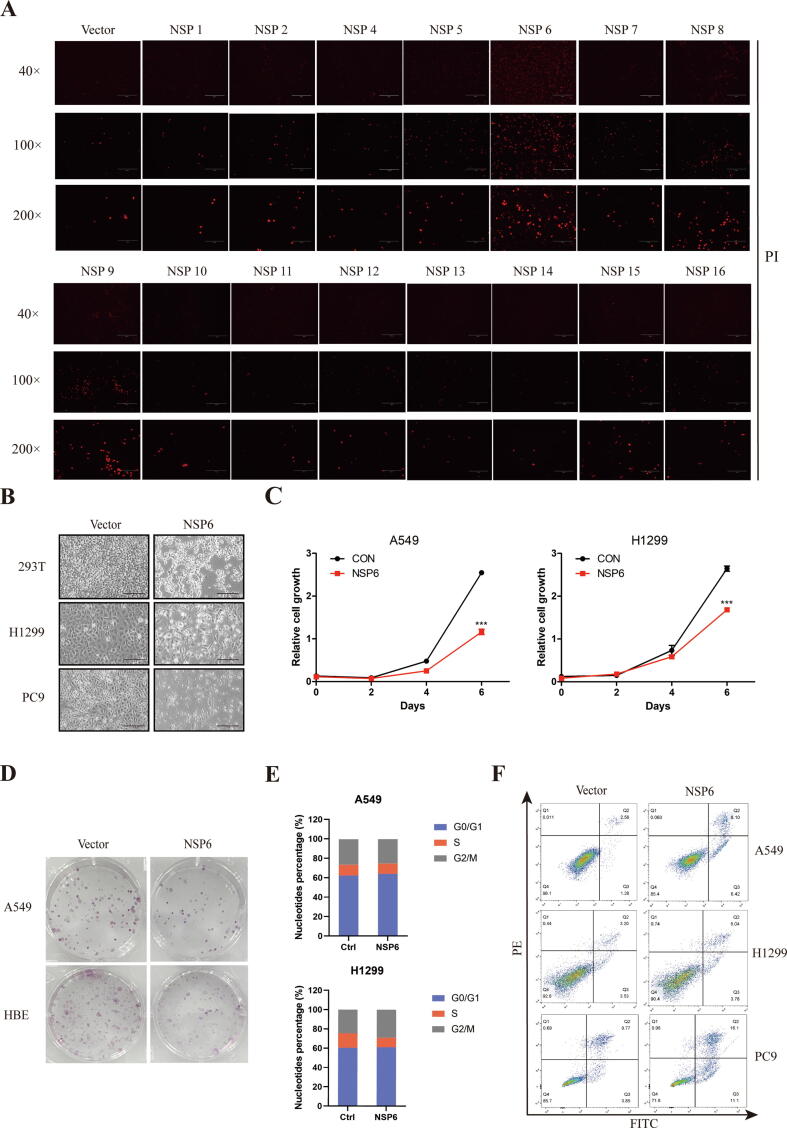
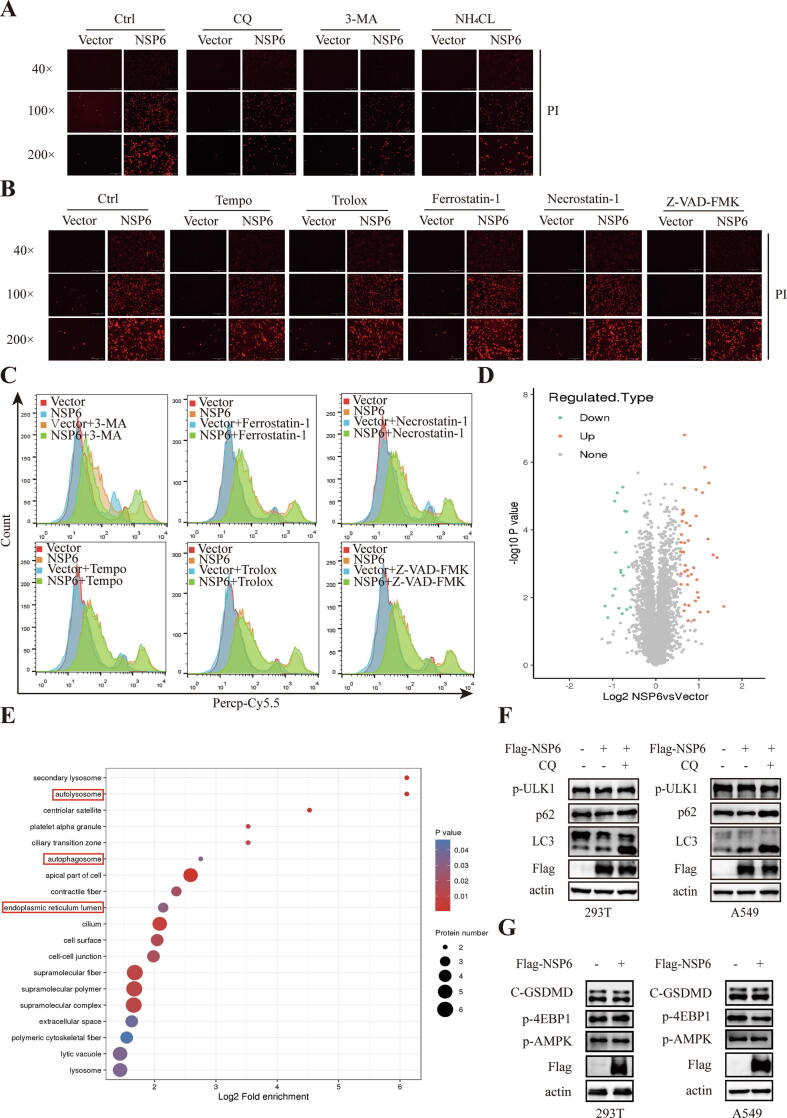
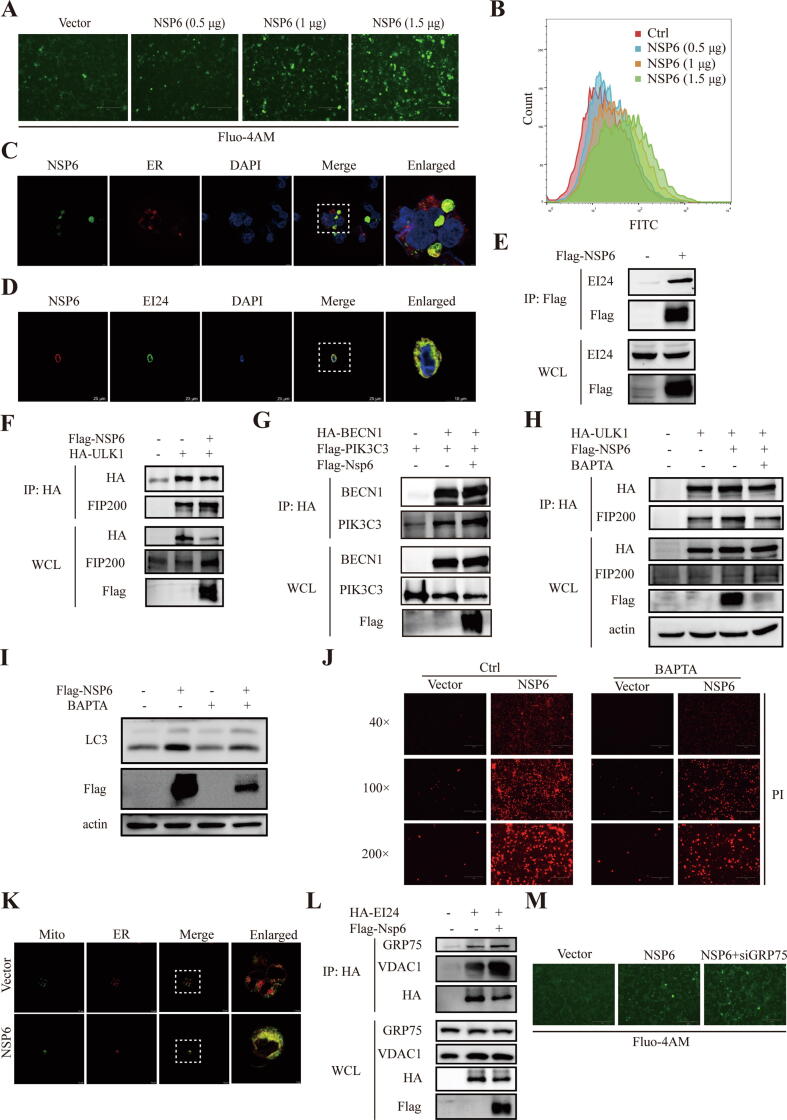
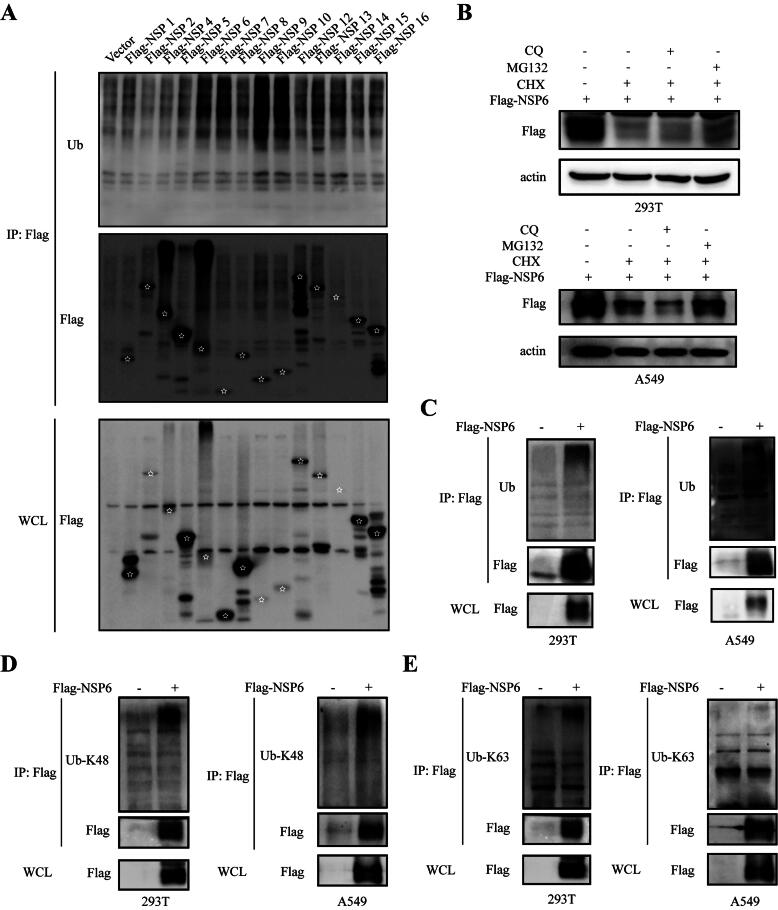
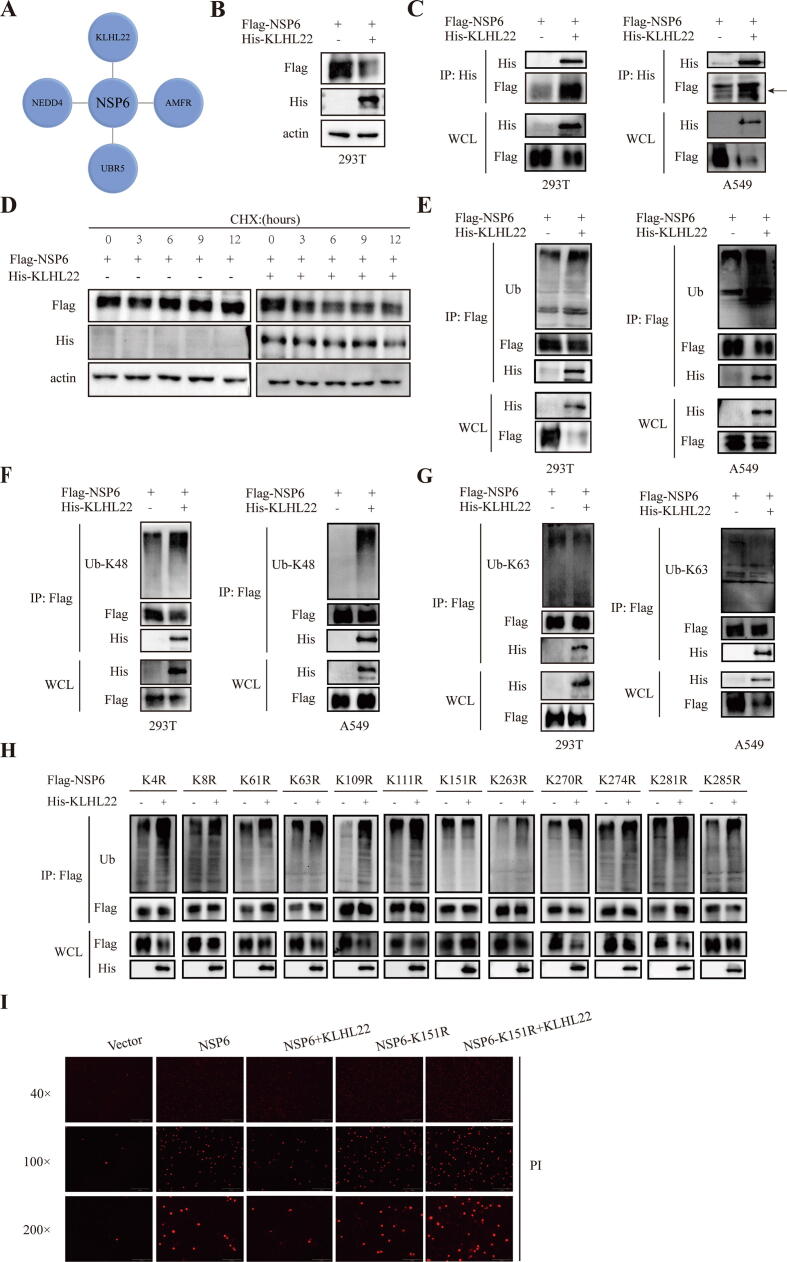
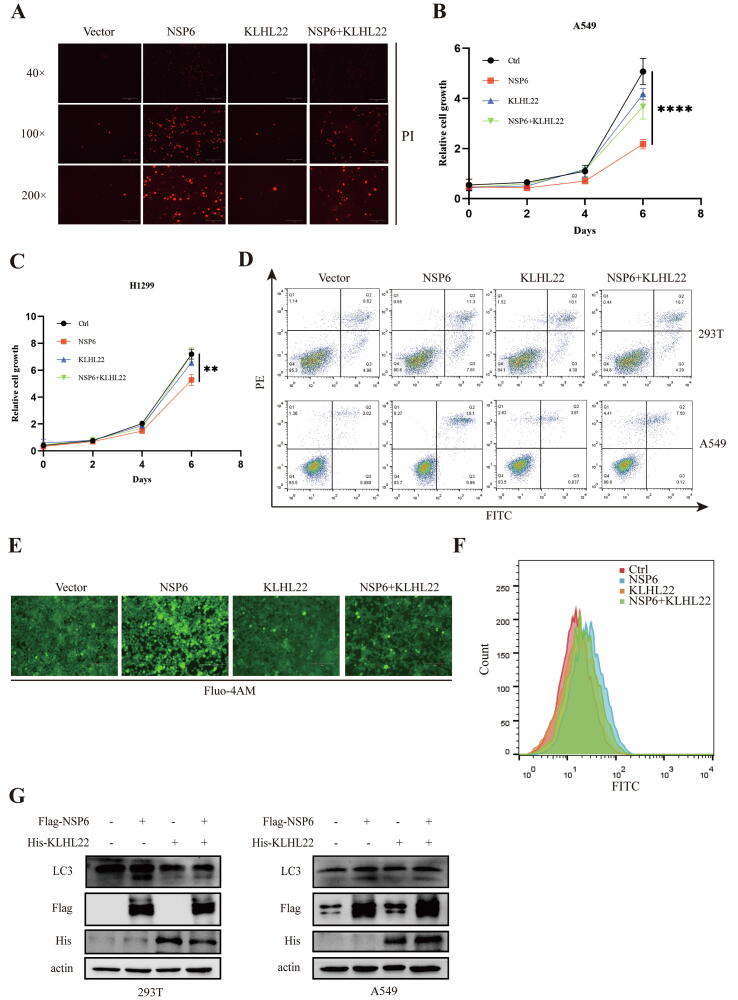
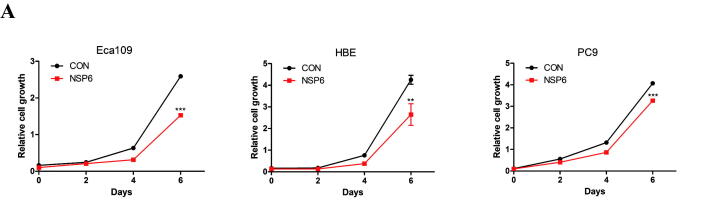
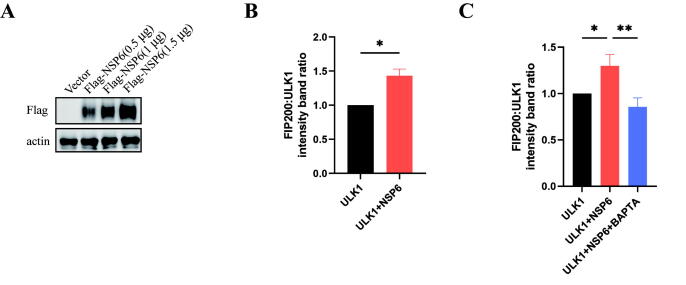
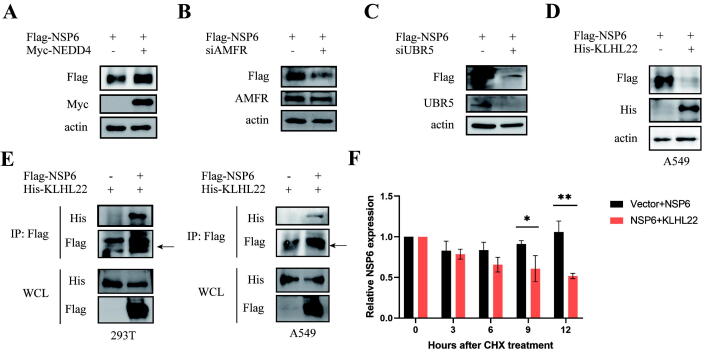
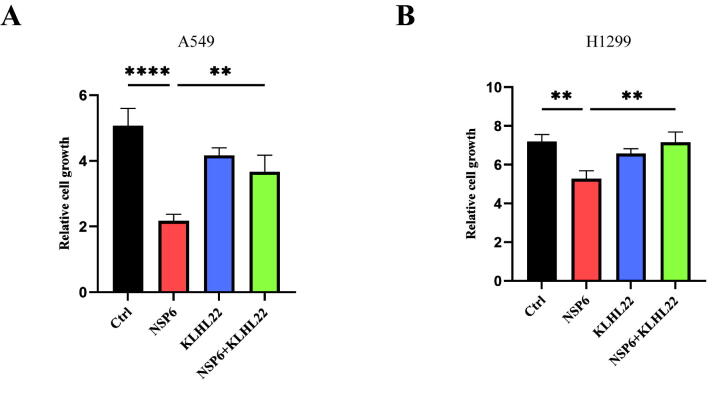
Results: NSP6 was demonstrated to induce cell death. Specifically, NSP6 interacted with EI24 autophagy-associated transmembrane protein (EI24) to increase intracellular Ca2+ levels, thereby enhancing the interactions between unc-51-like autophagy activating kinase 1 (ULK1) and RB1 inducible coiled-coil 1 (RB1CC1/FIP200), as well as beclin 1 (BECN1) and phosphatidylinositol 3-kinase catalytic subunit type 3 (PIK3C3). This cascade ultimately triggers autophagy, thus resulting in cell death. Additionally, we discovered that the homeostasis of the NSP6 protein was regulated by K48-linked ubiquitination. We identified kelch-like protein 22 (KLHL22) as the E3 ligase that was responsible for ubiquitinating and degrading NSP6, restoring intracellular calcium homeostasis and reversing NSP6-induced autophagic cell death. Moreover, NSP6 expression levels were observed to be positively associated with the severity of SARS-CoV-2-induced disease.

Conclusion: This study reveals that KLHL22-mediated ubiquitination controls NSP6 stability and that NSP6 induces autophagic cell death via calcium overload, highlighting its cytotoxic role and suggesting therapeutic strategies that target calcium signaling or promote NSP6 degradation as potential interventions against COVID-19.

Keywords: Autophagy; Calcium overload; KLHL22; NSP6; SARS-CoV-2; Ubiquitination.


Conflict of interest statement

Declaration of competing interest The authors declare that they have no known competing financial interests or personal relationships that could have appeared to influence the work reported in this paper.

Figures

None
Graphical abstract
Fig. 1
Fig. 1
Overexpressing SARS-CoV-2 NSP6 induces cell death. (A) 293 T cells were transfected with SARS-CoV-2 NSP plasmids, and cell death was assessed 24 h later using PI staining. Red fluorescence indicates dead cells. Magnification: 40×, 100×, and 200×. (B) 293 T, H1299, and PC9 cells were transfected with the NSP6 plasmid for 24 h. The changes of cell morphological was investigated. Scale bar: 150 μm. Magnification: 200×. (C) The NSP6 plasmid was transfected in A549 and H1299 cells. After 24 h, cell growth assay was performed. The data represent the averages of three independent experiments (mean ± SD). ***P < 0.001. (D) A549 and HBE cells were transfected with the NSP6 plasmid. Colony formation assay was conducted 10 days post-transfection. (E) A549 and H1299 cells were transfected with the NSP6 plasmid. Flow cytometry was utilized to analyze the cell cycle 24 h post-transfection. (F) A549, H1299, and PC9 cells were transfected with the NSP6 plasmid. Flow cytometry was employed to analyze the apoptosis 24 h post-transfection. (For interpretation of the references to colour in this figure legend, the reader is referred to the web version of this article.)
Fig. 2
Fig. 2
SARS-CoV-2 NSP6 promotes cell death via the activation of autophagy. (A and B) 293 T cells, which had been transfected with the NSP6 plasmid, were treated separately with CQ (20 μM), 3-MA (2.5 mM), NH4CL (2 mM), Tempo (25 μM), Trolox (100 μM), ferrostatin-1 (2 μM), necrostatin-1 (30 μM), and Z-VAD-FMK (10 μM) for 24 h. PI staining analysis of dead cells. Magnification: 40×, 100×, and 200×. (C) 293 T cells transfected with the NSP6 plasmid were treated with 3-MA, Tempo, Trolox, ferrostatin-1, necrostatin-1, Z-VAD-FMK for 24 h. Fluorescence intensity analysis was down by flow cytometry. (D and E) Proteomic analysis was conducted on 293 T cells that had been transfected with either control vector or the NSP6 plasmid. A volcano plot was created to show the differences in protein expression between the vector-transfected and NSP6-overexpressing groups (D). GO analysis was done based on the protein expression differences between the two groups (E). (F) 293 T and A549 cells, after being transfected with the NSP6 plasmid, were treated with 20 μM CQ for 24 h. Subsequently, expressions of p-ULK1, p62, and LC3 were detected through western blotting analysis. (G) 293 T and A549 cells were transfected with the NSP6 plasmid for 24 h, the expressions of C-GSDMD, p-4EBP1, and p-AMPK were analyzed by western blotting.
Fig. 3
Fig. 3
NSP6 activates autophagy by regulating calcium overload to increase the interaction between ULK1 and FIP200, as well as PIK3C3-BECN1 complex formation. (A and B) Intracellular Ca2+ levels were monitored in 293 T cells transfected with different doses (0.5 μg, 1 μg, and 1.5 μg) of the NSP6 plasmid using the Ca2+ indicator Fluo-4 AM (2 μM). Data were collected via an inverted immunofluorescence microscope (A) and flow cytometry (B). The scale bar represents 150 μm, with a magnification of 200×. (C) 293 T cells were transfected with the NSP6 plasmid, and 24 h later, the colocalization of NSP6 with the ER was assessed through immunofluorescence staining. Cells were stained with anti-Flag (green), ER-Tracker (red), and DAPI (blue), with a scale bar of 2.5 μm. (D) 293 T cells were transfected with the NSP6 plasmid. The colocalization of NSP6 with EI24 was evaluated by immunofluorescence staining 24 h post-transfection. Cells were stained with anti-Flag (red), anti-EI24 (green), and DAPI (blue), with a scale bar of 10 μm. (E) 293 T cells were transfected with the NSP6 plasmid, followed by IP using anti-Flag beads and immunoblotting with anti-EI24. WCL denotes the whole cell lysate. (F) 293 T cells were cotransfected with plasmids encoding ULK1 and either NSP6 or control vector. IP assay was carried out using an anti-HA antibody 24 h post-transfection. Western blotting analysis of FIP200 expression were conducted. (G) 293 T cells were cotransfected with plasmids encoding PIK3C3 and BECN1 or NSP6, followed by IP with anti-HA beads and immunoblot analysis with anti-BECN1 and anti-PIK3C3 24 h post-transfection. (H) 293 T cells cotransfected with plasmids encoding ULK1 and either NSP6 or control vector were treated with BAPTA (20 μM) for 24 h, followed by IP with anti-HA beads. Western blotting analysis of FIP200 expression were conducted. (I) 293 T cells transfected with the NSP6 plasmid were treated with BAPTA for 24 h, and western blotting analysis was performed to assess the expression of LC3. (J) 293 T cells transfected with the NSP6 plasmid were treated with BAPTA for 24 h. Fluorescence intensity was investigated with red fluorescence indicating dead cells. Magnification: 40×, 100×, and 200×. (K) 293 T cells were transfected with the NSP6 plasmid. The colocalization of mitochondria with the ER was assessed by confocal microscopy 24 h post-transfection. Cells were labeled with ER-Tracker (red) and Mito-Tracker (green), with a scale bar of 1 μm. (L) 293 T cells were cotransfected with EI24 and NSP6 or vector plasmids. IP assay was performed using anti-HA beads 24 h post-transfection, followed by western blotting with anti-GRP75 and anti-VDAC1 antibodies. (M) Ca2+ levels in the vector, NSP6, and NSP6+siGRP75 groups were assessed using Fluo-4 AM, with data captured through inverted immunofluorescence microscopy. The scale bar is 300 μm, and the magnification is 100×. (For interpretation of the references to colour in this figure legend, the reader is referred to the web version of this article.)
Fig. 4
Fig. 4
NSP6 undergoes ubiquitination in host cells. (A) 293 T cells were transfected with either control vector or plasmids encoding NSPs. Subsequently, IP assay was carried out using anti-Flag beads 24 h post-transfection, followed by immunoblot analysis with an anti-Ub antibody to detect ubiquitination. (B) 293 T and A549 cells transfected with a plasmid encoding NSP6 were treated with CHX (20 μg/mL) only, CHX and MG132 (20 μM), CHX and CQ (20 μM) for 24 h. Western blotting analysis was then performed to examine the expression levels of NSP6. (C) 293 T and A549 cells were transfected with a plasmid encoding NSP6, IP assay was conducted using anti-Flag beads 24 h post-transfection, followed by immunoblot analysis with an anti-Ub antibody to detect ubiquitination. (D and E) 293 T and A549 cells were transfected with a plasmid encoding NSP6, IP assay was conducted using anti-Flag beads 24 h post-transfection, and immunoblot analysis was then performed using specific antibodies against Ub-K48 (D) and Ub-K63 (E) to determine the ubiquitination linkage types.
Fig. 5
Fig. 5
Lysine residue 151 of NSP6 serves as a critical site for KLHL22-mediated ubiquitination and subsequent degradation. (A) Potential E3 ligases that interact with NSP6 were identified using BIOGRID. (B) 293 T cells were transfected with plasmids encoding NSP6 and KLHL22. The expression of NSP6 was subsequently confirmed by western blotting analysis 24 h post-transfection. (C) 293 T and A549 cells were transfected with plasmids encoding NSP6 and KLHL22. IP was carried out using anti-His beads to purify and isolate the proteins of interest 24 h post-transfection. Immunoblot analysis with anti-Flag and anti-His antibodies, the black arrow indicates the position of NSP6. (D) A549 cells transfected with plasmids encoding NSP6 and KLHL22 were treated with CHX (20 μg/mL) for different times. The expression levels of NSP6 were analyzed using western blotting. (E) 293 T and A549 cells were transfected with plasmids encoding NSP6 and KLHL22, or with control vector plasmid. IP assay was conducted using anti-Flag beads 24 h post-transfection, and immunoblot analysis with an anti-Ub antibody was performed to assess ubiquitination. (F and G) 293 T and A549 cells were transfected with plasmids encoding NSP6 and KLHL22. IP assay was carried out using anti-Flag beads 24 h post-transfection, and immunoblot analysis was conducted using specific antibodies against Ub-K48 (F) or Ub-K63 (G) to determine the ubiquitination linkage types associated with NSP6. (H) 293 T cells were engineered to express plasmids coding for NSP6 KR variants along with KLHL22. At 24 h after transfection, these cells underwent immunoprecipitation using anti-Flag beads, and ubiquitination levels were subsequently evaluated via western blotting with anti-Ub antibody. (I) 293 T cells were transfected with plasmids carrying either control vector, NSP6, NSP6 and KLHL22, NSP6 K151R mutant, NSP6 K151R mutant and KLHL22. At 24 h after transfection, cell viability of these groups was then compared by assessing cell death through PI staining.
Fig. 6
Fig. 6
The regulatory effects of NSP6 on host cell functions depend on KLHL22-mediated ubiquitination and degradation. (A) 293 T cells were transfected with NSP6 and KLHL22 plasmids. At 24 h after transfection, PI staining analysis of dead cells. Magnification: 40×, 100×, and 200 × . (B and C) A549 (B) and H1299 (C) cells were transfected with NSP6 and KLHL22 plasmids, cell growth assay was conducted. The data represent the averages of three independent experiments (mean ± SD). **P < 0.01, ****P < 0.0001. (D) 293 T and A549 cells were transfected with plasmids encoding NSP6 and KLHL22. Flow cytometry was employed to analyze the apoptosis 24 h post-transfection. (E and F) Intracellular Ca2+ levels were monitored by a fluorescence microscope (E) and flow cytometry (F) in 293 T cells transfected with NSP6 and KLHL22 plasmids using Fluo-4 AM. Scale bar: 150 μm. Magnification: 200 × . (G) 293 T and A549 cells were transfected with plasmids encoding NSP6 and KLHL22, LC3 expression levels were then assessed by western blotting 24 h post-transfection.
Fig. 7
Fig. 7
The level of NSP6 expression is directly related to the severity of SARS-CoV-2-induced disease. (A) 293 T cells were transfected with plasmids encoding NSP6-Delta and KLHL22, and NSP6-Delta expression was verified by western blotting 24 h post-transfection. (B) 293 T cells were transfected with plasmids encoding NSP6-Delta and KLHL22, IP assay was conducted using anti-Flag beads 24 h post-transfection, followed by immunoblot with an anti-Ub antibody to check ubiquitination of NSP6-Delta. (C) 293 T cells were transfected with plasmids encoding either NSP6 or NSP6-Delta. At 24 h after transfection, cell death was analyzed by PI staining at magnifications of 40×, 100×, and 200×. (D) RT-qPCR was used to measure NSP6 mRNA levels in PBMCs from mild or ordinary COVID-19 patients. Representative results from three experiments showed statistical significance using two-sided unpaired t-tests. *P < 0.05. (E) Western blotting was used to assess LC3 protein levels in PBMCs from mild or ordinary COVID-19 patients.
Supplementary Figure 1
Supplementary Figure 2
Supplementary Figure 3
Supplementary Figure 4

Similar articles

References

    1. Bradley B.T., Maioli H., Johnston R., Chaudhry I., Fink S.L., Xu H., et al. Histopathology and ultrastructural findings of fatal COVID-19 infections in washington state: a case series. Lancet. 2020;396:320–332. doi: 10.1016/S0140-6736(20)31305-2. - DOI - PMC - PubMed
    1. Steiner S., Kratzel A., Barut G.T., Lang R.M., Aguiar Moreira E., Thomann L., et al. SARS-CoV-2 biology and host interactions. Nat Rev Microbiol. 2024;22:206–225. doi: 10.1038/s41579-023-01003-z. - DOI - PubMed
    1. Brant A.C., Tian W., Majerciak V., Yang W., Zheng Z.-M. SARS-CoV-2: from its discovery to genome structure, transcription, and replication. Cell Biosci. 2021;11:136. doi: 10.1186/s13578-021-00643-z. - DOI - PMC - PubMed
    1. Ma X., Zou F., Yu F., Li R., Yuan Y., Zhang Y., et al. Nanoparticle vaccines based on the receptor binding domain (RBD) and heptad repeat (HR) of SARS-CoV-2 elicit robust protective immune responses. Immunity. 2020;53:1315–1330.e9. doi: 10.1016/j.immuni.2020.11.015. - DOI - PMC - PubMed
    1. Lee J.-H., Choi M., Jung Y., Lee S.K., Lee C.-S., Kim J., et al. A novel rapid detection for SARS-CoV-2 spike 1 antigens using human angiotensin converting enzyme 2 (ACE2) Biosens Bioelectron. 2021;171 doi: 10.1016/j.bios.2020.112715. - DOI - PMC - PubMed

Substances

LinkOut - more resources